

Sample Category Title
Rapid Assault on Crypto
Market Overview
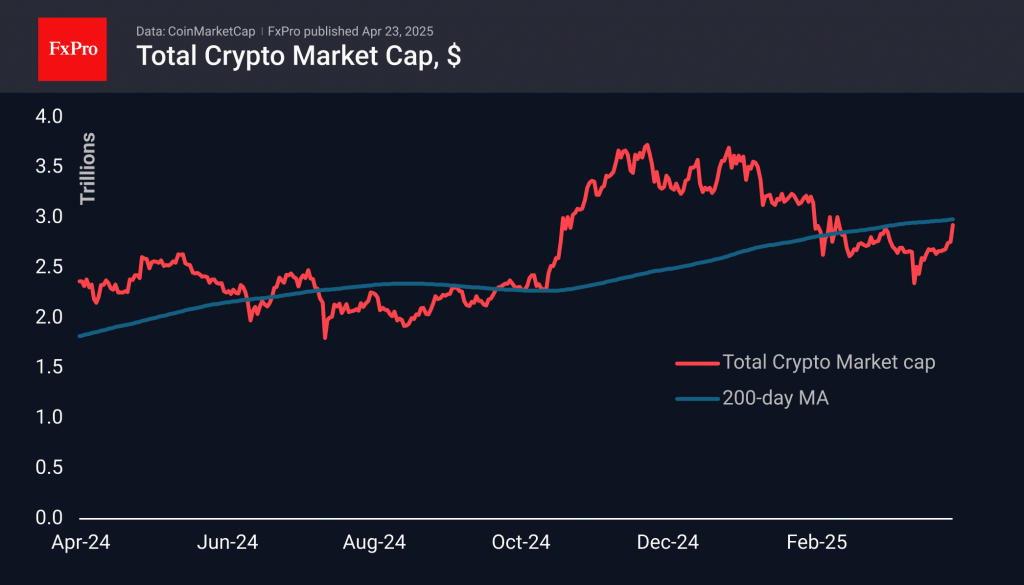
The cryptocurrency market capitalisation surged by 6.4% in the past 24 hours, reaching $2.95 trillion — its highest level in seven weeks and a confident return to a key round figure. Global financial markets underpinned this rally. However, it’s worth noting that the market was already gaining ground on Monday, in defiance of declining stock indices.
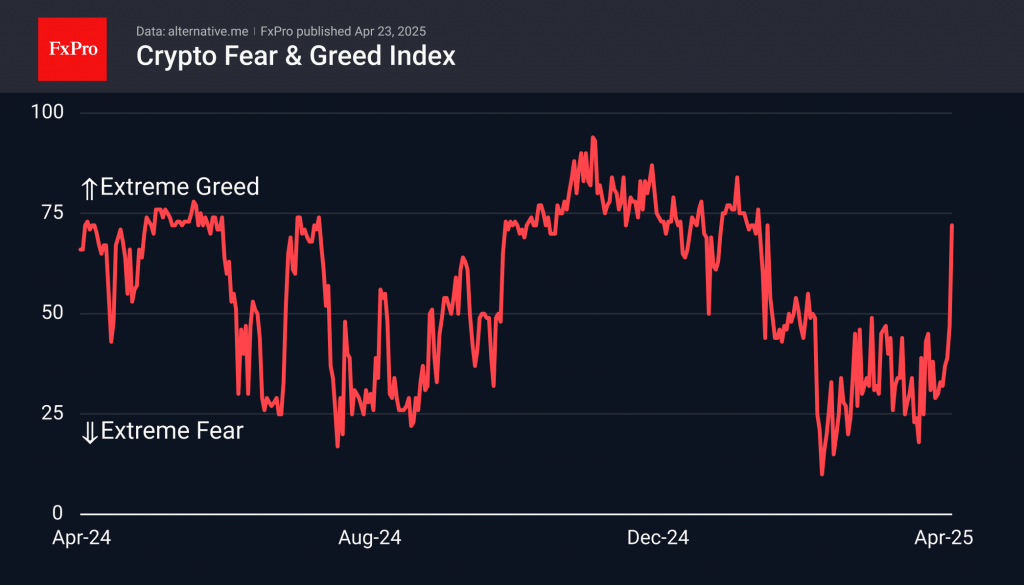
Sentiment in the cryptocurrency space has swiftly shifted towards greed and is now steps away from extreme greed, with the relevant index climbing to 72, the highest since late January.
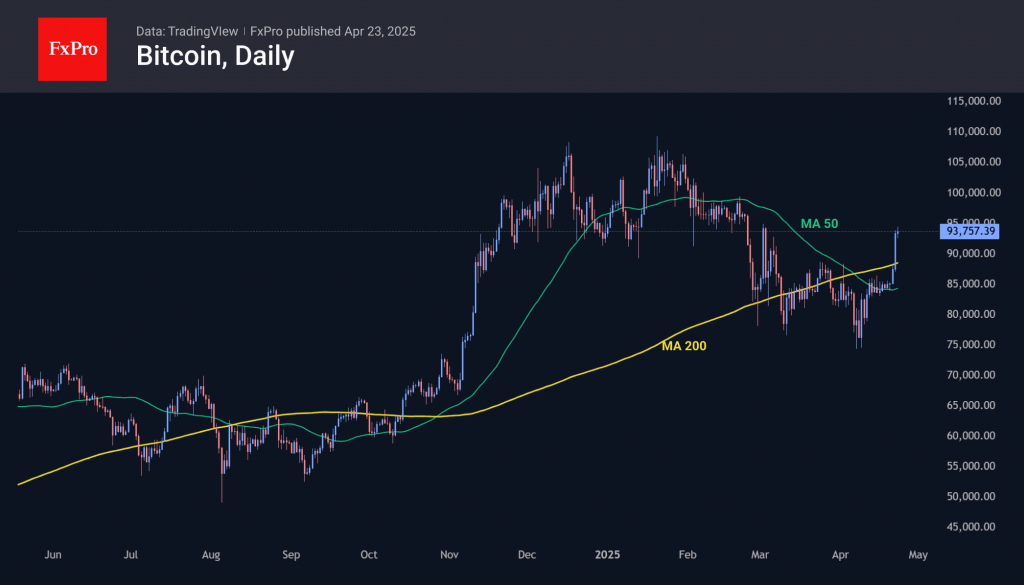
Bitcoin is nearing the $94,000 mark, which it briefly surpassed in early March. Sustained trading above this level was last observed in late February, before the most recent sell-off began. The market has signalled a clear bullish trend, initiating a sharp rise from the 50-day moving average and breaking through the 200-day with determination. In recent days, the price has also exceeded the downward resistance that had been in place since late January. The next target seems to be the $96,000 region, but the broader picture suggests a rally gaining momentum with the potential to challenge all-time highs near $110,000.
News Background
Last week, MicroStrategy acquired an additional 6,556 BTC for $555.8 million at an average price of $84,785 per coin. The company now holds 538,200 BTC, accumulated at an average cost of $67,766. The total investment is estimated at $36.47 billion.
Shares of consumer goods producer Upexi skyrocketed more than sixfold after the company announced that Solana would be adopted as a reserve asset. The company plans to bolster its position in SOL and stake the tokens it possesses.
According to Lookonchain, Mike Novogratz’s Galaxy Digital has exchanged $105 million worth of Ethereum for Solana over the past fortnight.
Paul Atkins has officially been sworn in as the new Chair of the US SEC. He has stated that developing a clear and comprehensible regulatory framework for digital assets is a top priority.
According to Politico, the ECB is concerned that President Trump’s backing of the crypto industry could trigger “financial contagion” and adversely impact the European economy. The regulator is particularly apprehensive about the escalating influence of US dollar-backed stablecoins.
XAU/USD: Reaction at $3,300 Support Zone to Generate Near-Term Direction Signal
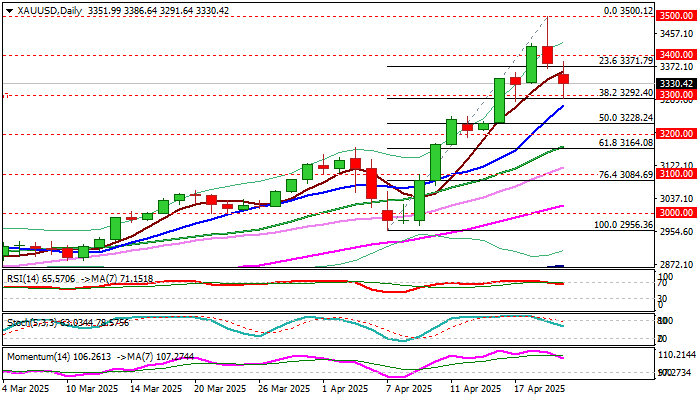
Gold remains in red for the second straight day and hit support at $3300 in early Wednesday, in extension of quick pullback from new record high at $3500, posted on Tuesday.
Significance of $3500 level which many analysts saw as 2025 target and strongly overbought daily studies contributed to profit-taking that pushed the price around $200 in past 24 hours.
Significant change in President Trump’s rhetoric over tariffs on China’s imports, in which he greatly eased tensions by signaling much lower tariffs, as well as comment that there was no plan to fire Fed Chair Powell, resulted in fresh pressure on gold price.
Pullback from new all-time high so far found a solid ground at $3300 zone (psychological/Fibo 38.2% of $2956/$3500 upleg/rising daily Tenkan-sen) with subsequent bounce suggesting that near-term bears might be running out of steam.
Daily close above 3300 would generate an initial signal of a healthy correction, which was to provide better levels to re-enter larger bullish market.
However, this scenario still needs confirmation, with minimum requirement seen on daily close above broken Fibo 23.6% ($3371) and return and close above $3400.
On the other hand, daily RSI emerged from overbought territory, 14-d momentum is heading south, and both indicators show more space at the downside that keeps in play risk of further easing.
Key factors that will influence gold’s direction in the near term will be the magnitude of change in market sentiment over Trump’s latest much softer and reconciliating tone.
On the other hand, persisting geopolitical tensions and growing concerns over predominantly negative economic outlook (IMF slashed its outlook for US and global growth, although denied immediate threats of recession for the US) are expected to continue to fuel safe haven demand.
From that perspective, gold price is likely to resume its rally after a brief pause, with firm break of $3500 to open the door towards $4000, which many already see as next target.
Levels to be watched below $3300 are $3228 and $3200, while upper pivots lay at $3371 and $3400, guarding $3430 and $3500.
Res: 3371; 3400; 3430; 3500.
Sup: 3300; 3285; 3228; 3200.
Gold Price Plunges After Climbing to $3,500 for the First Time
As the XAU/USD chart shows:
- Yesterday, the spot gold price stopped just a few cents short of the key psychological level of $3,500 (and even exceeded it on the futures market);
- But this morning, an ounce is trading around $3,300, having dropped aggressively by more than 5%.
Why Did Gold Suddenly Drop?
The sharp decline followed a shift in rhetoric from President Trump. According to Reuters:
- The US President backed away from threats to dismiss Federal Reserve Chair Jerome Powell;
- He also signalled a more moderate stance on tariffs against China.
Market participants interpreted this as a reason to take profits on long positions, as the softened tone from the White House reduced demand for safe-haven assets. As a result, gold collapsed from its historic high, while the US dollar index rebounded from multi-month lows.
Technical Analysis of the XAU/USD Chart
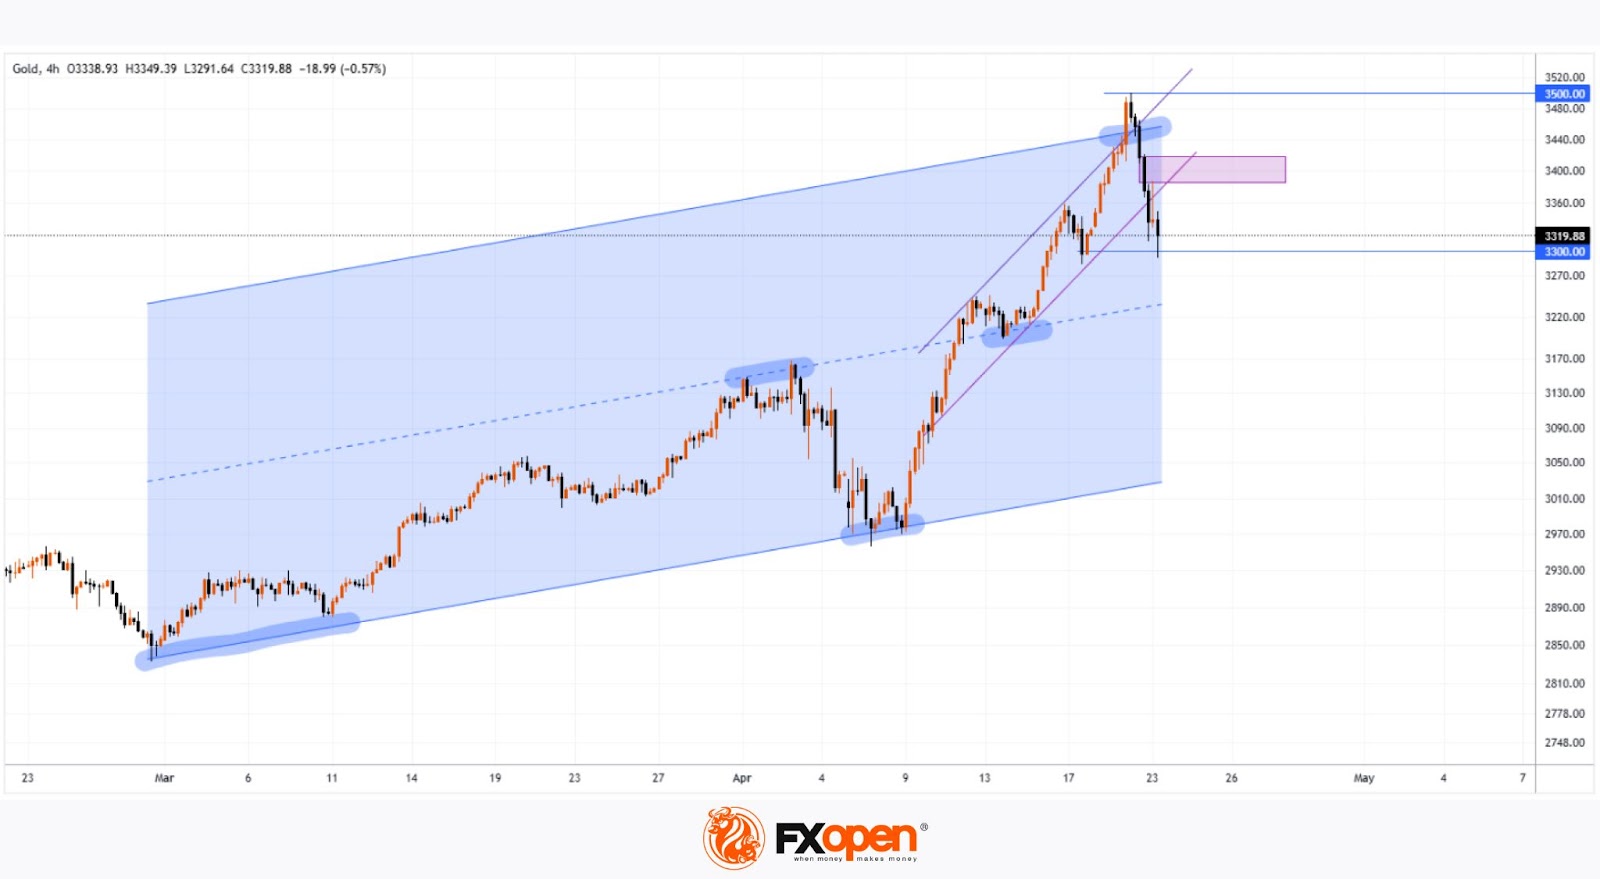
Gold price fluctuations have formed an upward channel (highlighted in blue), with key reversal points marked for constructing the channel. From this perspective, one interpretation is that the upper boundary marked a price area where gold was extremely overbought. Now, the imbalance in market sentiment may be driving the price back towards the median, where supply and demand tend to stabilise.
And although the $3,300 level is currently acting as support, the XAU/USD chart reveals several signs suggesting that bears are taking control:
- The price has dropped by approximately $200 in less than two days;
- A bearish Fair Value Gap has formed during the decline (highlighted by a rectangle) – a pattern typically interpreted as sellers outweighing buyers;
- The steep purple ascending channel has been broken.
It can be assumed that even if the fundamental backdrop offers reasons for a short-term price recovery, this may prove to be only a temporary bounce following a sharp shift in sentiment towards bearishness at the start of the current week.
Start trading commodity CFDs with tight spreads. Open your trading account now or learn more about trading commodity CFDs with FXOpen.
This article represents the opinion of the Companies operating under the FXOpen brand only. It is not to be construed as an offer, solicitation, or recommendation with respect to products and services provided by the Companies operating under the FXOpen brand, nor is it to be considered financial advice.
Bitcoin (BTCUSD) Elliott Wave : Bullish Sequences Calling the Rally
Hello fellow traders. In this technical article, we are going to present Elliott Wave charts of Bitcoin BTCUSD . The crypto is showing impulsive bullish sequences in the cycle from the 74436 low calling for further strength. In the following sections, we will delve into the specifics of the Elliott Wave pattern.
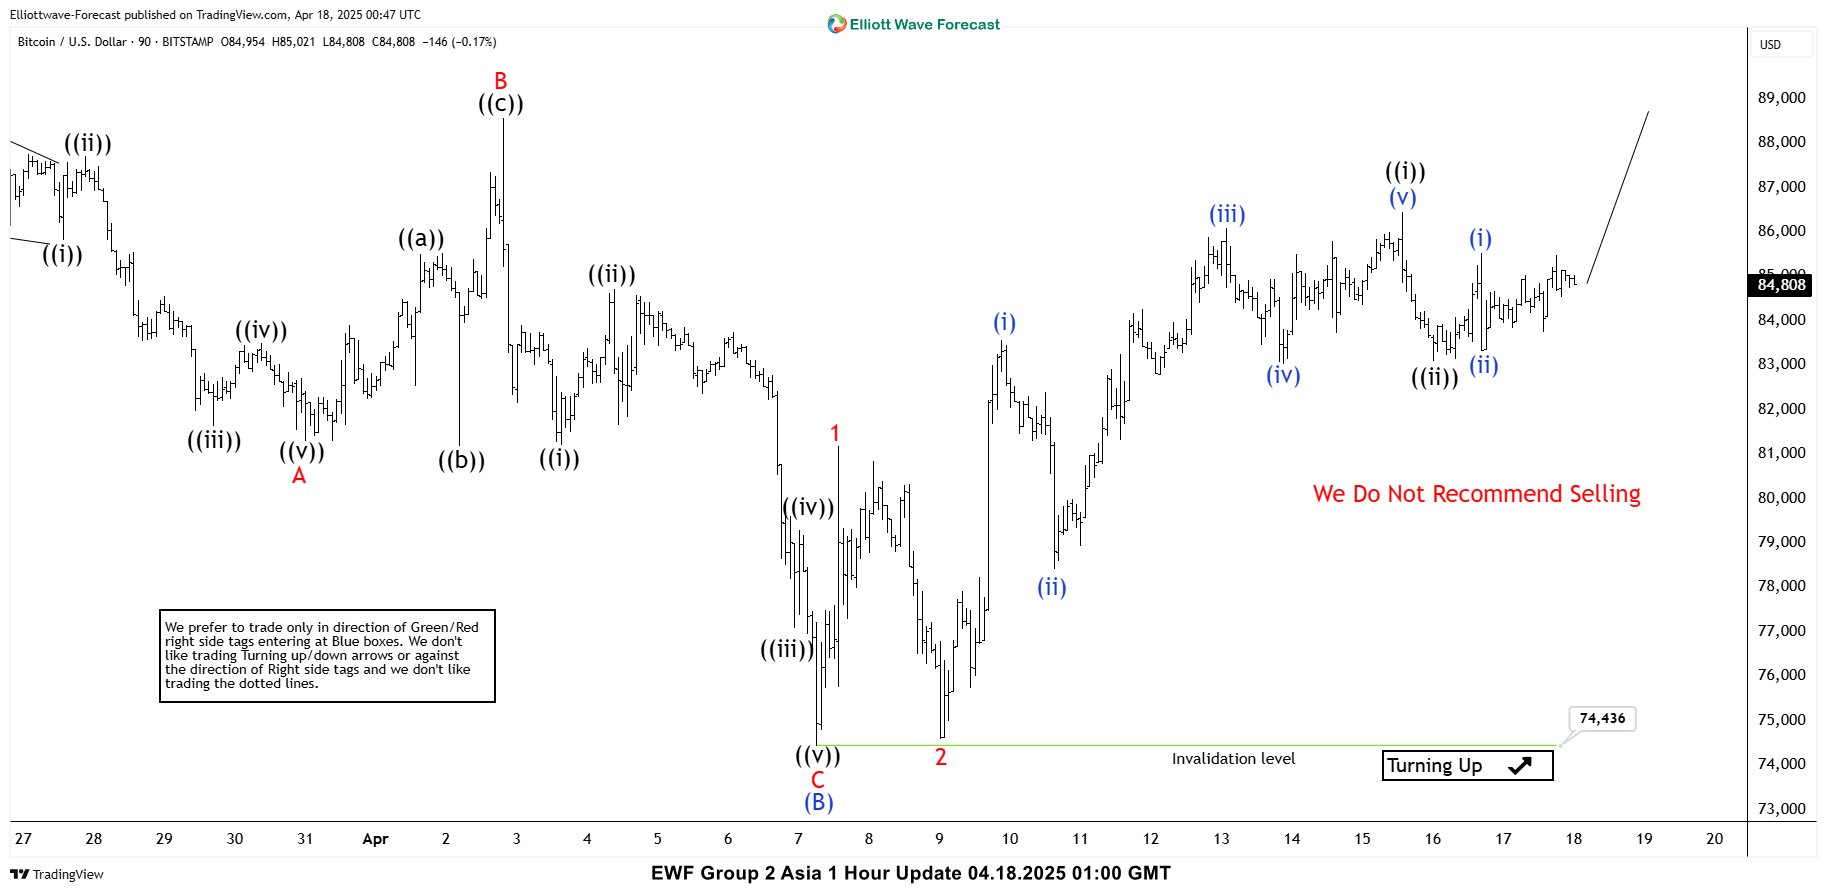
BTCUSD Elliott Wave 1 Hour Chart 04.18.2025
The current analysis suggests that BTCUSD is trading within the cycle from the 74436 low. Intraday pull back ((ii)) black is counted completed at the 83035 low. While above that level we expect further strength in the ctypto.
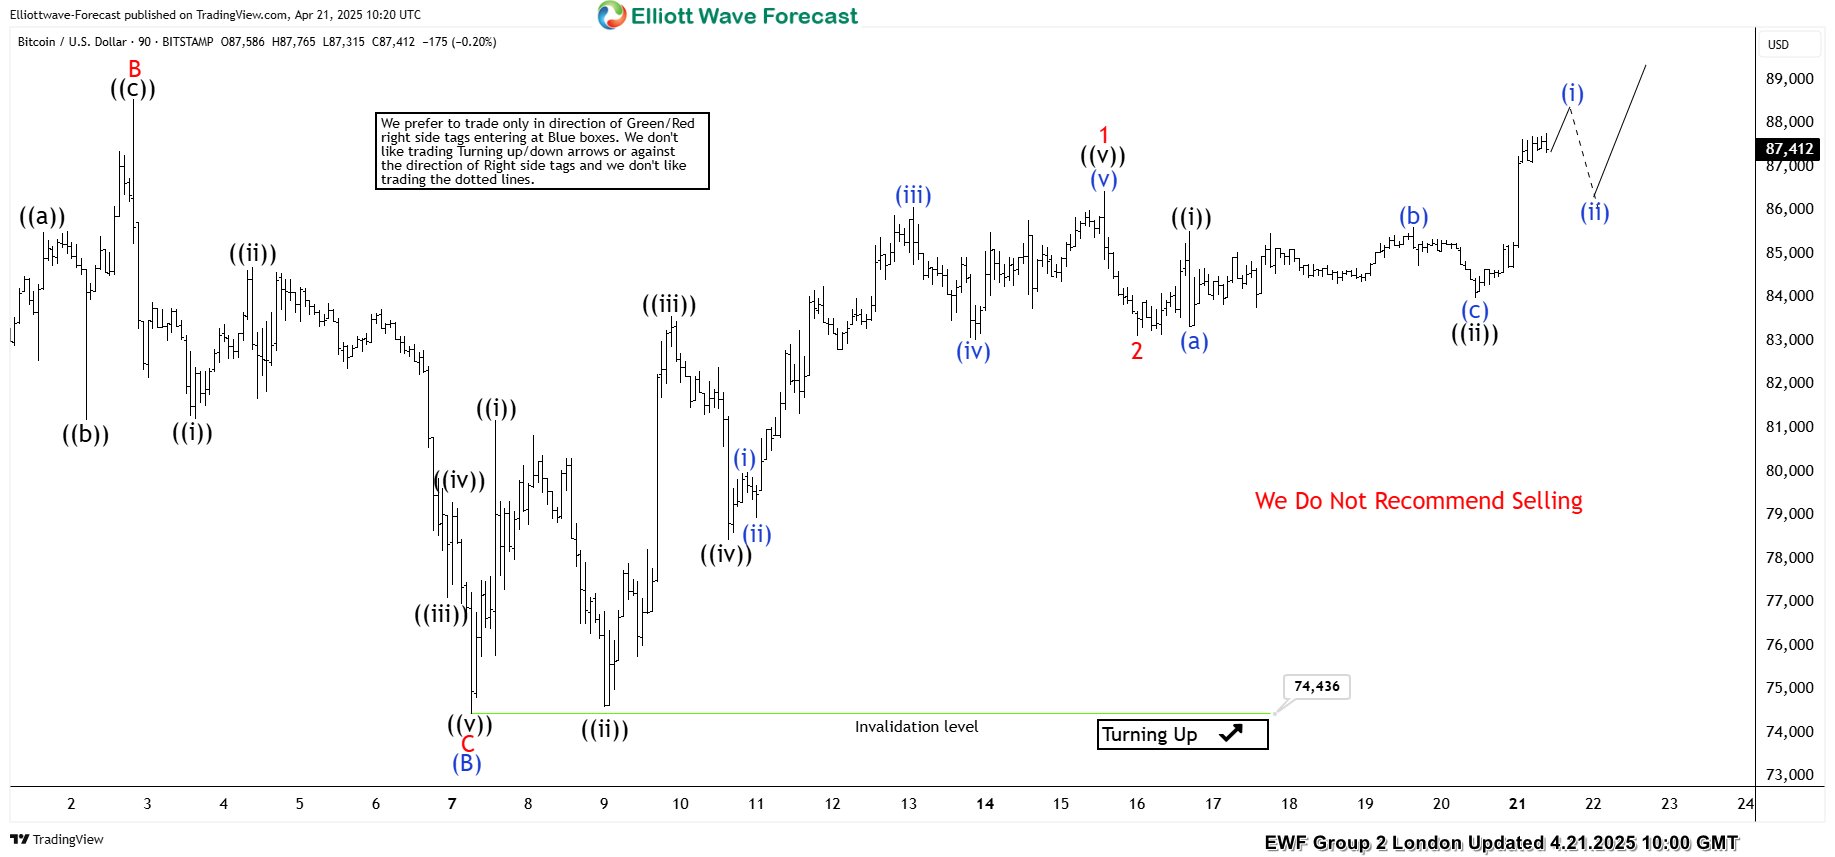
BTCUSD Elliott Wave 1 Hour Chart 04.21.2025
The crypto held above the 74436 low and continued to rally, as expected. The price made break above previous peak and now showing higher high bullish sequences in the cycle from the 74436 , calling for more upside in upcoming days. We do not recommend selling the crypto at this time and favor the long side, targeting 94532-97273 area next.
Euro Under Pressure as Services PMIs Slip
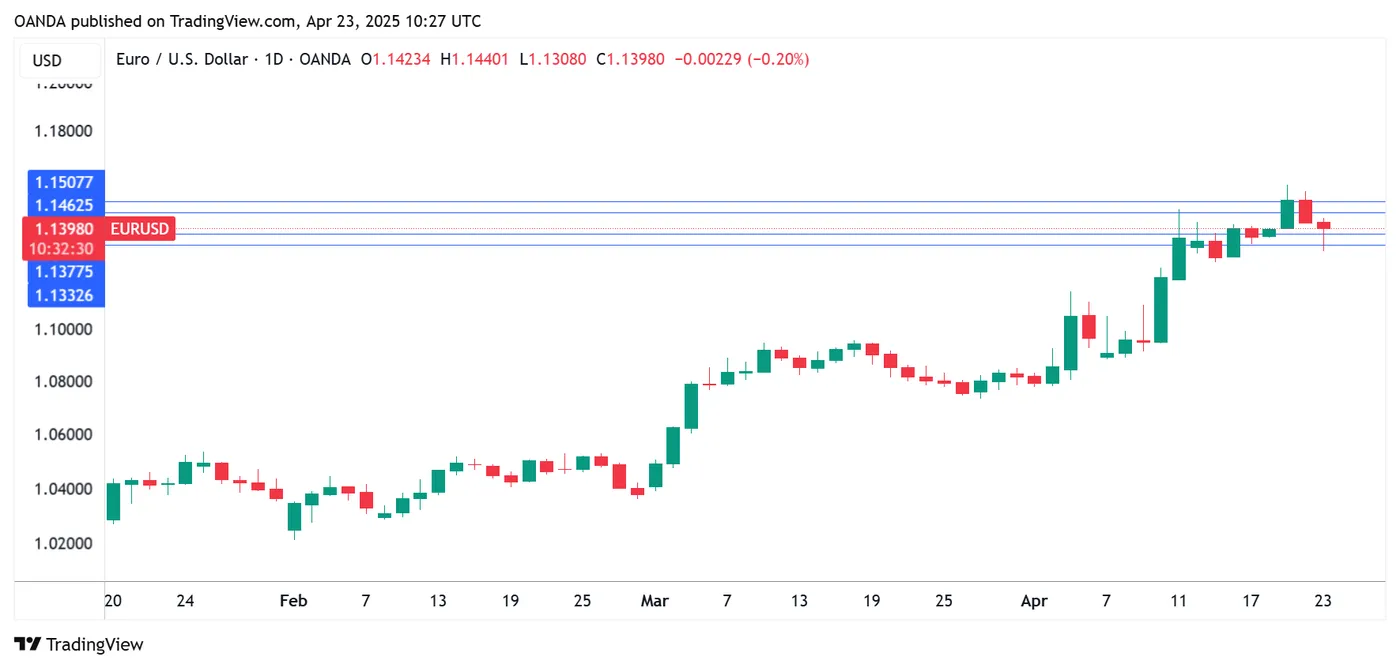
The euro fell close to 1% on Wednesday but has recovered. In the European session, EUR/USD is trading at 1.1430, down 0.09% on the day.
Euro, German PMIs contract in April
Euro and German Services PMIs disappointed in April, as they were lower than expected and fell into contraction territory. This marked the first decline in business activity in Germany and the eurozone since November 2024.
The Euro Services PMI eased to 48.8, down from 50.9 in March and shy of the market estimate of 50.2. Business confidence was sharply lower. Germany's Services PMI fell from 51.0 to 49.7, below the market estimate of 50.5. Concerns about tariffs and uncertainty over economic conditions resulted in a decrease in new orders and weaker business sentiment.
The manufacturing sector remained in contraction. Eurozone Manufacturing PMI rose to 48.7 from 48.6, above the market estimate of 47.5. The German Manufacturing PMI eased to 48.0, down from 48.3 in March but above the market estimate of 47.6.
The weak PMI numbers point to weakness in the German and eurozone economies due to the escalation in trade tensions. The ECB has lowered interest rates seven times in the current easing cycle, and the current key rate is down to 2.25%, its lowest since Dec. 2022. The markets are looking at up to three more rate cuts this year from the ECB. The central bank wants to support the fragile recovery by continuing to trim rates but must keep an eye on the upside risk to inflation due to the tariffs.
It is a light data calendar in the US this week, and the first key events of the week, Services and Manufacturing PMIs, will be released later today. The markets are braced for a weak showing - services is expected to ease from 54.4 to 52.8 and manufacturing to 49.4 from 50.2.
EUR/USD Technical
- EUR/USD tested support at 1.1377 and 1.1332 earlier
- There is resistance at 1.1462 and 1.1507
UK PMI composite plunges to 48.2, recession fears, pressures BoE to cut rates
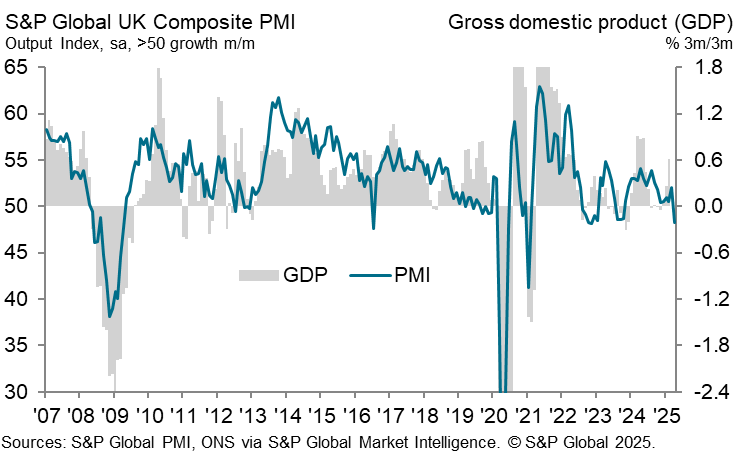
The UK private sector contracted sharply in April, with the flash PMI Composite falling from 51.5 to 48.2, the lowest reading in 29 months. PMI Manufacturing dropped from 45.3 to 44.0, a 20-month low. PMI Services slipped from 52.5 to 48.9, the weakest in 27 months.
According to S&P Global’s Chris Williamson, the downturn marks the steepest fall in output in nearly two and a half years, with data now pointing to a potential quarterly GDP decline of -0.3%.
Also, business sentiment has sunk to its lowest level since late 2021, and even beneath the post-Brexit vote lows. The slump in exports, tied to weak global demand and escalating trade tensions, is adding to domestic burdens. Rising staffing costs—partly due to changes in National Insurance and minimum wage rules—have further squeezed margins.
The sharp contraction and collapsing sentiment pose "red flags" for policymakers and could tip BoE toward cutting rates at its upcoming May meeting.
Gold Takes a Breather After Another Milestone
- Gold pulls back after sharp rally to all-time high.
- Bearish candlestick pattern emerges; overbought signals confirmed.
- Sellers eye a close below 3,290 to target lower levels.
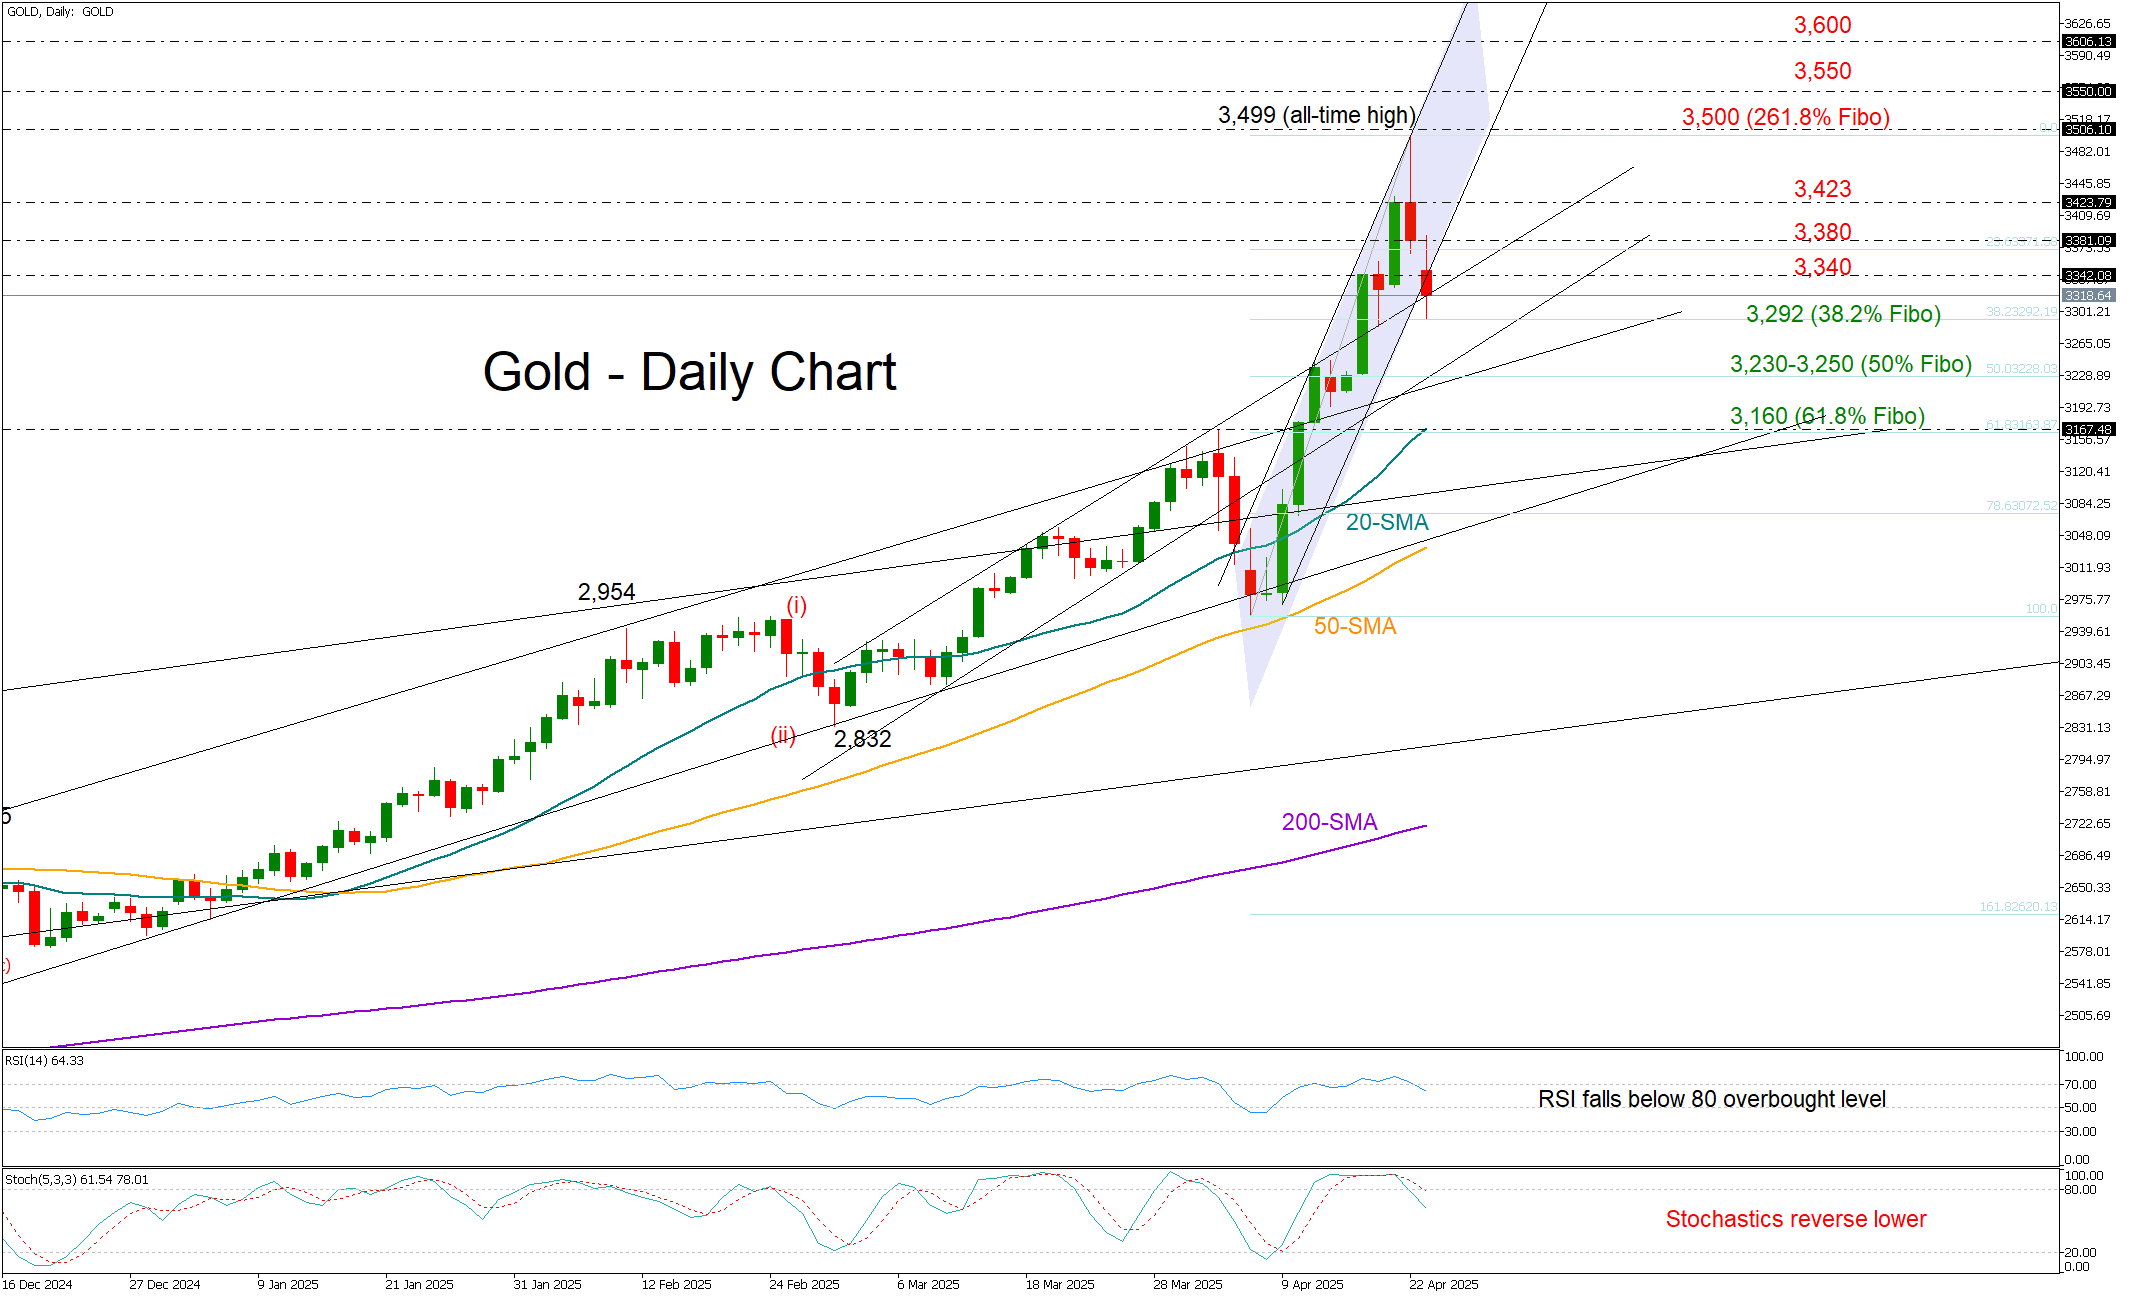
Gold opened Wednesday’s session with a downside gap, extending its retreat from the record high of 3,499.
The formation of a bearish shooting star on the weekly chart increases the probability of a downside reversal. This view is reinforced by overbought signals coming from both the RSI and the stochastic oscillator on the daily timeframe.
However, a confirmation of the bearish bias would likely come with a drop below the 3,340 support area, and more importantly, a break beneath the 38.2% Fibonacci retracement level of the recent rally at 3,292 – a level that provided a footing under the price earlier today. If the bears take control below this zone, the next key support could come around the trendline area of 3,230-3,250, where the 50% Fibonacci mark resides. Further weakness could potentially lead the price toward the 61.8% Fibonacci mark at 3,160 and the 20-day simple moving average (SMA). A drop below that could expose the price to the 3,100 region.
On the flip side, if the precious metal pivots above 3,340, it may initially retest resistance around the 3,380 zone ahead of the 3,423 barrier. A sustained break above the 3,500 psychological level could reignite bullish momentum, setting the stage for a rally toward 3,550 and potentially 3,600. A continuation higher may even put the 3,800 region in focus.
All in all, gold’s recent pullback could extend in the short term, but sellers may wait for a decisive break below 3,292 before stepping in more aggressively.
President Trump, Bessent Temper Rhetoric Which Fuels Optimism, Risk Assets Rise
Stock prices rose, and the dollar gained slightly as the Trump administration eased tensions that had recently unsettled financial markets.
President Trump's comments last night boosted sentiment and once again proved that his outbursts should at times be taken with a pinch of salt. Any concerns about Federal Reserve independence appear to have been put to bed as President Trump confirmed he has no plans to remove Fed Chair Jerome Powell but that he would prefer a rate cut sooner rather than later.
Signs of progress in some trade talks also helped improve market sentiment with Trump and Treasury Secretary Scott Bessent saying that a standoff with China will ease. \there were also reports of positive developments in trade talks with Japan and India which further aided market optimism.
The above has seen risk assets wipe out early week gains with Gold trading lower than its weekly open, down around $3300/oz handle.
US index futures rose, wiping out Monday's losses and also gapping up overnight. A continuation of the improved risk appetite we are seeing could lead to further gains ahead in today's session.
The improved sentiment has also led to European stock indices recovering with the DAX finally breaking above key areas of resistance and eyeing further gains at the start of the European session.
SAP shares surged 9.3% after the German company exceeded analysts' expectations for first-quarter adjusted operating profit. The European technology sector rose 3.3%, making it the best-performing industry group.
The dollar gained over 1% against the yen, hitting 143.21 early on but later settled at 141.85. It also rose 0.4% against the Swiss franc to 0.8222, after climbing more than 1% earlier. Meanwhile, the euro dropped 0.2% to $1.1393, and the British pound fell 0.15% to $1.3313.
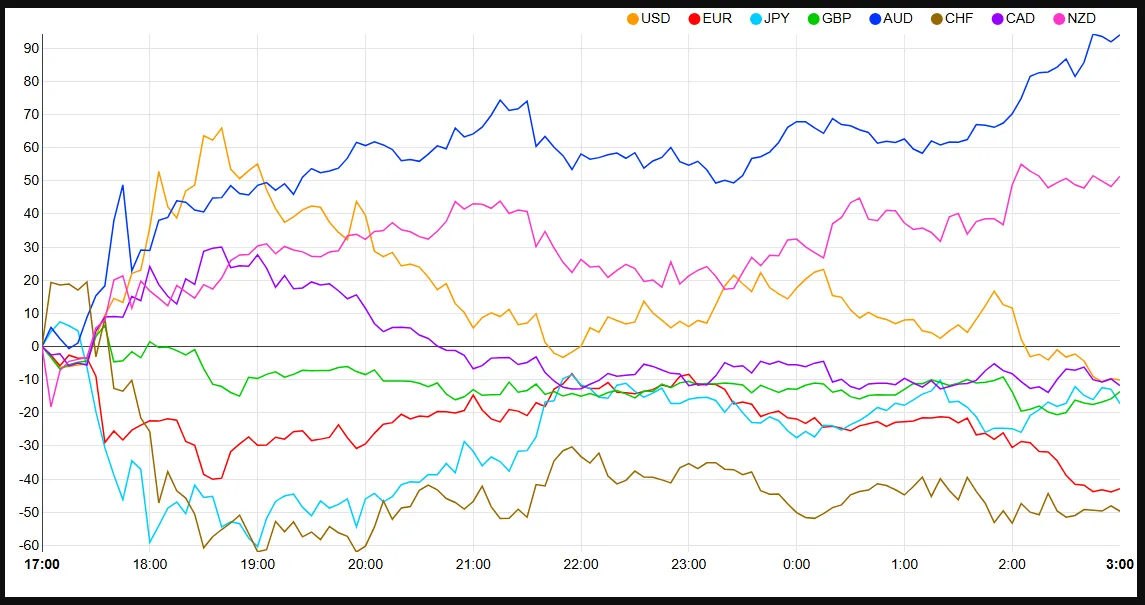
Currency Strength Chart, Strongest - Weakest: AUD, NZD, USD, CAD, GBP, JPY, EUR, CHF
Source: FinancialJuice
Economic data releases
From a data standpoint, it’s a packed session for Europe as key economic reports from the Eurozone and the UK are set to be released. Significant deviations from expectations could trigger notable market volatility.
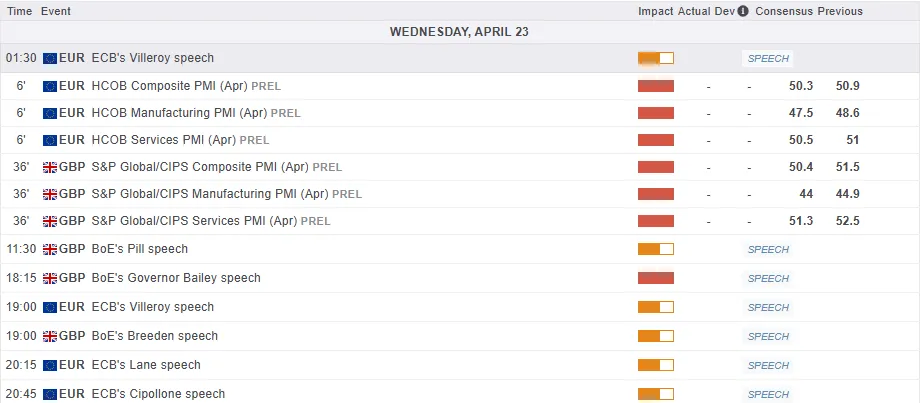
For all market-moving economic releases and events, see the MarketPulse Economic Calendar. (click to enlarge)
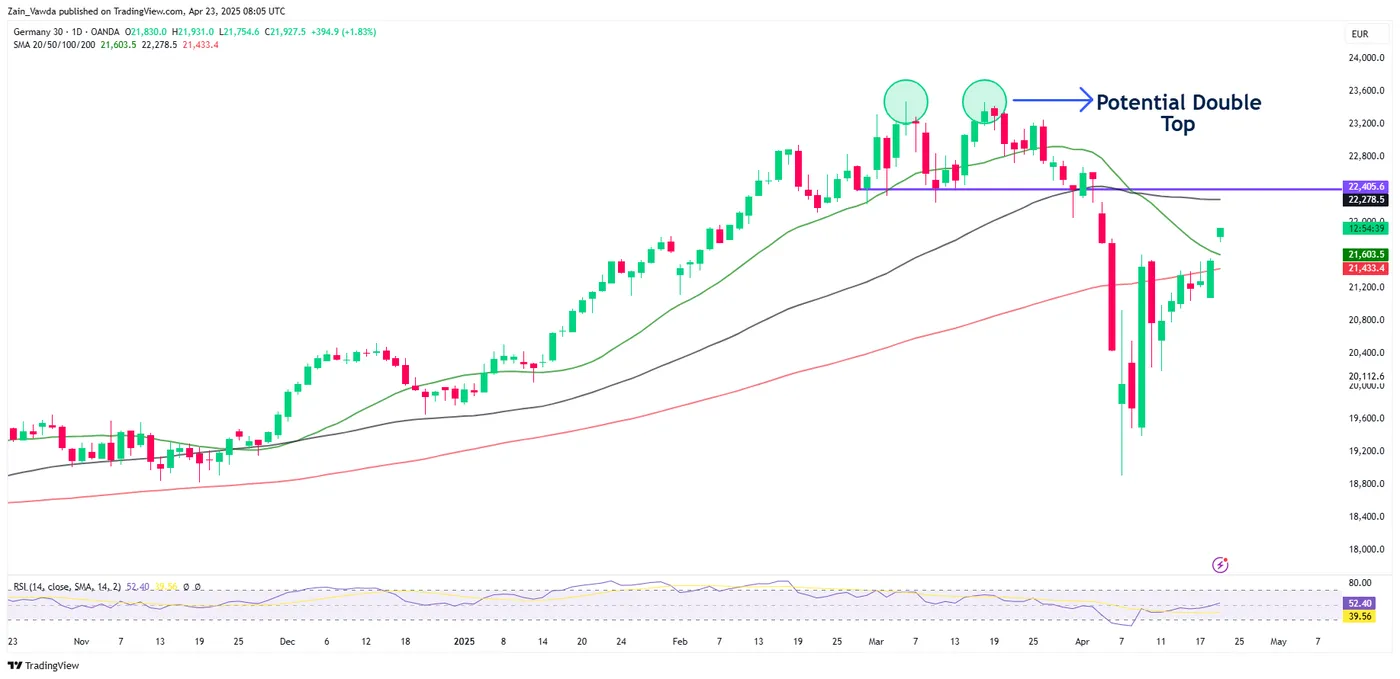
Chart of the day - DAX
From a technical standpoint, the DAX has broken above a key resistance level thanks to the improved risk sentiment in play.
The index now trades above the 20 and 100-day MAs with the potential death cross now looking unlikely if the bullish momentum persists.
The DAX is now eyeing resistance at a key level around 22405 with the the 200-day MA resting just below at 22278 and could prove a stubborn hurdle.
If the index is able to maintain the bullish momentum and break above the 22405 handle then focus shifts to 22800 and 23200 as key areas of resistance.
Any move lower now, and support rests at 21602, 21433 before the 20800 and 20400 handles come into focus.
DAX Chart, April 23, 2025
Source: TradingView.com (click to enlarge)
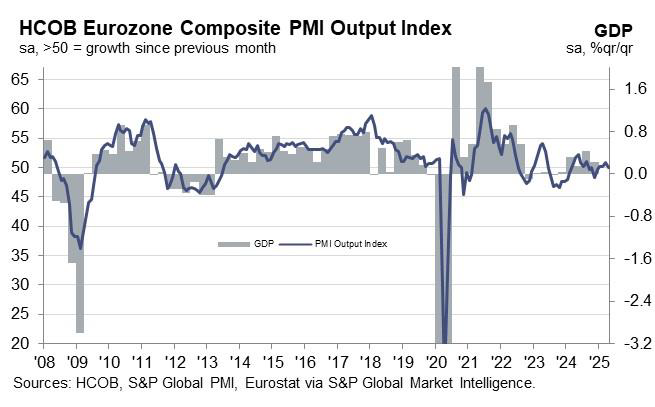
Eurozone PMI Composite slips to 50.1, services contract but manufacturing unfazed by tariffs
Eurozone economy showed signs of stagnation in April as its Composite PMI slipped to 50.1, down from 50.9 in March—a four-month low. The decline was driven primarily by a downturn in the services sector, which contracted for the first time in five months, with the PMI falling from 51.0 to 49.7. In contrast, manufacturing showed unexpected resilience, with PMI ticking up slightly from 48.6 to 48.7, reaching a 27-month high.
Cyrus de la Rubia, Chief Economist at Hamburg Commercial Bank, noted that manufacturers appear "not too fazed" by the recent imposition of broad US tariffs, including 10% general duties and 25% on autos.
He pointed to falling energy prices, driven in part by US recession fears, and planned increases in defence spending as factors supporting the manufacturing sector. However, the decline in services activity has dragged down overall output, pushing the Eurozone economy into what de la Rubia called "stagnation territory."
ECB may find some comfort in the latest inflation signals. While input costs in services remained elevated, the pace of selling price increases eased. In the goods sector, input prices fell, breaking a four-month trend of rising costs, while output prices saw only a modest rise.
At the country level, both Germany and France mirrored the regional trend, with manufacturing output gaining but services activity declining.
Pound Hits Fresh High Against US Dollar Before Correcting: What’s Driving GBP/USD?
GBP/USD reached a seven-month peak at 1.3423 — its highest level since 26 September 2024 — before entering a corrective phase.
Key Drivers Behind GBP/USD Movements
Market concerns over US President Donald Trump’s criticism of Federal Reserve Chair Jerome Powell have eased. Trump has since clarified that Powell will not be dismissed, though he expressed frustration over the Fed’s reluctance to cut interest rates sooner.
The US Dollar’s rebound against the Pound followed the release of UK inflation data and a slightly weaker outlook for the labour market. Although the figures were published last week, the market has only now fully digested their implications.
In March, the UK Consumer Price Index (CPI) slowed to a three-month low. Meanwhile, the employment sector appears vulnerable ahead of another planned rise in employer taxes, due by the end of April.
Current market expectations suggest the Bank of England (BoE) will cut interest rates by 25 basis points (bps) in May, with an additional 85 bps of easing anticipated by year-end.
While US tariff policies are unlikely to directly impact UK inflation, their broader effect may contribute to lower rather than higher price pressures.
Technical Analysis: GBP/USD
H4 Chart Overview
- The pair formed a consolidation range near 1.3066 before breaking upwards in a wave structure towards 1.3420.
- A corrective pullback to 1.3200 is now underway.
- The next phase may see a resumption of upward momentum towards 1.3310, potentially establishing a new consolidation range around this level.
- The MACD indicator supports this outlook, with its signal line exiting the histogram area and pointing sharply downward, suggesting near-term bearish momentum.

H1 Chart Overview
- GBP/USD broke below 1.3310, hitting a local downside target at 1.3233.
- Today, the pair retested 1.3310 from below, and further downside movement towards 1.3200 is now in focus.
- The Stochastic oscillator aligns with this view, as its signal line remains below 80 and is trending downward towards 20, indicating weakening bullish momentum.

Conclusion
The GBP/USD rally has paused as traders assess mixed UK economic data and shifting Fed policy expectations. While near-term corrections are likely, the broader trend could see renewed upside if key support levels hold. Technical indicators suggest further consolidation before the next decisive move.