
Sample Category Title
GBP/JPY Daily Outlook
Daily Pivots: (S1) 188.83; (P) 189.57; (R1) 190.86; More...
Intraday bias in GBP/JPY remains neutral for the moment. On the upside, firm break of 190.06 resistance will extend the rebound from 184.35 to 195.95. Nevertheless, on the downside, break of 184.35 will target 180.00 low instead.
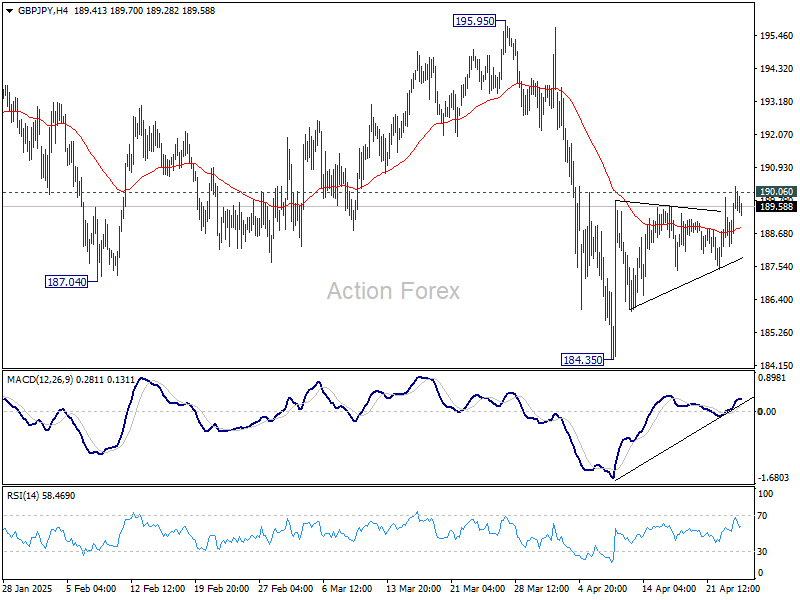
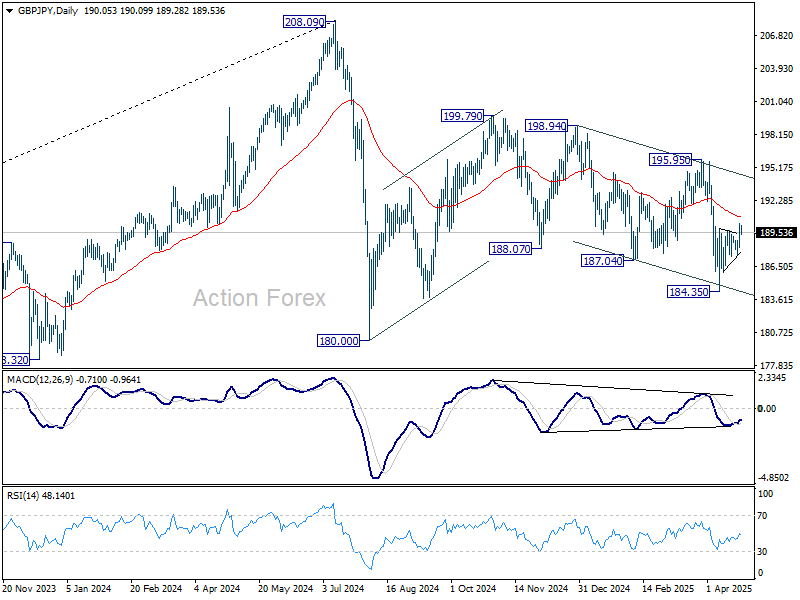
In the bigger picture, price actions from 208.09 are seen as a correction to rally from 123.94 (2020 low). Strong support should be seen from 38.2% retracement of 123.94 to 208.09 at 175.94 to contain downside. However, sustained break of 175.94 will bring deeper fall even still as a correction.
Elliott Wave: Copper (HG) Impulsive Rally Signals More Upside
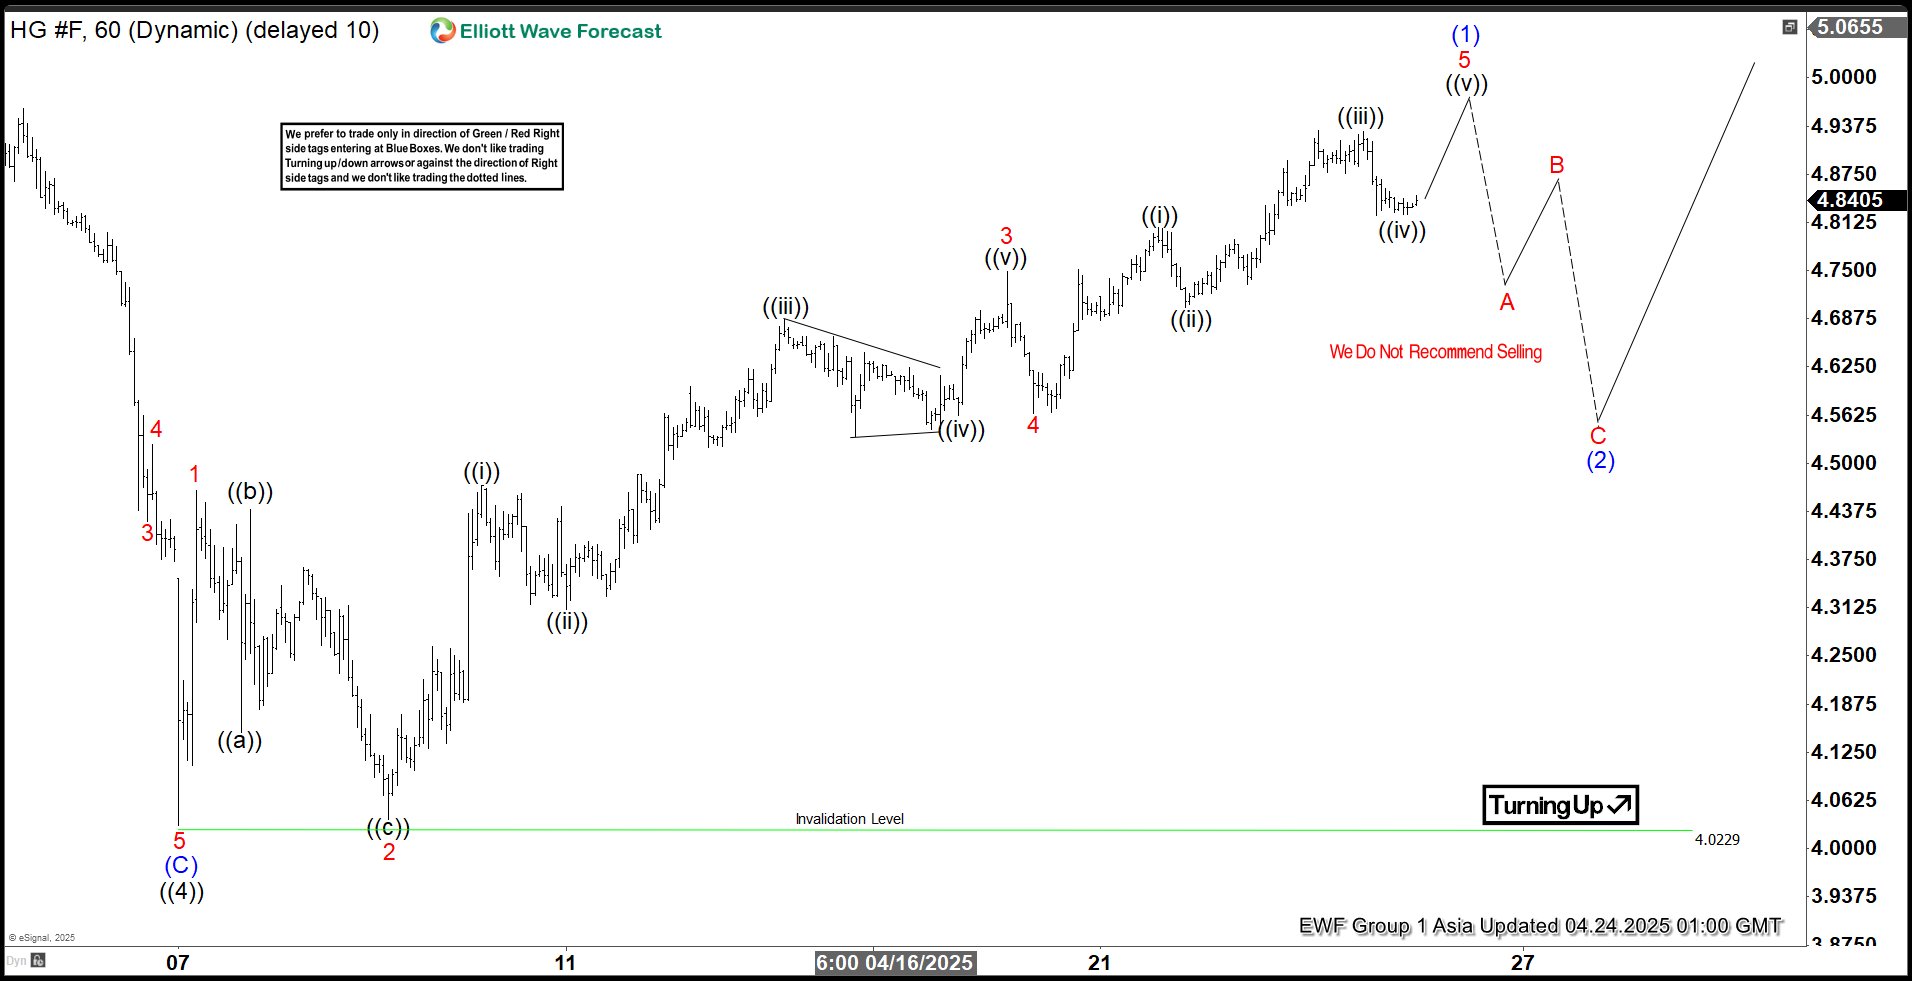
Copper ($HG) has been displaying a strong bullish trend, with the rally from the July 11, 2022 low unfolding in a Elliott Wave diagonal. This rally is structured as a 5-swing pattern, which is characteristic of a motive wave. This suggests that the broader trend favors further upside. As of the latest price action, the metal has completed a significant corrective phase and is now positioned for additional gains.
The recent pullback to the 4.03 low on April 7, 2025, marked the completion of wave ((4)). It is a corrective wave within the larger 5-wave diagonal structure. Following this low, copper has turned higher, initiating wave ((5)). This wave ((5)) is the final leg of the motive sequence. Within wave ((5)), the short-term rally from the wave ((4)) low at 4.03 appears to be unfolding in an impulsive manner, indicating strong upward momentum. Wave 1 ended at 4.465 and pullback in wave 2 ended at 4.038. The metal then rallied higher in wave 3 towards 4.748 and wave 4 dips ended at 4.564.
Expect cycle from April 7, 2025 low to end soon with wave 5 of (1) and the metal to see a 3 waves pullback. However, as long as pullbacks remain above the 4.03 low, copper is expected to see more upside. The Elliott Wave framework continues to support a bullish bias for $HG in the near term.
Copper (HG) 60 Minute Elliott Wave Chart
HG Video
https://www.youtube.com/watch?v=VsJk9RbxrS0
Trump Era Swings Become Standard Procedure
Markets
In the ‘Trump’ era glass-half-empty back to glass-half-full swings have become standard procedure and the trick was again at work yesterday. After indications that he was considering options to dismiss the Fed chair earlier this week, US president Trump moved to a more conciliatory tone vis-à-vis the Fed and its Chair. At the same time, comments from president Trump and press reports (including from the WSJ) suggested that some mitigation in the tariff war with China might be in the cards as well. Some see it as a kind of (at least short-term) Trump put as market turmoil is at risk of spiraling into outright chaos. Equity markets rebounded sharply in Europe and at the US open. Even so, those markets soon realized that any comment remains conditional only up to the next phase in the US administration’s communication. This ‘feeling’ only was reinforced by comments from Treasury secretary Bessent that the US didn’t intend to reduce tariffs on China unilaterally. In the end, US equities still closed with decent gains (S&P 500 + 1.67%, Nasdaq 2.50%) but well off the intraday highs. The US curve flattened with the 2-y adding 5.2 bps while the 30-y declined 5.5 bps. In the current environment, this move can be considered as an easing of the pressures that were building earlier this week. The closely watched 5-y US action was OK. Similar story for the dollar. DXY rebounded to close near 99.85, to be compared with a correction low just below 98 on Monday. Still, this doesn’t improve the overall picture on the US currency in any profound way. EUR/USD also corrected further to close at 1.1315. This euro ‘decline’ occurred even as the European/German yield curve bear flattened with German yields rising between 8.5 bps (2-y) and 5.2 bps (30-y). The move in the first place also should be considered as a risk-on correction. At the same time, EMU April PMI’s saw some fall-out from the global uncertainty (composite PMI 50.1 from 50.9), but the damage could even been bigger, with especially manufacturing showing some (unexpected?) resilience. ECB comments from Lagarde and Villeroy indicated some potential deflationary effects for the EU economy from the current trade uncertainty. Even so, the PMI’s suggest no need for the ECB rush into stimulative territory given current context of elevated uncertainty.
Asian equity markets this morning show no clear directional trend as yesterday’s WS optimism is petering out. Later today, the eco calendar contains German IFO business confidence, US durable goods orders and jobless claims and a $44 bln US 7-y Note auction. Recently, eco data most often only had limited impact on trading and often told more about market positioning rather than on the underlying eco narrative. The pressure on LT US Treasuries eased for now, but the 4.20%/4.25% area for 10-y looks like strong ‘support’. In EUR/USD 1.1264/1.1144 are the first references that needs to be cleared to call of the EUR/USD ascent. We’re not that far yet.
News & Views
The European Automobile Manufacturers’ Association (ACEA) showed new EU car registrations declining slightly in March (-0.2% Y/Y) with Q1 2025 registrations being 1.9% lower compared to Q1 2024 in the particularly challenging and unpredictable global (trade) context for auto makers. Hybrid electric vehicles are the most popular in EU, capturing 35.5% market share in Q1 (from 28.9% in Q1 2024). Battery EV’s grab a 15.2% market share in the Jan-March period, up from 12% last year, but still way below where they were expected to be. Three of the four largest markets in the EU, accounted for 63% of all battery-electric car registrations, recorded robust gains: Germany (+38.9%; 17% market share Q1 2025), Belgium (+29.9%; 33.4% market share), and the Netherlands (+7.9%; 35.3% market share). This contrasted with France, which saw a decline of 6.6% (18.2% market share). Petrol cars (28.7% from 35.9%) are the second largest category of new registrations, but the combined share of petrol and diesel cars fell to 38.3% from 48.3% over the same period last year.
The Financial Times reports that US President Trump is planning to spare carmakers from some of his most onerous tariffs, in another trade war climbdown following intense lobbying by industry executives over recent weeks. It would be a destacking of duties, exempting car parts from tariffs on imports from China related to fentanyl chemical exports as well as from those on steel and aluminum. They are already shielded from reciprocal tariffs while imports for cars from Mexico and Canada already have better terms if they comply with the USMCA trade treaty (only tariffs on non-US content). The 25% tariff imposed on all imports of foreign-made cars would stay in play as well as the separate 25% on parts which is due to take effect from May 3.
EUR/USD Daily Outlook
Daily Pivots: (S1) 1.1269; (P) 1.1354; (R1) 1.1401; More...
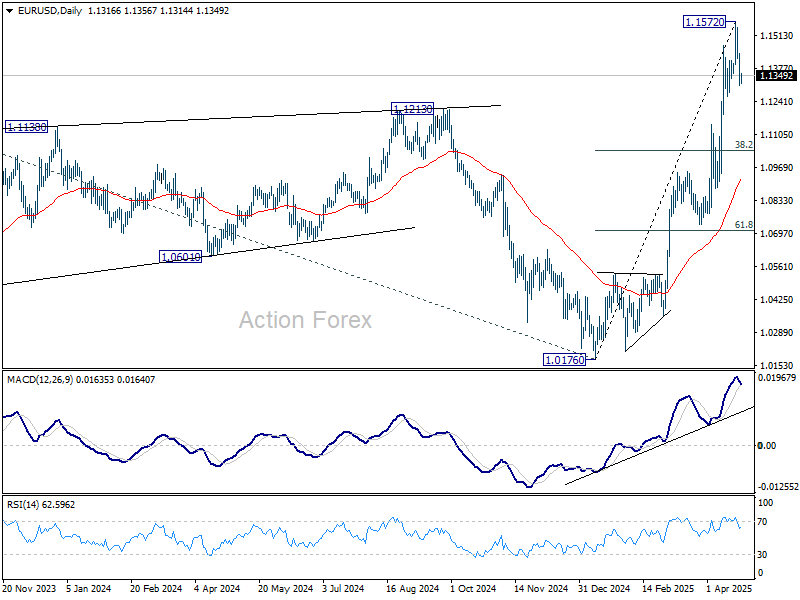
Intraday bias in EUR/USD remains mildly on the downside for the moment. Pull back from 1.1572 short term topping could extend lower. But downside should be contained by 38.2% retracement of 1.0176 to 1.1572 at 1.1039. On the upside, break of 1.1572 will resume larger up trend.
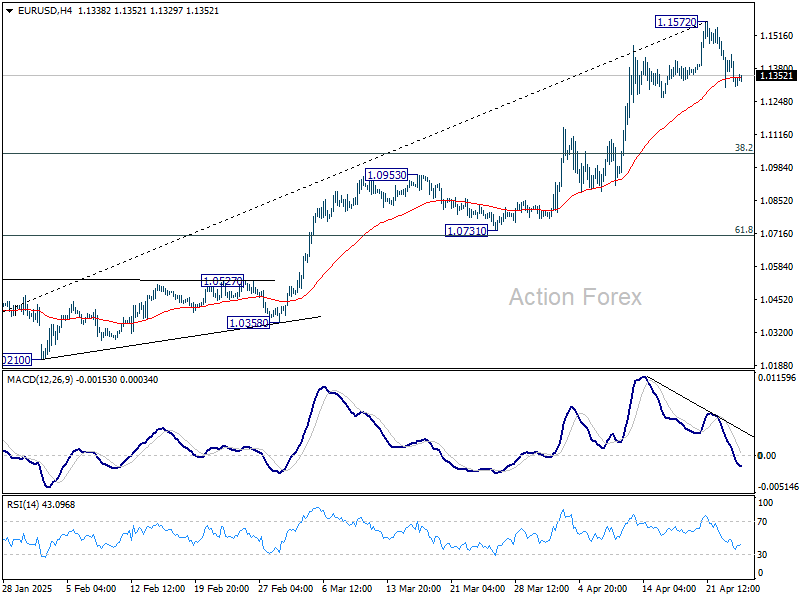
In the bigger picture, rise from 0.9534 long term bottom could be correcting the multi-decade downtrend or the start of a long term up trend. In either case, further rise should be seen to 100% projection of 0.9534 to 1.1274 from 1.0176 at 1.1916. This will now remain the favored case as long as 55 W EMA (now at 1.0776) holds.
GBP/USD Daily Outlook
Daily Pivots: (S1) 1.3212; (P) 1.3276; (R1) 1.3319; More...
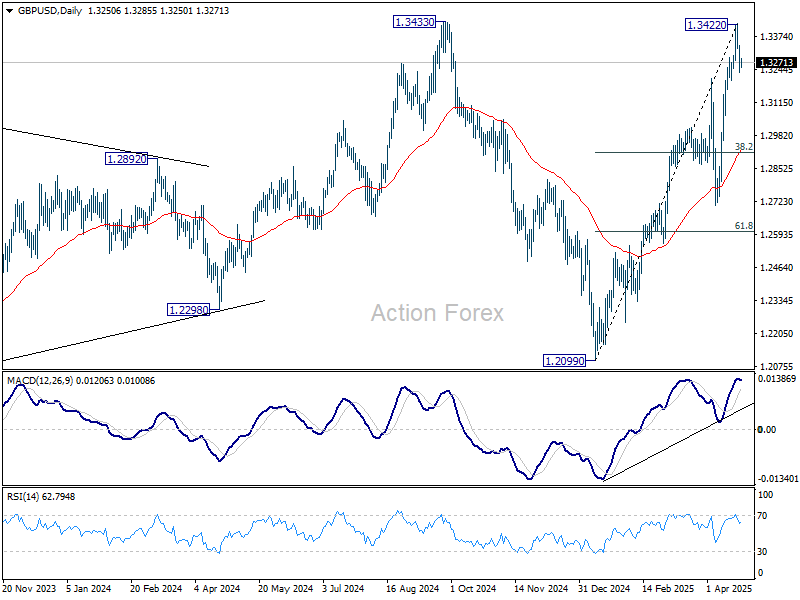
Intraday bias in GBP/USD remains mildly on the downside for the moment. Pullback from 1.3422 short term top would continue lower. But downside should be contained by 38.2% retracement of 1.2099 to 1.3422 at 1.2917. On the upside, firm break of 1.3433 will resume larger up trend.
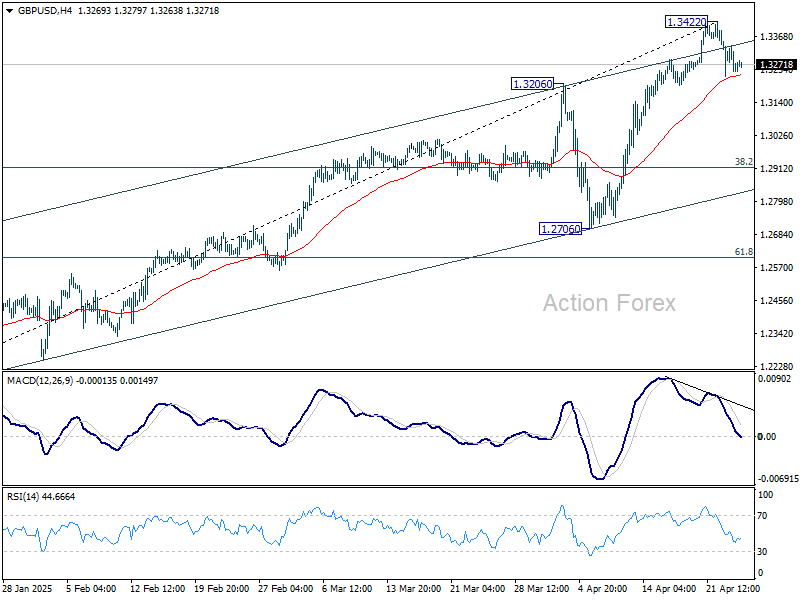
In the bigger picture, price actions from 1.3433 are seen as a corrective pattern to the up trend from 1.3051 (2022 low). Rise from 1.2099 could be the second leg. Overall, GBP/USD should target 1.4248 key resistance (2021 high) on break of 1.3433 at a later stage.
USD/CHF Daily Outlook
Daily Pivots: (S1) 0.8215; (P) 0.8264; (R1) 0.8355; More…
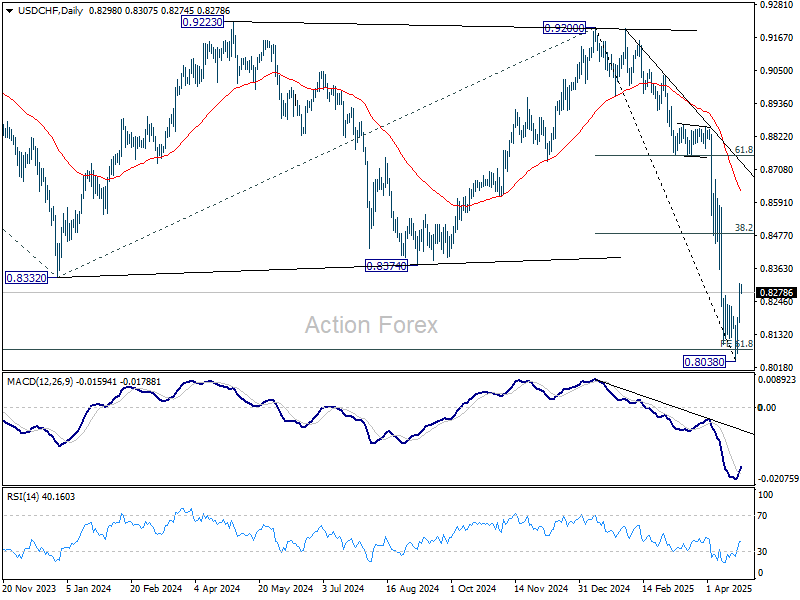
Intraday bias in USD/CHF stays on the upside, as rebound from 0.8038 short term bottom could extend to 38.2% retracement of 0.9200 to 0.8038 at 0.8482. But strong resistance should be seen there to limit upside. On the downside, break of 0.8038 will resume larger down trend.
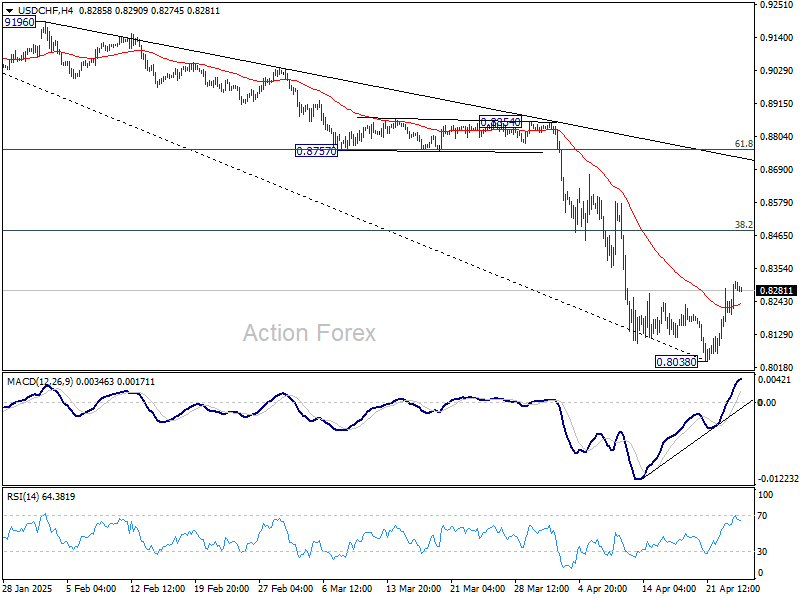
In the bigger picture, long term down trend from 1.0342 (2017 high) is still in progress and met 61.8% projection of 1.0146 (2022 high) to 0.8332 from 0.9200 at 0.8079 already. In any case, outlook will stay bearish as long as 55 W EMA (now at 0.8794) holds. Sustained break of 0.8079 will target 100% projection at 0.7382.
USD/JPY Daily Outlook
Daily Pivots: (S1) 142.07; (P) 142.82; (R1) 144.19; More...
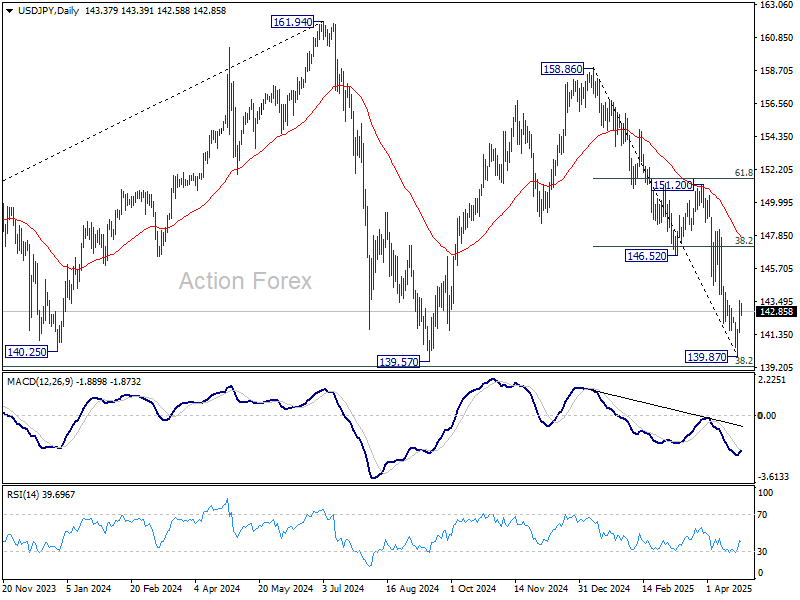
Intraday bias in USD/JPY stays on the upside as rebound from 139.87 short term bottom would extend higher. But overall risk will stay on the downside as long as 38.2% retracement of 158.86 to 139.87 at 147.12 holds. On the downside, decisive break of 139.26 will carry larger bearish implications.
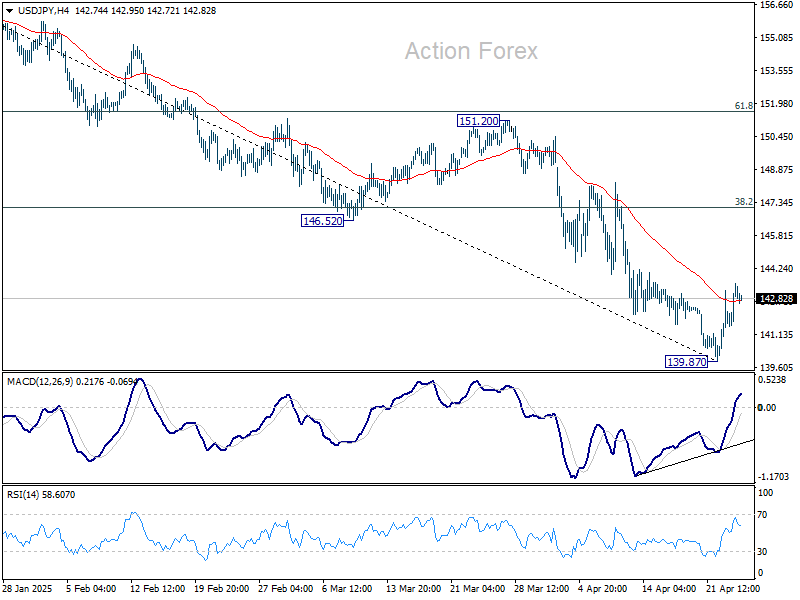
In the bigger picture, price actions from 161.94 are seen as a corrective pattern to rise from 102.58 (2021 low), with fall from 158.86 as the third leg. Strong support should be seen from 38.2% retracement of 102.58 to 161.94 at 139.26 to bring rebound. However, sustained break of 139.26 would open up deeper medium term decline to 61.8% retracement at 125.25.
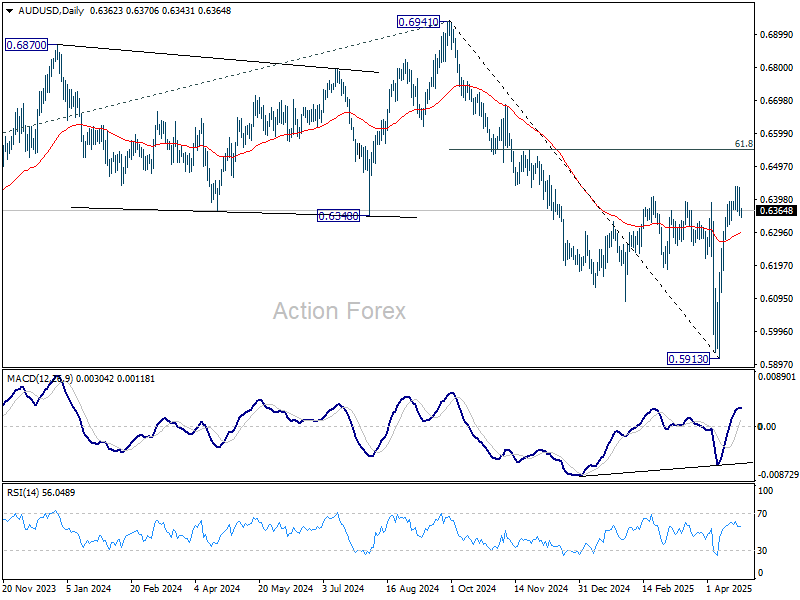
AUD/USD Daily Report
Daily Pivots: (S1) 0.6328; (P) 0.6381; (R1) 0.6414; More...
Intraday bias in AUD/USD remains neutral for consolidations below 0.6438. Further rally is expected as long as 55 D EMA (now at 0.6297) holds. Above 0.6438 temporary top will resume the rebound from 0.5913 to 61.8% retracement of 0.6941 to 0.5913 at 0.6548. However, sustained trading below 55 D EMA will argue that the rebound has completed and turn bias back to the downside.
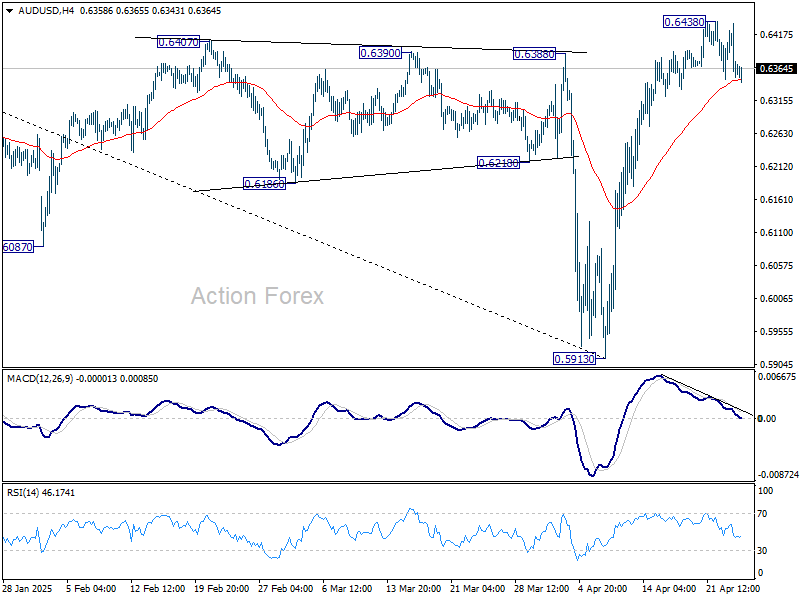
In the bigger picture, fall from 0.6941 (2024 high) is seen as part of the down trend from 0.8006 (2021 high). Next medium term target is 61.8% projection of 0.8006 to 0.6169 from 0.6941 at 0.5806. However, sustained trading above 55 W EMA (now at 0.6443) will argue that a medium term bottom was already formed, and set up further rebound to 0.6941 resistance instead.
Sentiment Remains Fragile on Conflicting Comments
The first half of the week was full of fear and hope. Trump’s frustration with the Federal Reserve (Fed) President Powell and the threat of Powell being removed from his role weighed on sentiment at the start of the week. Meanwhile, the IMF lowered its world growth forecasts sharply pointing at hectic and harmful US trade policy. Equities fell and the US dollar weakened. Gold hit the $3500 mark. Then, mood improved as Trump said he wouldn’t remove Powell from his role and that the triple-digit tariffs on Chinese imports will be pulled ‘substantially’ lower. Equities rallied, the China-sensitive stocks cheered the news more than the others. Apple, for example, jumped nearly 10% from the week low to yesterday’s high point and the dollar index rebounded from the lowest levels in more than three years and the US 10-year yield eased after spiking above the 4.40% mark. Then, Bessent said that there are no plans to lower the Chinese tariffs unilaterally. Concretely, the Trump show continues, optimism is too fragile to call the end of the equity selloff. Futures this morning are pointing at a negative start, the selling pressure is stronger for the US indices than the European peers while the Chinese CSI 300 is flat and the Nikkei is down 1%, testing the 35000 psychological support to the downside as the USJPY trades a touch below 143 after an early attempt to clear the 140 support this week.
Across the pond, the Stoxx 600 remained relatively stable this week compared to the American peers, and the index jumped 1.80% yesterday on potential improvement in trade situation. On the earnings front, the luxury-good makers didn’t have a strong Q1 but SAP, the most valuable European company by market cap, announced a 58% increase to its profit last quarter with a 26% jump to its revenue from cloud products. The share price jumped more than 10% yesterday. Overall, the preference for the European companies continues as the US exceptionalism trade fades. The same is true for the euro. The EURUSD eased this week after trading above the 1.15 level. Yesterday’s softer-than-expected PMI figures certainly weighed on expectations that the massive government spending would boost growth across the euro area, but they also fuelled expectations that the European Central Bank (ECB) will continue to provide support to the underlying economies. Price pullbacks remain interesting opportunities to strengthen long positions in favour of the single currency with the next major target for the bulls standing at the 1.20 mark.
In energy, crude oil’s positive momentum was hit yesterday by the IMF’s sharp downside revisions to global growth forecasts. The outlook remains negative on higher supply and lower demand prospects. Expect solid resistance to the latest rebound approaching the $66.70/67pb range, including the major 38.2% retracement on the first quarter decline and the 50-DMA. Below this price range, crude oil remains in the bearish trend with the possibility of a sustained decline below the $60pb level.
Politics Continue to Push Sentiment
In focus today
Today we receive the German Ifo index, and it will be interesting to see if it shows the same development as the PMIs yesterday. We particularly look out for the Ifo index as it has an expectations component in contrast to the PMI, which should give a better reflection of the trade war impact.
Economic and market news
What happened yesterday
In the US, against all the gloomy signals from the regional Fed indices, the manufacturing index increased to 50.7 (cons: 49.1, prior: 50.2), while the services measure declined to 51.4 (cons: 52.5, prior: 54.4), though it remains in expansionary territory. The composite PMI ticked lower to 51.2 from 53.5 but still signalled growth. Looking into details, export orders indices weakened across both manufacturing and services, while the domestic side appears surprisingly strong. Services new orders weakened slightly to 52.7 from 53.7, whereas manufacturing new orders actually increased to 51.4 from 51.1. All in all, a surprisingly positive PMI report, providing some support to the USD.
Remarks from the Trump administration weighed on markets again yesterday. Reports emerged that Treasury Secretary Bessent and Commerce Secretary Lutnick were the ones who stopped Trump's intentions of firing Powell. Bessent also added colour to the ongoing trade de-escalation talks with China, noting that a full trade deal could take 2-3 years. He stated that a prerequisite for restarting negotiations is lowering tariffs - currently 145% on Chinese goods and 125% on US goods - but emphasized that Trump is unlikely to make that move unilaterally. Rumours also circulated that the White House might consider cutting tariffs on China to as low as 50%, though a White House official dismissed this, clarifying that any tariff announcements would come directly from Trump. Markets turned slightly more optimistic on the back of potential tariff relief, with the probability of a US-China deal before June rising to around 38%, up from 34% prior to the news.
Furthermore, the Financial Times also reported that Trump is considering exempting carmakers from some tariffs following recent lobbying efforts from US auto manufactures.
In the euro area, as expected, the composite PMI ticked lower to 50.1 in April (cons: 50.2, prior: 50.9). Notably, the downtick was surprisingly entirely driven by the services leg, which fell to 49.7 (cons: 50.5, prior: 51.0), whereas the manufacturing counterpart beat expectations, increasing slightly to 48.7 (cons: 47.4, prior: 48.6). With the services sector edging below the 50-threshold, the print supports the narrative of further easing by the ECB as also price pressures were easing in the report. However, looking at details, services employment is still sound at 50.8, indicating that the decline is not as dire as the headline suggests.
Speaking of the ECB, the latest update of their wage tracker continues to signal lower wage growth in 2025, further underscoring the case for additional monetary easing from the ECB. Looking ahead, we continue to expect the ECB to deliver 25bp cuts at the upcoming meetings, bringing the deposit rate to 1.50% by September 2025.
In the UK, April PMIs surprised sharply to the downside across sectors, showing signs of stagflationary tendencies. The composite measure stood at 48.2 (cons: 50.4, prior: 51.5), with services at 48.9 (cons: 51.5, prior: 52.5) and manufacturing at 44.0 (cons: 44.0, prior: 44.9). Price components ticked higher across the board, with both input and output prices increasing at a faster pace in April, while employment indicators moved further into contractionary territory for both services and manufacturing. Hence the more muted growth outlook and higher price components spells trouble for the BoE.
In commodities, oil prices declined by around 2.0% during yesterday's session following news that several OPEC+ members want the cartel to approve another accelerated oil output increase for June - similar in volume to the one agreed for May. Kazakhstan was also out stating that they are not eager to cut output to make up for previous overproduction. Eight OPEC+ countries will convene on 5 May to agree upon the output plan for June. As we expect downward pressure to persist in Q2, we forecast Brent to average USD70/bbl in Q2 and recover to USD85/bbl in Q4.
Equities: Equities rose again yesterday as optimism around US politics gained traction. We saw significant outperformance of cyclical sectors over defensives - across both US and European markets. From a broader perspective, the new market narrative remains intact: a mix of unusual correlations where the long end of the US curve falls, the USD strengthens, and risk assets outperform. The fact that equities rallied sharply on a day when macro data was at best mixed - and arguably disappointing on the services side - underscores the prevailing sentiment. Earnings yesterday came in solid, adding to the positive tone. US equities yesterday Dow +1.1%, S&P 500 +1.7%, Nasdaq +2.5%, Russell 2000 +1.5%. Looking at markets this morning, Asia is trading in the red and futures in both the US and Europe are pointing lower. This seems consistent with the more cautious political signals emerging after the U.S. close yesterday.
FI & FX: Whereas U.S. Treasury Secretary Scott Bessent acknowledged that the current tariff levels of 145% for good from China is not sustainable, he nonetheless held on to the mission of a rebalancing of us economic relationships with other countries. The extremely positive market sentiment lost somewhat of its steam during the speech. The 10y US treasury bond yield rose by 12bp from the lows just ahead of Bessent's comments to a intraday high of 4.39% a couple hours after Bessent left the stage.