Sample Category Title
Eurozone PMI Composite slips to 50.1, services contract but manufacturing unfazed by tariffs
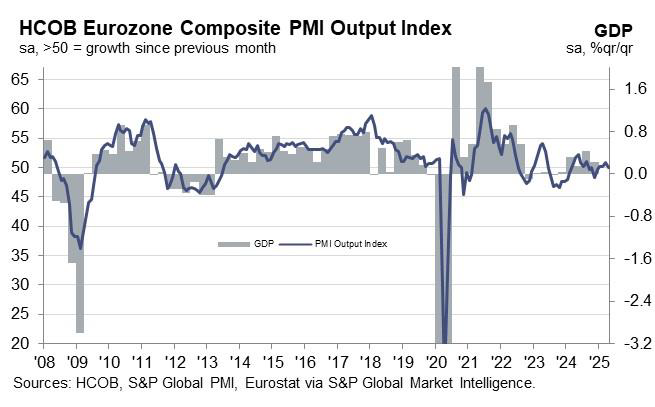
Eurozone economy showed signs of stagnation in April as its Composite PMI slipped to 50.1, down from 50.9 in March—a four-month low. The decline was driven primarily by a downturn in the services sector, which contracted for the first time in five months, with the PMI falling from 51.0 to 49.7. In contrast, manufacturing showed unexpected resilience, with PMI ticking up slightly from 48.6 to 48.7, reaching a 27-month high.
Cyrus de la Rubia, Chief Economist at Hamburg Commercial Bank, noted that manufacturers appear "not too fazed" by the recent imposition of broad US tariffs, including 10% general duties and 25% on autos.
He pointed to falling energy prices, driven in part by US recession fears, and planned increases in defence spending as factors supporting the manufacturing sector. However, the decline in services activity has dragged down overall output, pushing the Eurozone economy into what de la Rubia called "stagnation territory."
ECB may find some comfort in the latest inflation signals. While input costs in services remained elevated, the pace of selling price increases eased. In the goods sector, input prices fell, breaking a four-month trend of rising costs, while output prices saw only a modest rise.
At the country level, both Germany and France mirrored the regional trend, with manufacturing output gaining but services activity declining.
Pound Hits Fresh High Against US Dollar Before Correcting: What’s Driving GBP/USD?
GBP/USD reached a seven-month peak at 1.3423 — its highest level since 26 September 2024 — before entering a corrective phase.
Key Drivers Behind GBP/USD Movements
Market concerns over US President Donald Trump’s criticism of Federal Reserve Chair Jerome Powell have eased. Trump has since clarified that Powell will not be dismissed, though he expressed frustration over the Fed’s reluctance to cut interest rates sooner.
The US Dollar’s rebound against the Pound followed the release of UK inflation data and a slightly weaker outlook for the labour market. Although the figures were published last week, the market has only now fully digested their implications.
In March, the UK Consumer Price Index (CPI) slowed to a three-month low. Meanwhile, the employment sector appears vulnerable ahead of another planned rise in employer taxes, due by the end of April.
Current market expectations suggest the Bank of England (BoE) will cut interest rates by 25 basis points (bps) in May, with an additional 85 bps of easing anticipated by year-end.
While US tariff policies are unlikely to directly impact UK inflation, their broader effect may contribute to lower rather than higher price pressures.
Technical Analysis: GBP/USD
H4 Chart Overview
- The pair formed a consolidation range near 1.3066 before breaking upwards in a wave structure towards 1.3420.
- A corrective pullback to 1.3200 is now underway.
- The next phase may see a resumption of upward momentum towards 1.3310, potentially establishing a new consolidation range around this level.
- The MACD indicator supports this outlook, with its signal line exiting the histogram area and pointing sharply downward, suggesting near-term bearish momentum.

H1 Chart Overview
- GBP/USD broke below 1.3310, hitting a local downside target at 1.3233.
- Today, the pair retested 1.3310 from below, and further downside movement towards 1.3200 is now in focus.
- The Stochastic oscillator aligns with this view, as its signal line remains below 80 and is trending downward towards 20, indicating weakening bullish momentum.

Conclusion
The GBP/USD rally has paused as traders assess mixed UK economic data and shifting Fed policy expectations. While near-term corrections are likely, the broader trend could see renewed upside if key support levels hold. Technical indicators suggest further consolidation before the next decisive move.
EUR/USD Dips From Highs, USD/JPY Eyes Fresh Increase
EUR/USD declined from the 1.1570 resistance and traded below 1.1470. USD/JPY is rising and might gain pace above the 142.45 resistance.
Important Takeaways for EUR/USD and USD/JPY Analysis Today
- The Euro started a fresh decline after a strong surge above the 1.1500 zone.
- There was a break below a key bullish trend line with support at 1.1440 on the hourly chart of EUR/USD at FXOpen.
- USD/JPY climbed higher above the 141.00 and 141.65 levels.
- There was a break above a connecting bearish trend line with resistance at 141.20 on the hourly chart at FXOpen.
EUR/USD Technical Analysis
On the hourly chart of EUR/USD at FXOpen, the pair rallied above the 1.1500 resistance zone before the bears appeared. The Euro started a fresh decline and traded below the 1.1500 support zone against the US Dollar.
There was a break below a key bullish trend line with support at 1.1440. The pair declined below 1.1410 and tested the 1.1310 zone. A low was formed near 1.1308 and the pair started a consolidation phase. There was a minor recovery wave above the 1.1370 level.
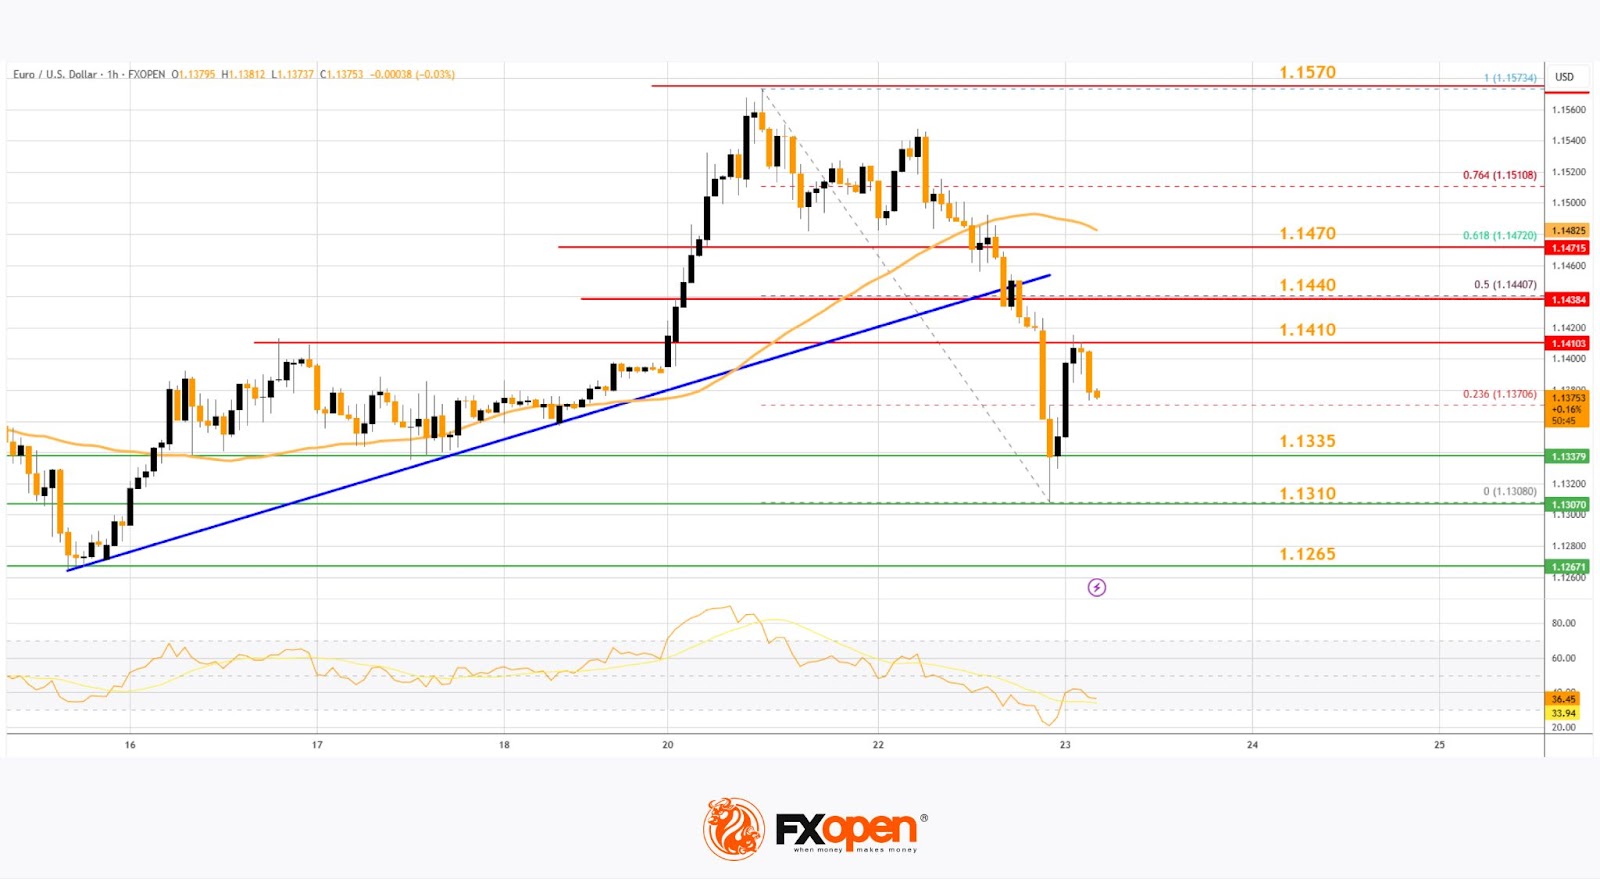
The pair climbed above the 23.6% Fib retracement level of the downward move from the 1.1573 swing high to the 1.1308 low. EUR/USD is now trading below 1.1440 and the 50-hour simple moving average.
On the upside, the pair is now facing resistance near the 1.1410 level. The next key resistance is at 1.1440 and the 50% Fib retracement level of the downward move from the 1.1573 swing high to the 1.1308 low.
The main resistance is near the 1.1470 level. A clear move above the 1.1470 level could send the pair toward the 1.1570 resistance. An upside break above 1.1570 could set the pace for another increase. In the stated case, the pair might rise toward 1.1650.
If not, the pair might resume its decline. The first major support on the EUR/USD chart is near 1.1335. The next key support is at 1.1310. If there is a downside break below 1.1310, the pair could drop toward 1.1265. The next support is near 1.1220, below which the pair could start a major decline.
USD/JPY Technical Analysis
On the hourly chart of USD/JPY at FXOpen, the pair started a fresh upward move from the 140.00 zone. The US Dollar gained bullish momentum above 141.65 against the Japanese Yen.
There was a break above a connecting bearish trend line with resistance at 141.20. It even cleared the 50-hour simple moving average and 142.45. The pair climbed above 143.00 and traded as high as 143.21 before there was a downside correction.
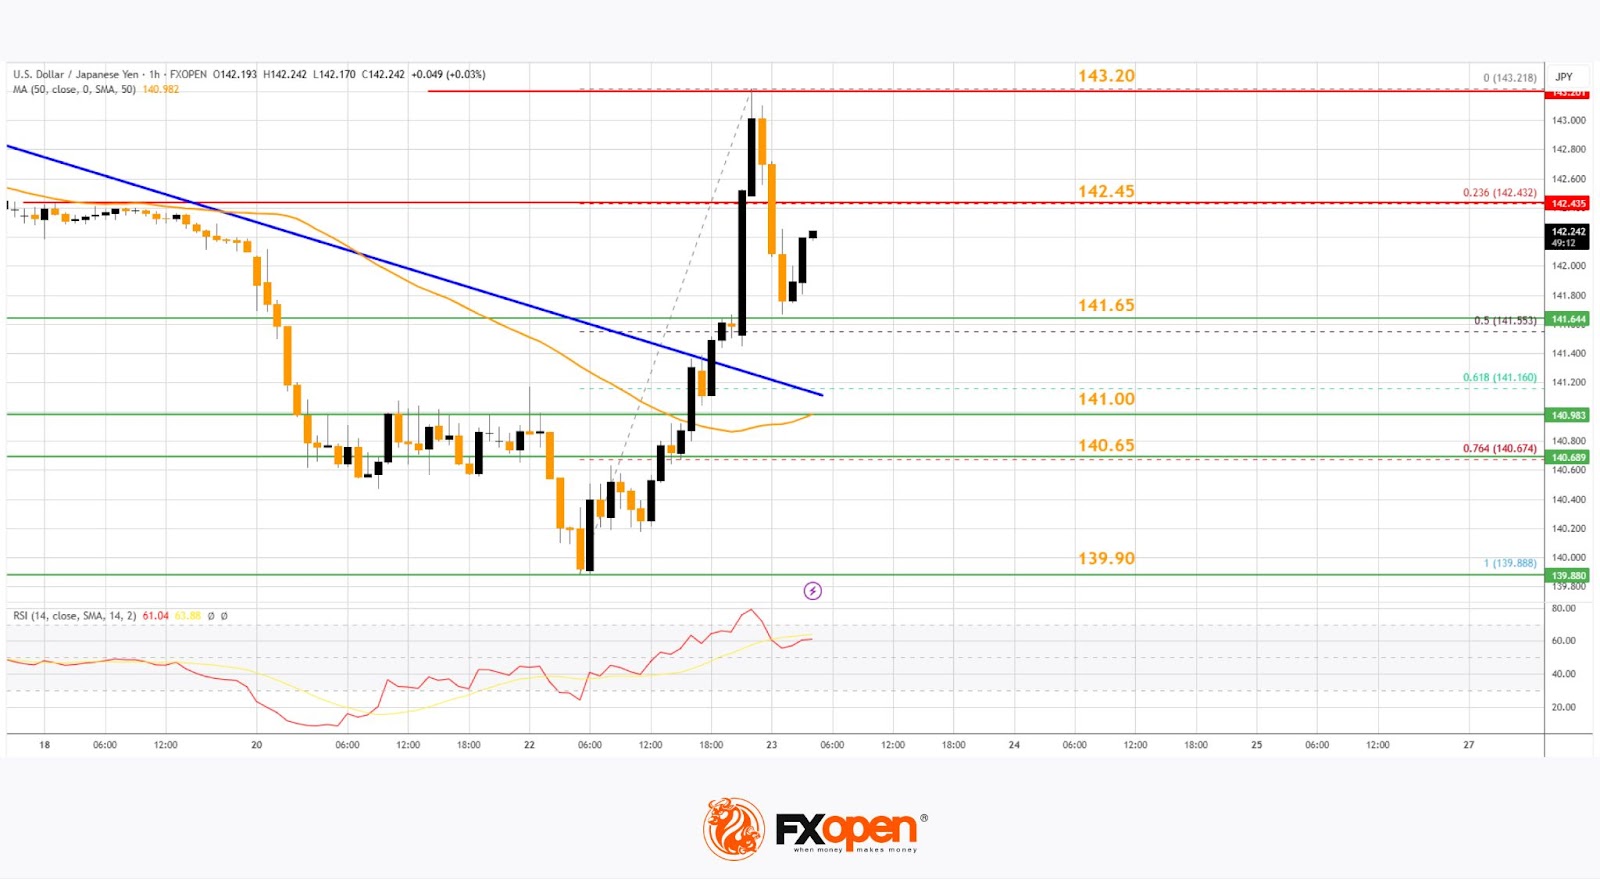
The pair dipped below the 23.6% Fib retracement level of the upward move from the 139.88 swing low to the 143.21 high. The current price action above the 141.65 level is positive.
Immediate resistance on the USD/JPY chart is near 142.45. The first major resistance is near 143.20. If there is a close above the 143.20 level and the RSI moves above 75, the pair could rise toward 144.50.
The next major resistance is near 145.00, above which the pair could test 148.00 in the coming days. On the downside, the first major support is 141.65 and the 50% Fib retracement level of the upward move from the 139.88 swing low to the 143.21 high.
The next major support is visible near the 141.00 level. If there is a close below 141.00, the pair could decline steadily. In the stated case, the pair might drop toward the 139.90 support zone. The next stop for the bears may perhaps be near the 137.50 region.
Trade over 50 forex markets 24 hours a day with FXOpen. Take advantage of low commissions, deep liquidity, and spreads from 0.0 pips. Open your FXOpen account now or learn more about trading forex with FXOpen.
This article represents the opinion of the Companies operating under the FXOpen brand only. It is not to be construed as an offer, solicitation, or recommendation with respect to products and services provided by the Companies operating under the FXOpen brand, nor is it to be considered financial advice.
US-China De-Escalation Optimism Sparked a Relief Risk Appetite Revival
Risk appetite returned in the overnight US session yesterday, 22 April, sparked by US Treasury Secretary Bessent's remarks that he sees a de-escalatory path forward regarding the U.S. trade standoff with China in a closed-door investor summit.
All the major US stock indices erased Monday’s losses with the S&P 500, Nasdaq 100, Dow Jones Industrial Average, and Russell 2000 gaining more than 2% yesterday, but remained below their respective 20-day moving averages.
Yesterday’s revival in risk appetite has also been led by a recovery in the US dollar, especially against the haven currencies, where the USD/CHF and USD/JPY gained by 1.2% and 0.5% respectively.
In today’s Asian opening session, the S&P 500 and Nasdaq 100 E-mini futures extended their intraday gains to 1.6% and 1.8% respectively at this time of writing, reinforced by the news report stating that US President Trump backed down from his earlier threat to remove Fed Chair Powell from office, and mentioned the 145% tariffs on Chinese imports will eventually “come down substantially”
Major Asian benchmark stock indices were jolted up by such “US-China de-escalation” optimism. Japan’s Nikkei 225 staged a rally of 2%, and Hong Kong’s Hang Seng Index surged by 2.4% at this time of writing.
Lack of safe haven demand triggered a sharp bearish reversal in gold (XAU/USD), which fell 1.3% to close yesterday’s US session at $3,381, its worst single-day performance since 7 April. This decline came after gold hit a fresh intraday all-time high of $3,500. Despite the pullback, it remains above its 20-day moving average, which continues to provide support around the $3,170 level.
In its latest updated World Economic Outlook report, the IMF cut economic growth forecasts for most countries due to US trade tariffs and rising trade tensions. The global economic growth forecast for 2025 was slashed to 2.8% from 3.3% projected in January.
Economic data releases
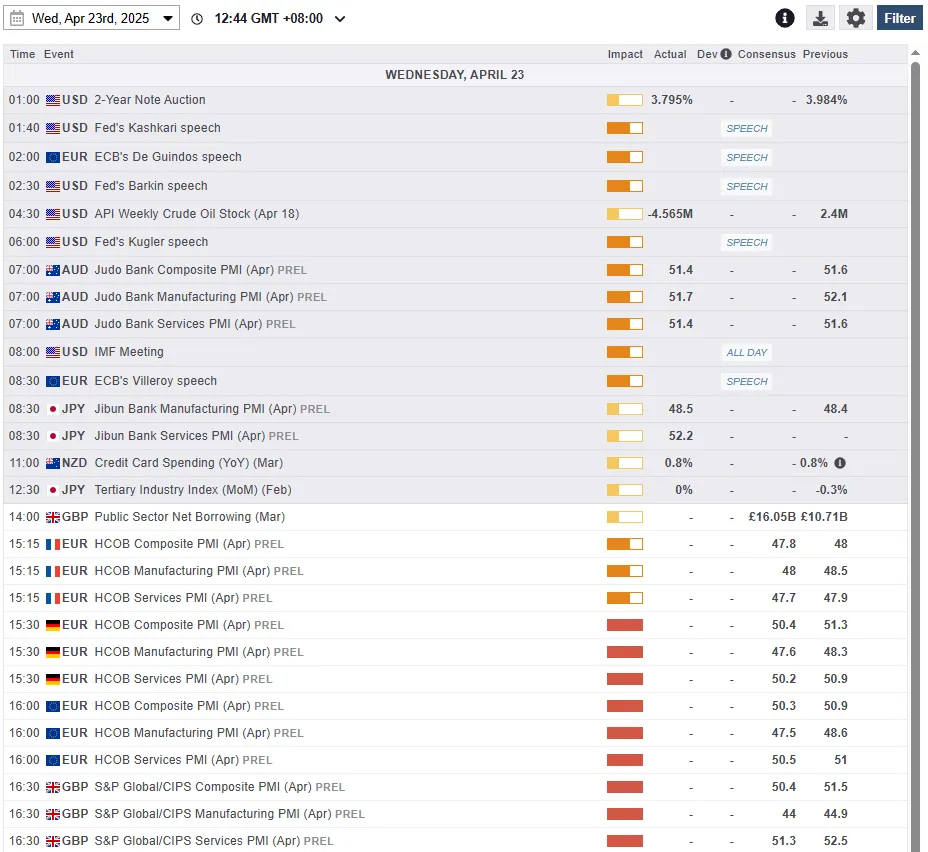
Fig 1: Key data for today’s Asian mid-session (Source: MarketPulse)
Chart of the day – Japan 225 cleared above 20-day moving average
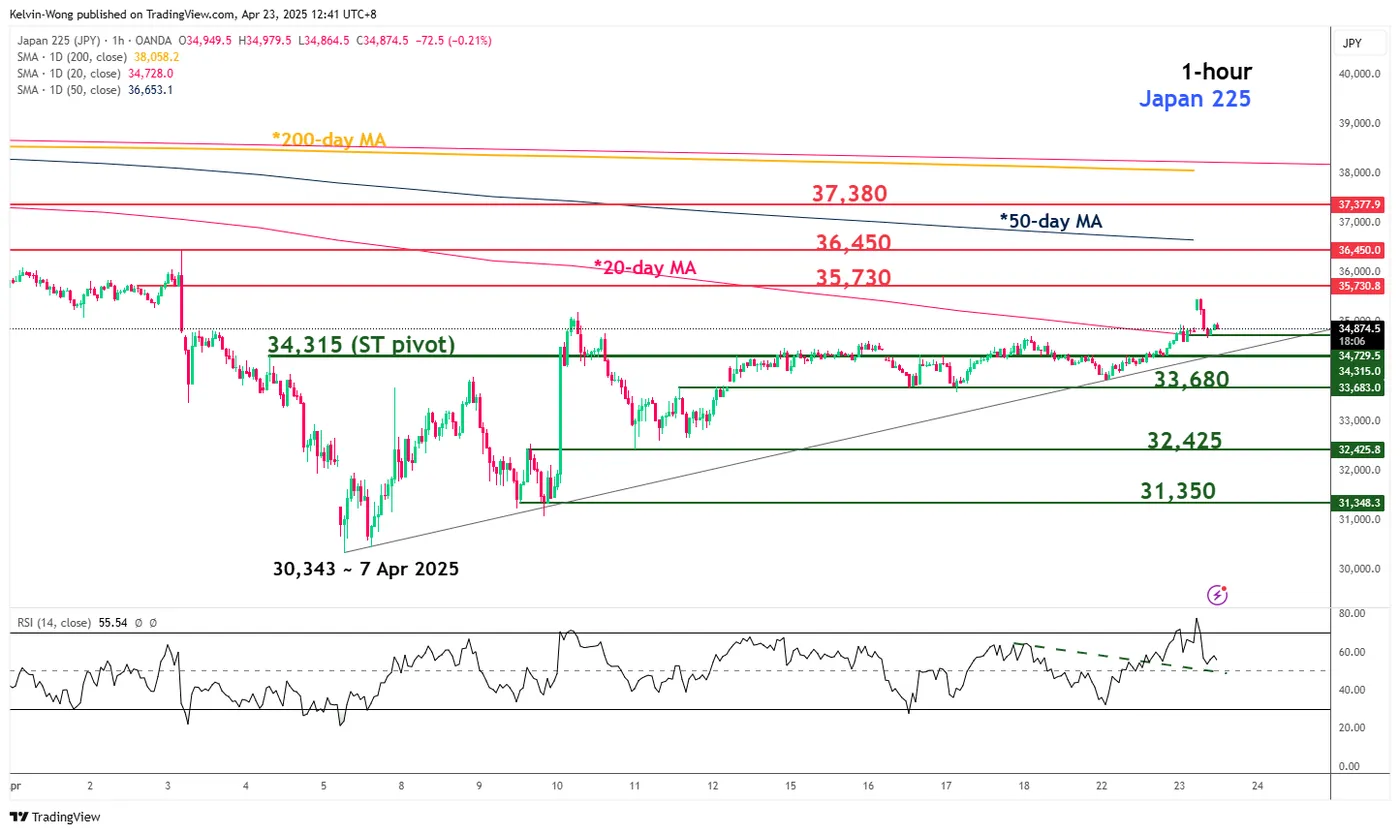
Fig 2: Japan 225 CFD Index minor trend as of 23 Apr 2025 (Source: Trading View)
The price actions of the Japan 225 CFD Index (a proxy of the Nikkei 225 futures) have staged a bullish gap-up above its 20-day moving average with a positive momentum reading in its hourly RSI momentum indicator, which suggests that it may extend its mean reversion corrective rebound in place since its 7 April swing low of 30,343.
Watch the 34,315 key medium-term pivotal support for the next immediate resistances to come in at 35,730 and 36,450 (also the 50-day moving average).
On the flip side, a break below 34,315 invalidates the bullish tone to revive the bears to expose the next intermediate supports at 33,680 and 32,425 in the first step.
Trump’s Comments Give Impression of Intended De-escalation Effort
Markets
Yesterday during the day, markets gradually entered calmer waters as the impact of the rift between President Trump and the Fed gradually unwound. US equities more than reversed Monday’s decline with major indices closing between 2.51% (S&P 500) and 2.71% (Nasdaq) higher. US Treasuries also entered calmer waters. Despite recent pressure from the White House, most Fed members (in a balanced way) still joined Chair Powell’s thesis that policy is currently well positioned for changes in the economy and that if the combination of a olid labour market and higher inflation risks/expectations persists, the Fed will keep rates on hold at least of a while (e.g. Fed Kugler). US yields in a corrective flattening move changed between + 5.7 bps (2-y) and -2.5 bps (30-y). However, the major market-relevant events still came after the close of US markets. President Trump’s media messages aren’t contained by the regular trading hours. In comments to reporters, he stated that he has no intention of firing Powell. He only would like him to be ‘early or on time as opposed to being late’ with respect to cutting interest rates. At the same time, the US President also struck a relatively ‘soft’ tone on trade negotiations with China as he indicated that tariffs might drop substantially in case of a deal. The comments of course were only a ‘temporary photo’ of the mindset at the White House. Even so, it gave the impression of some kind of an intended de-escalation effort. US equities rallied further post-market. The US yield curve this morning bull flattens (30-y -7.5 bps) and the dollar regains some further ground after yesterday’s intraday comeback (USD DXY 99.2, EUR/USD 1.138). On European markets, yields yesterday still declined a few bps (Germany -2.5 bps 2-y; -3.7 bps 30-y). Several ECB members, including Chair Lagarde, indicated that the ECB is close to reaching its price stability objective, but that all options are open for the June policy meeting as uncertainty remains elevated. Despite this balanced comments post last week’s ECB meeting, markets continue to anticipate further ‘aggressive’ ECB easing later this year (near 1.50% by year end). We assume this trend has gone (more than) far enough.
Asian markets this morning mostly show gains between 1 à 2% after the de-escalation in the US yesterday evening. Aside from new ‘guidance’ from the US administration, markets today will keep a close eye at the April PMI’s. Overall sentiment in EMU (composite PMI) is expected to backtrack from the positive momentum in March (50.2 from 50.9). The survey already covers the period after Trump’s tariff announcement on liberation day (April 2). Especially for Europe, we keep a close eye at the expected impact on prices. If slower growth coincides with rather modest price growth, it might further fuel the market debate on an additional ECB rate cut in June even as we consider it too early to draw conclusions. In the US, the composite index also is expected to ease from 53.5 to 52.0. Over there, a stagflationary narrative is likely, but an outright negative signal from the labour market might put additional pressure on the Fed to reconsider the balance with respect to its dual mandate. The dollar recently suffered from a US-driven risk-off, but we don’t expect a sustained comeback, even in case of a (temporary) improvement in risk sentiment.
News & Views
Czech National Bank deputy governor Frait yesterday signaled room for one more rate cut in the second half of the year, from 3.75% now to 3.5% even though investors expect it to be slightly lower in part due to global financial market turbulence. Money markets discount a 25 bps at the next, May 7, policy meeting and a 3% policy rate by year-end. Ahead of that meeting, the CNB still gets Q1 GDP data (Apr 30) and one additional CPI report (May 6). Frait wants to be very careful with further monetary easing with the labour market being one of the reasons. It is still tight and wages, especially in market services, are growing relatively quickly. Rising property prices and fiscal dynamics are other domestic inflation risks.
Rumours suggest that French President Macron is considering to call snap parliamentary elections as early as this autumn or alongside municipal elections next year (March). Macron is reportedly consulting with his inner circle and weighing the potential benefits and risks of such a move. The aim would be to regain a legislative majority, banking on his boost in popularity thanks to greater international prominence. The gamble to regain political stability through elections could backfire though in more political instability if results disappoint. Macron’s presidential term ends in April 2027 ahead next parliamentary elections (June 2029).
GBP/JPY Daily Outlook
Daily Pivots: (S1) 187.88; (P) 188.38; (R1) 189.29; More...
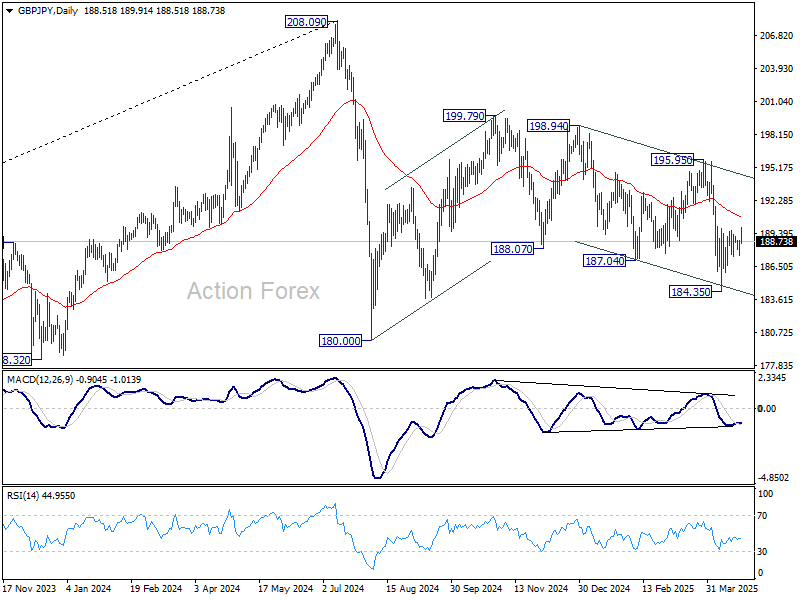
Intraday bias in GBP/JPY stays neutral and outlook is unchanged. Risk will remain on the downside as long as 190.06 resistance holds. Below 184.35 will target 180.00 low. Nevertheless, break of 190.06 will turn bias back to the upside for stronger rebound.
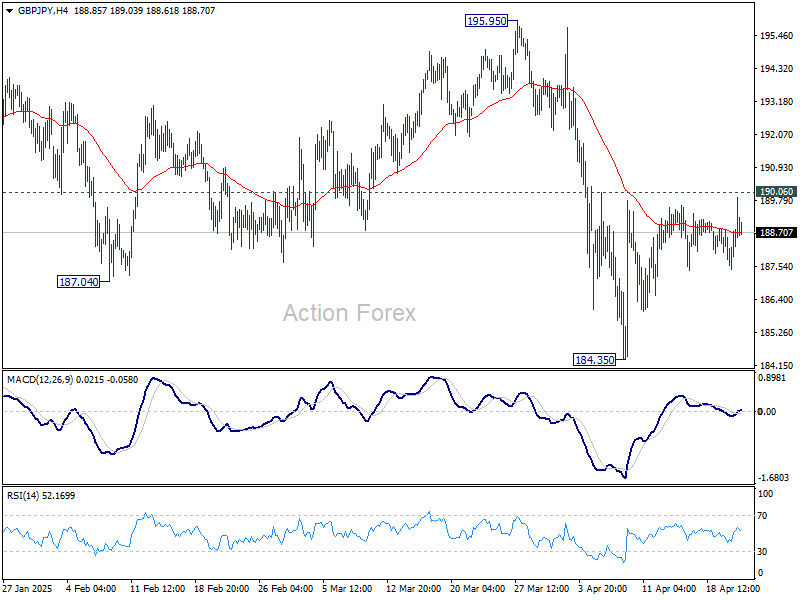
In the bigger picture, price actions from 208.09 are seen as a correction to rally from 123.94 (2020 low). Strong support should be seen from 38.2% retracement of 123.94 to 208.09 at 175.94 to contain downside. However, sustained break of 175.94 will bring deeper fall even still as a correction.
EUR/JPY Daily Outlook
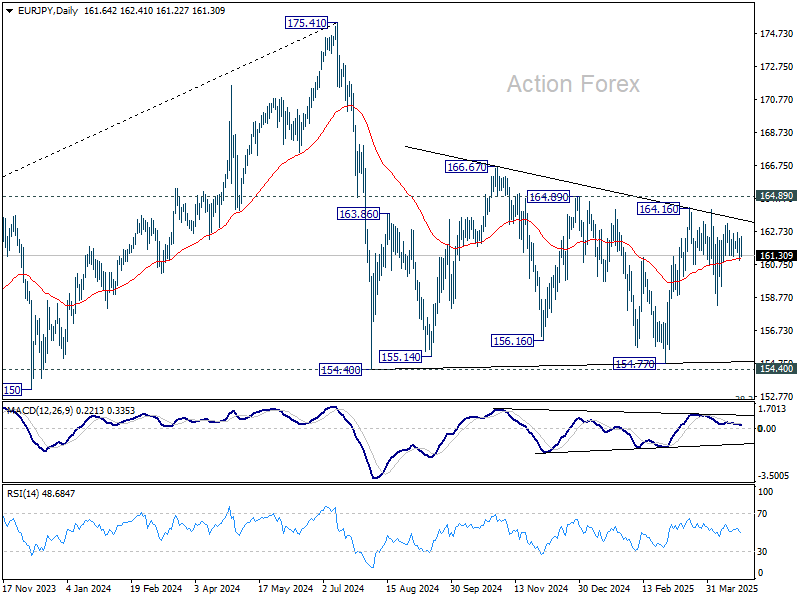
Daily Pivots: (S1) 161.03; (P) 161.68; (R1) 162.36; More...
Intraday bias in EUR/JPY remains neutral for the moment, and more range trading could be seen. On the upside, above 164.16 will resume the rally from 154.77 to 164.89 resistance, and then 166.67. However, decisive break of 158.27 support will bring deeper decline back to 154.77 support. Overall, sideway consolidation pattern from 154.40 is still extending.
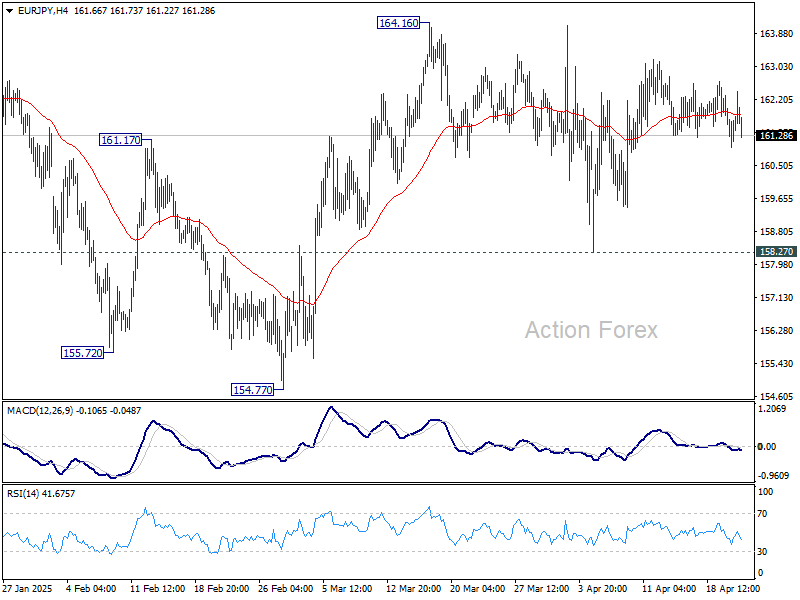
In the bigger picture, price actions from 175.41 are seen as correction to rally from 114.42 (2020 low). Strong support should be seen from 38.2% retracement of 114.42 to 175.41 at 152.11 to contain downside. However, sustained break of 152.11 will bring deeper fall even still as a correction.
EUR/GBP Daily Outlook
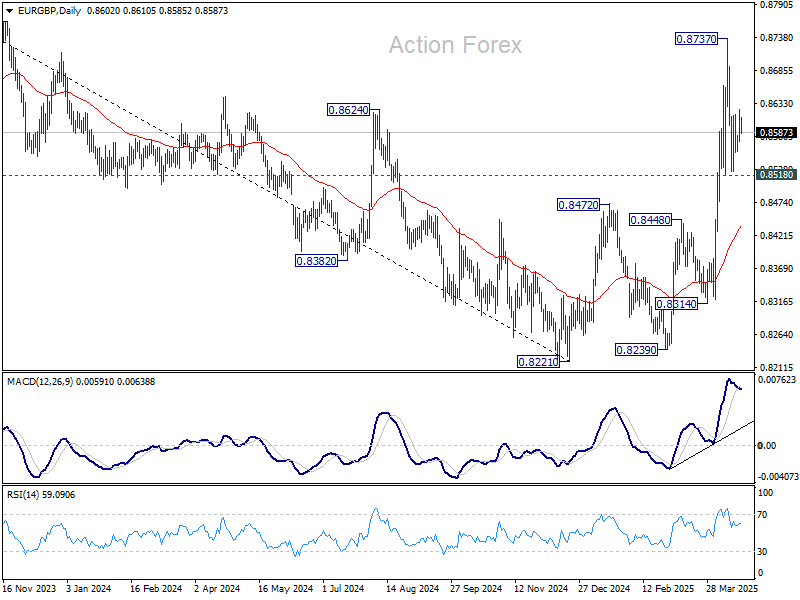
Daily Pivots: (S1) 0.8549; (P) 0.8582; (R1) 0.8599; More...
Intraday bias in EUR/GBP stays neutral at this point, and more consolidations could be seen below 0.8737 short term top. Further rise is expected as long as 0.8518 support holds. On the upside, break of 0.8737 will resume the larger rally from 0.8221. However, sustained break of 0.8518 will bring deeper fall back to 55 D EMA (now at 0.8438).
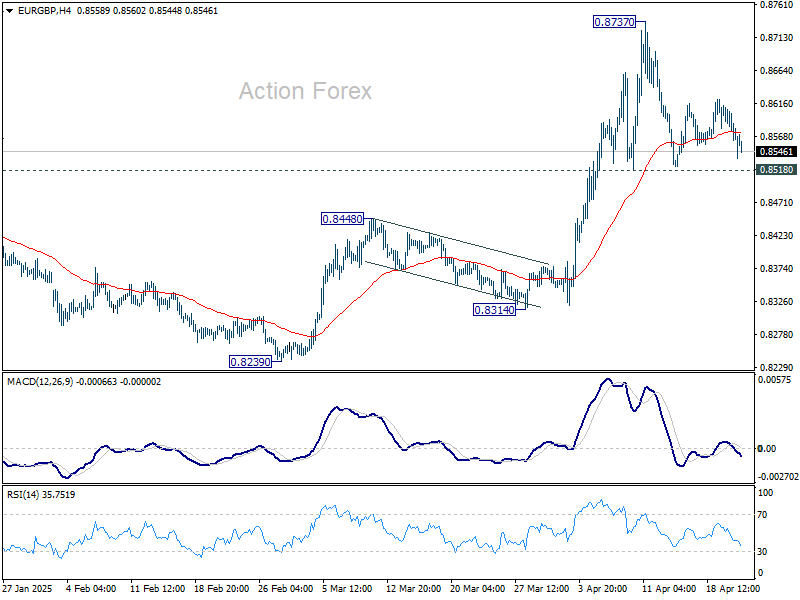
In the bigger picture, down trend from 0.9267 (2022 high) should have completed at 0.8221, just ahead of 0.9201 key support (2024 low). Rise from 0.8221 is likely reversing the whole fall. Further rise should be seen to 61.8% retracement of 0.9267 to 0.8221 at 0.8867 next. This will now remain the favored case as long as 0.8472 resistance turned support holds.
EUR/AUD Daily Outlook
Daily Pivots: (S1) 1.7873; (P) 1.7928; (R1) 1.7997; More...
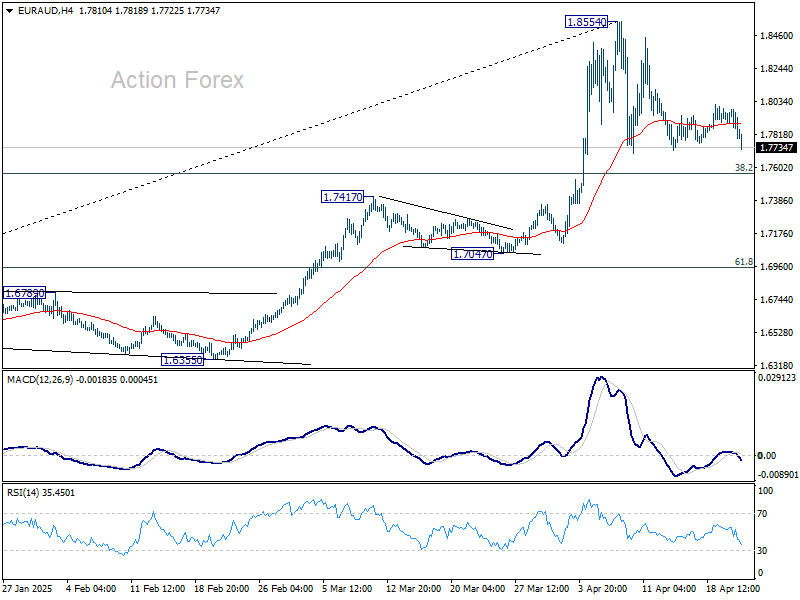
EUR/AUD is still extending the corrective pattern from 1.8554 short term top. Intraday bias remains neutral at this point. Downside of pull back should be contained by 38.2% retracement of 1.5963 to 1.8854 at 1.7750. On the upside, firm break of 1.8554 will resume larger up trend. However, firm break of 1.7750 will bring deeper fall to 55 D EMA (now at 1.7322).
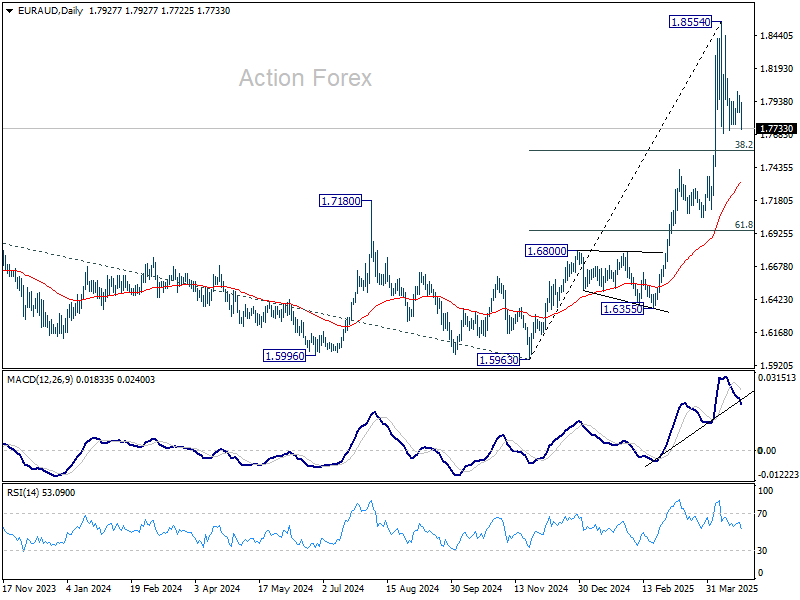
In the bigger picture, up trend from 1.4281 (2022 low) is in progress, and in reacceleration phase as seen in W MACD. Next target is 100% projection of 1.4281 to 1.7062 from 1.5963 at 1.8744. Firm break there will pave the way to 138.2% projection at 1.9806, which is close to 1.9799 (2020 high). Outlook will remain bullish as long as 1.7417 resistance turned support holds even in case of deep pullback.
EUR/CHF Daily Outlook
Daily Pivots: (S1) 0.9308; (P) 0.9335; (R1) 0.9381; More....
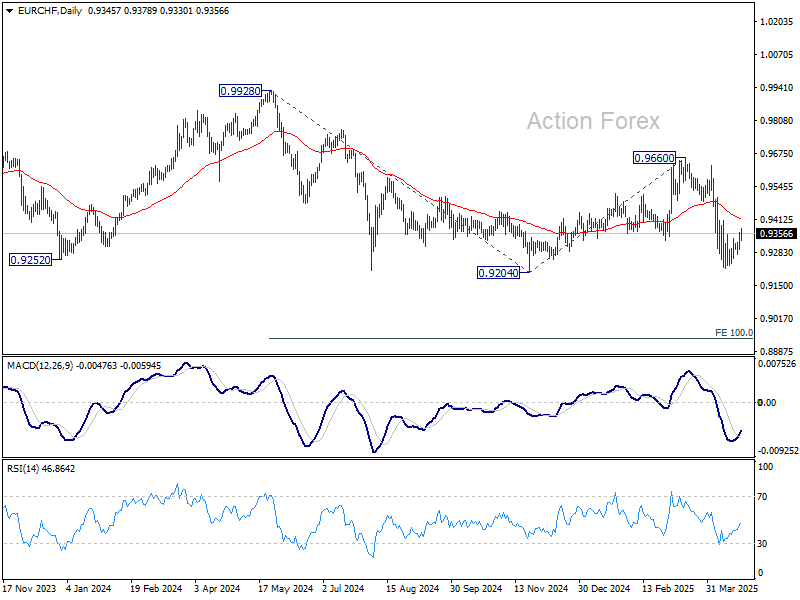
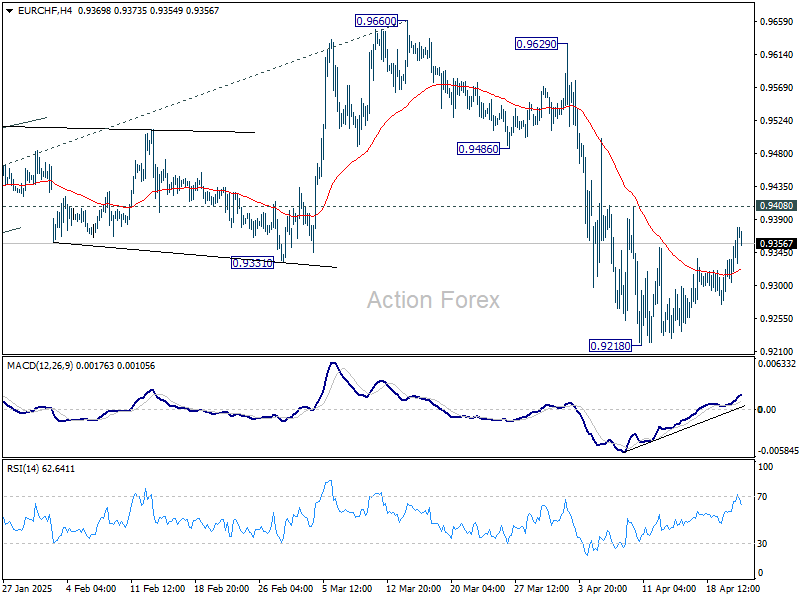
EUR/CHF's rebound from 0.9218 extended higher but stays below 0.9408 resistance. Intraday bias remains neutral and outlook stays bearish as long as 0.9408 resistance holds. On the downside, firm break of 0.9204 low will confirm larger down trend resumption.
In the bigger picture, rejection by long-term falling channel resistance (now at 0.9600) retains medium term bearishness. That is, down trend from 1.2004 (2018 high) is still in progress. Firm break of 0.9204 (2024 low) will confirm resumption. Next target is 100% projection of 0.9928 to 0.9204 from 0.9660 at 0.8936.