Sample Category Title
Aussie Reverses Its Losses In The Asian Session
For the 24 hours to 23:00 GMT, the AUD declined 0.50% against the USD and closed at 0.7153 on Friday.
LME Copper prices declined 0.7% or $44.5/MT to $5946.5/MT. Aluminium prices rose 0.1% or $1.0/MT to $2015.5/MT.
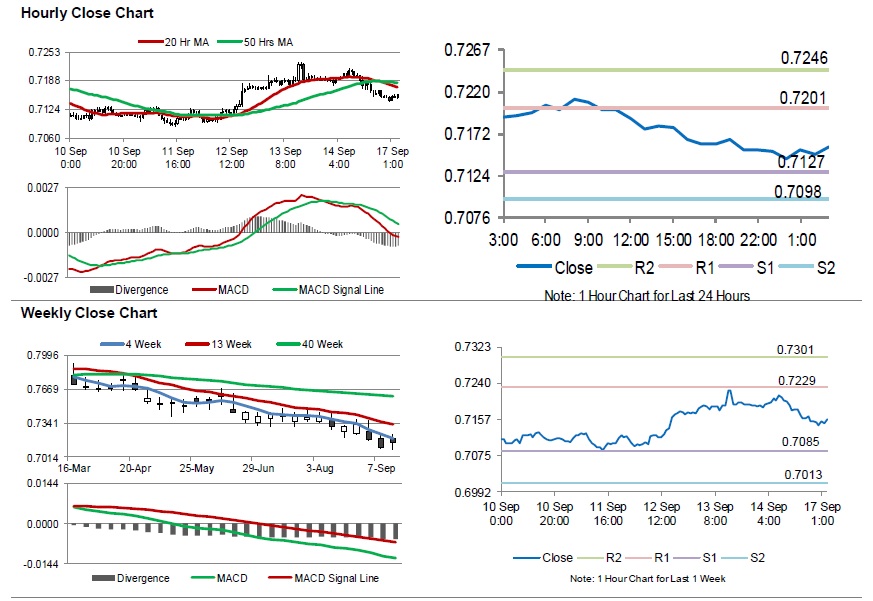
In the Asian session, at GMT0300, the pair is trading at 0.7157, with the AUD trading 0.06% higher against the USD from Friday’s close.
The pair is expected to find support at 0.7127, and a fall through could take it to the next support level of 0.7098. The pair is expected to find its first resistance at 0.7201, and a rise through could take it to the next resistance level of 0.7246.
Going forward, investors would await Australia’s 2Q house price index and the Reserve Bank of Australia’s (RBA) meeting minutes, scheduled to release overnight.
The currency pair is trading below its 20 Hr and 50 Hr moving averages.
Gold: Yellow Metal Trading On A Stronger Footing In The Morning Session
For the 24 hours to 23:00 GMT, Gold declined 0.69% against the USD and closed at USD1199.00 per ounce on Friday, as upbeat US economic data, boosted strength in the US dollar.
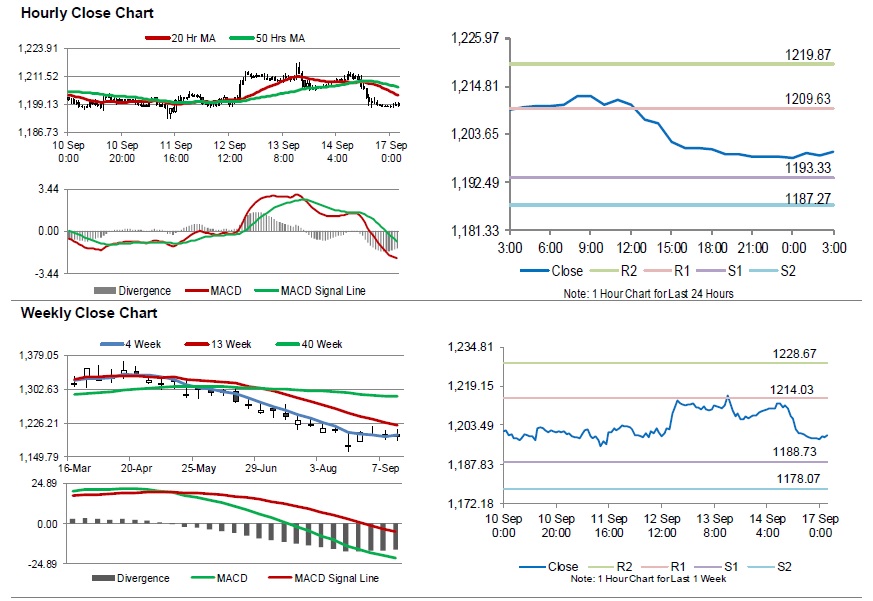
In the Asian session, at GMT0300, the pair is trading at 1199.40, with gold trading a tad higher against the USD from Friday’s close.
The pair is expected to find support at 1193.33, and a fall through could take it to the next support level of 1187.27. The pair is expected to find its first resistance at 1209.63, and a rise through could take it to the next resistance level of 1219.87.
The yellow metal is trading below its 20 Hr and 50 Hr moving averages.
Silver: White Metal Trading Slightly Higher This Morning
For the 24 hours to 23:00 GMT, Silver declined 0.88% against the USD and closed at USD14.10 per ounce on Friday, tracking losses in gold prices.
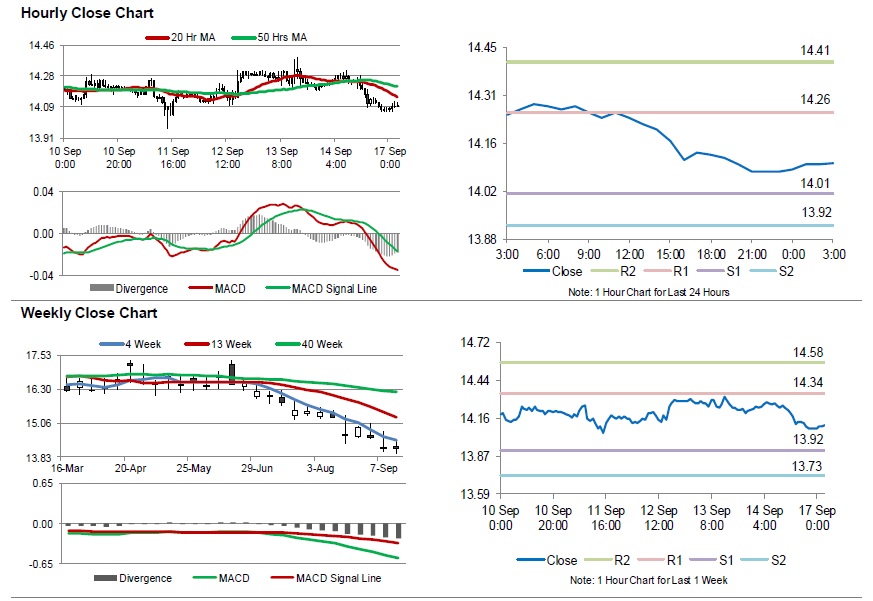
In the Asian session, at GMT0300, the pair is trading at 14.11, with silver trading a tad higher against the USD from Friday’s close.
The pair is expected to find support at 14.01, and a fall through could take it to the next support level of 13.92. The pair is expected to find its first resistance at 14.26, and a rise through could take it to the next resistance level of 14.42.
The white metal is trading below its 20 Hr and 50 Hr moving averages.
Crude Oil: Oil Extends Its Gains In The Asian Session
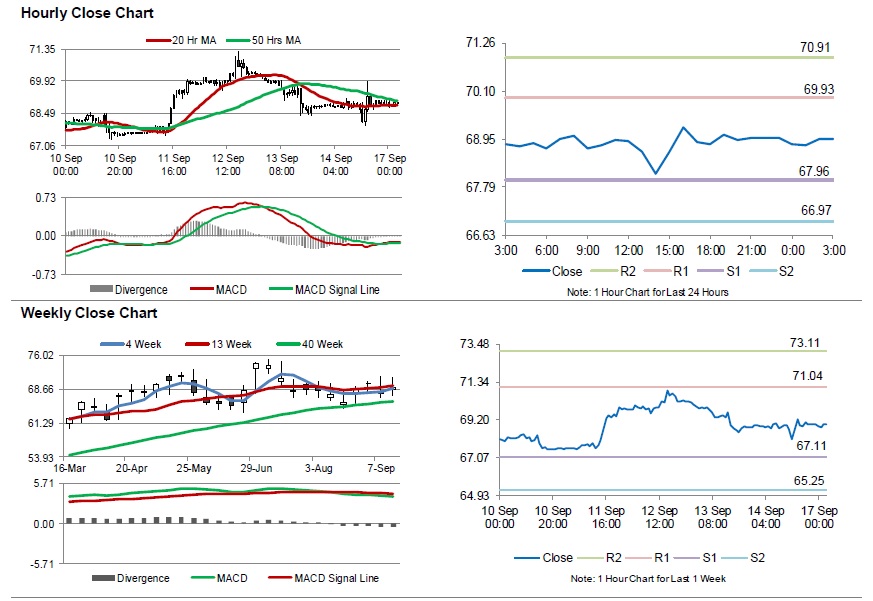
For the 24 hours to 23:00 GMT, Crude Oil rose 0.19% against the USD and closed at USD68.93 per barrel on Friday, ahead of US sanctions on Iran oil.
Meanwhile, fresh figures from Baker Hughes reported that the number of active oil rigs advanced by 7 to 867, after declining for two straight weeks in the week ended 14 September.
In the Asian session, at GMT0300, the pair is trading at 68.96, with oil trading slightly higher against the USD from Friday’s close.
The pair is expected to find support at 67.96, and a fall through could take it to the next support level of 66.97. The pair is expected to find its first resistance at 69.93, and a rise through could take it to the next resistance level of 70.91.
Crude oil is showing convergence with its 20 Hr and 50 Hr moving averages.
GBP/JPY Daily Outlook
Daily Pivots: (S1) 146.13; (P) 146.58; (R1) 146.90; More...
Intraday bias in GBP/JPY remains neutral for consolidation below 147.00 temporary top first. Current development argues that whole decline from 156.59 has completed at 139.88, just ahead of 139.29/47 key support zone. Break of 147.00 will target 149.30 key resistance for confirming our bullish view. On the downside, break of 142.58 support is needed to confirm completion of the rebound from 139.88. Otherwise, further rise remains in favor even in case of deep retreat.
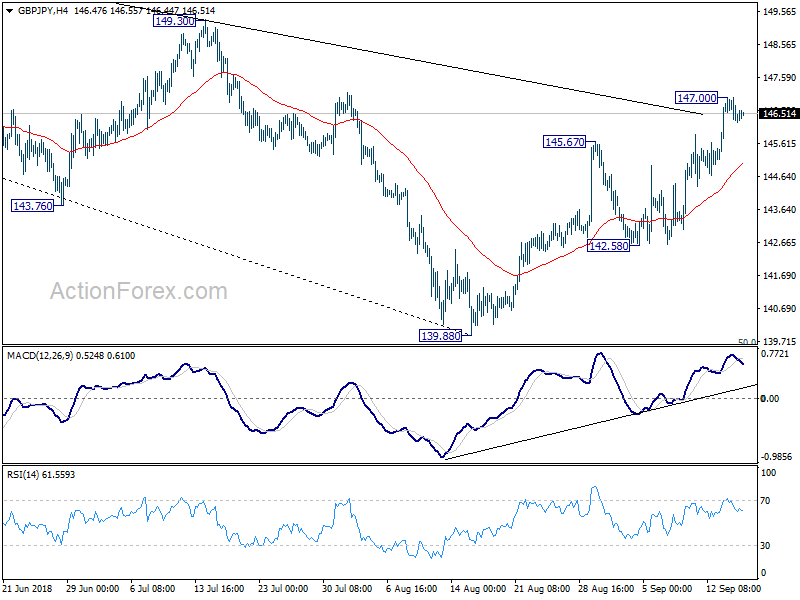
In the bigger picture, as long as 139.29 cluster support (50% retracement of 122.36 to 156.59 at 139.47) holds, the decline from 156.69 is seen as corrective move. That is, rise from 122.36 (2016 low), is still expected to extend higher through 156.69. However, sustained break of 139.29/47 should confirm medium term reversal and turn outlook bearish.
EUR/JPY Daily Outlook
Daily Pivots: (S1) 129.92; (P) 130.53; (R1) 130.87; More....
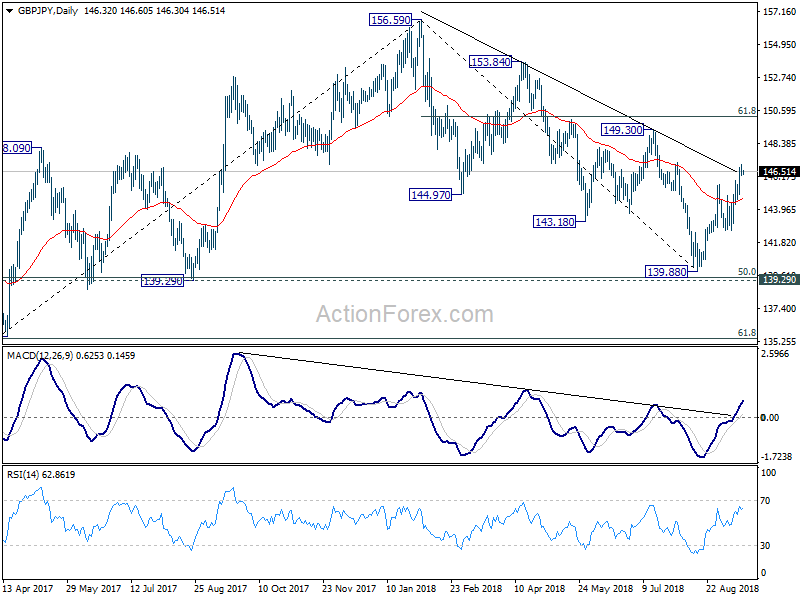
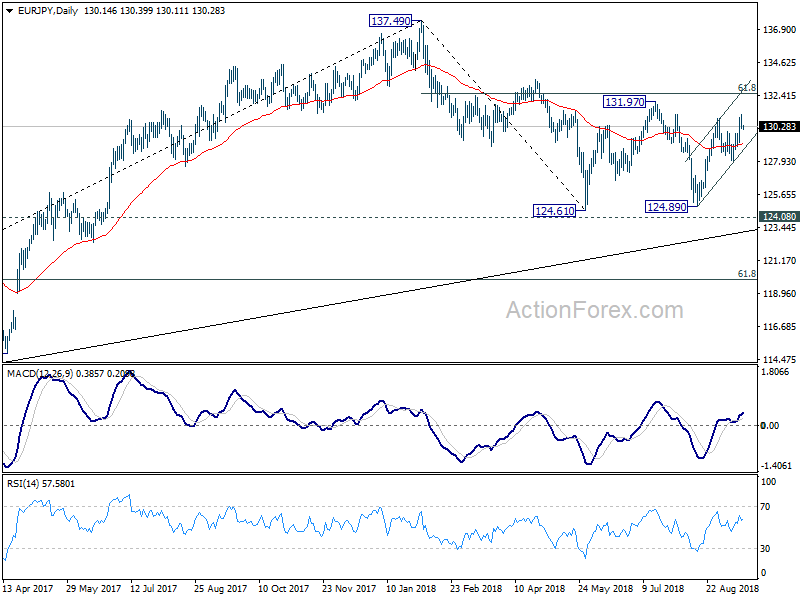
Intraday bias in EUR/JPY remains neutral for consolidation below 131.30 temporary top. Further rise is expected as long as 129.43 minors support holds. On the upside, break of 131.10 will resume the rebound from 124.89 to 131.97 resistance and then key fibonacci resistance at 132.56.
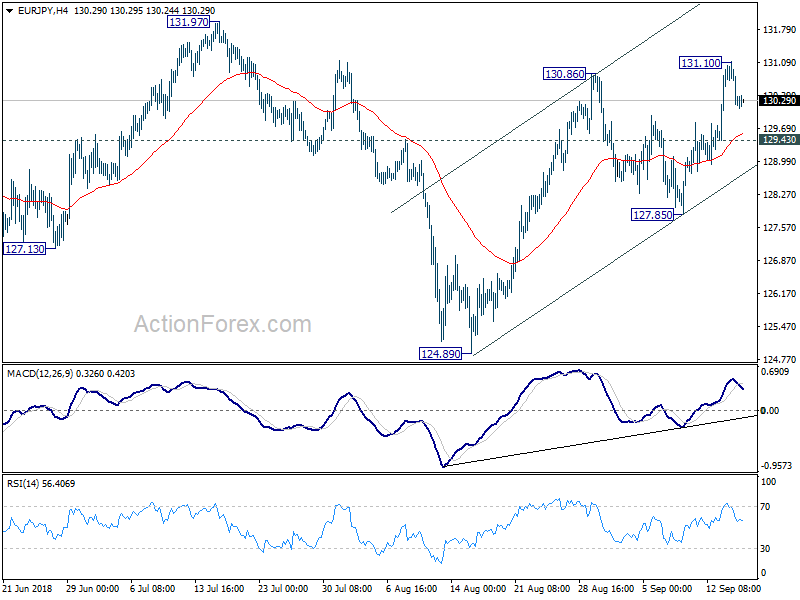
In the bigger picture, as long as 124.08 key resistance turned support, larger up trend from 109.03 (2016 low) remains in favor to continue. Decisive break of 61.8% retracement of 137.49 to 124.61 at 132.56 will pave the way to retest 137.49 high. However, firm break of 124.08 will argue that whole rise from 109.03 (2016 low) has completed at 137.49. Deeper decline would be seen to 61.8% retracement of 109.03 to 137.49 at 119.90 next.
EUR/GBP Daily Outlook
Daily Pivots: (S1) 0.8878; (P) 0.8906; (R1) 0.8920; More...
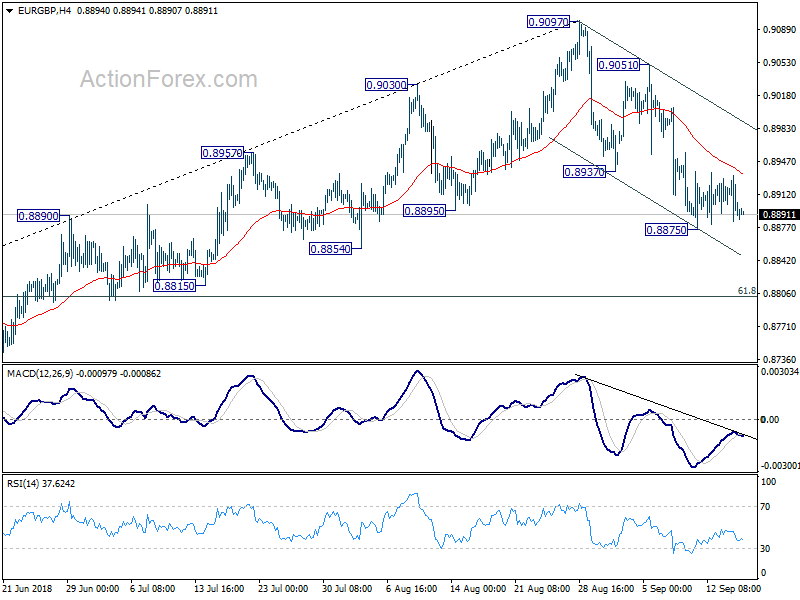
Intraday bias in EUR/GBP remains neutral for consolidation above 0.8875 temporary low. Outlook is unchanged that whole corrective rise from 0.8620 has completed at 0.9097 and deeper decline is expected. Upside of recovery should be limited well below 0.9051 resistance to bring fall resumption. On the downside, break of 0.8875 will target 61.8% retracement of 0.8620 to 0.9097 at 0.8802 and below.
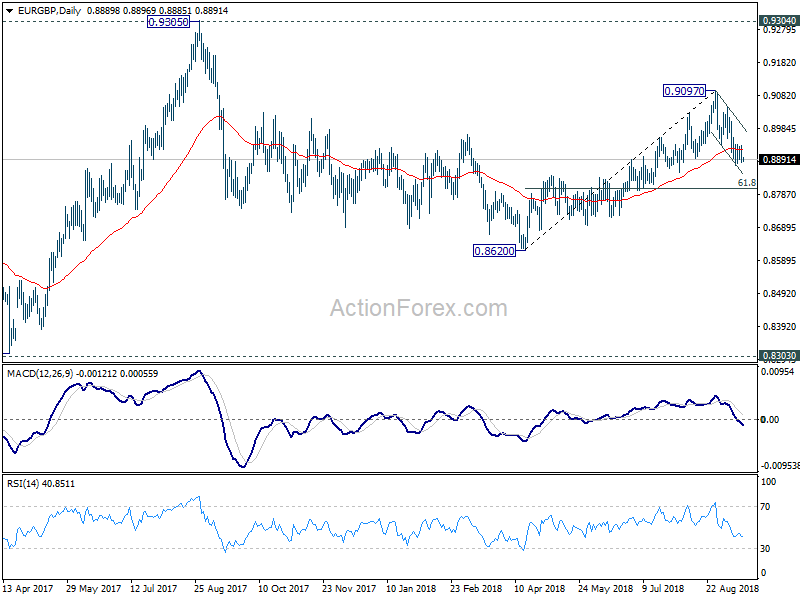
In the bigger picture, EUR/GBP is staying in long term range pattern from 0.9304 (2016 high). At this point, there is no clear sign of range break out yet. And more corrective trading would continue. On the upside, in case of another rise, we'd stay cautious on strong resistance from 0.9304/5 to limit upside in case of further rally. Meanwhile, if there is another medium term decline, strong support will likely be seen from 0.8303 to contain downside.
EUR/AUD Daily Outlook
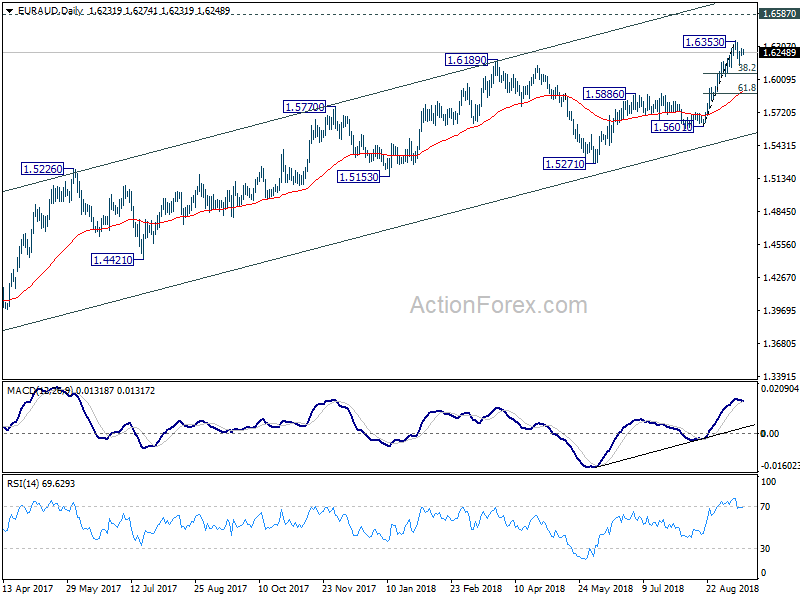
Daily Pivots: (S1) 1.6221; (P) 1.6253; (R1) 1.6280; More....
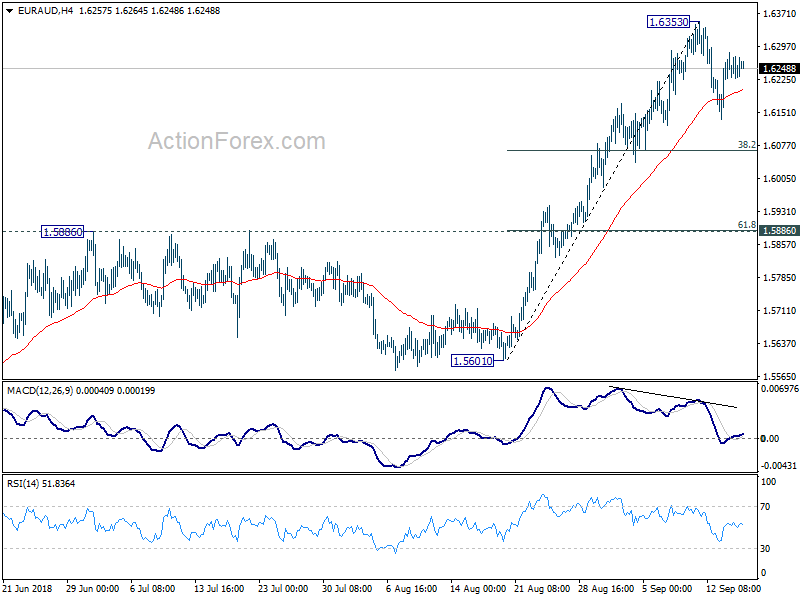
Intraday bias in EUR/USD remains neutral for consolidation below 1.6353 short term top. Deeper pull back could be seen to 38.2% retracement of 1.5601 to 1.6353 at 1.6066. But downside should be contained well above 1.5886 cluster support (61.8% retracement at 1.5888) to bring rise resumption. On the upside, break of 1.6353 will resume larger up trend to 1.6587 key resistance level.
In the bigger picture, up trend from 1.3624 (2017 low) is still in progress. Further rise should be seen to retest 1.6587 (2015 high). Decisive break there will resume the long term rally and target 1.7488 fibonacci level. On the downside, break of 1.5601 support is need to be the first sign of medium term reversal. Otherwise, outlook will remain bullish in case of deep pull back.
EUR/CHF Daily Outlook
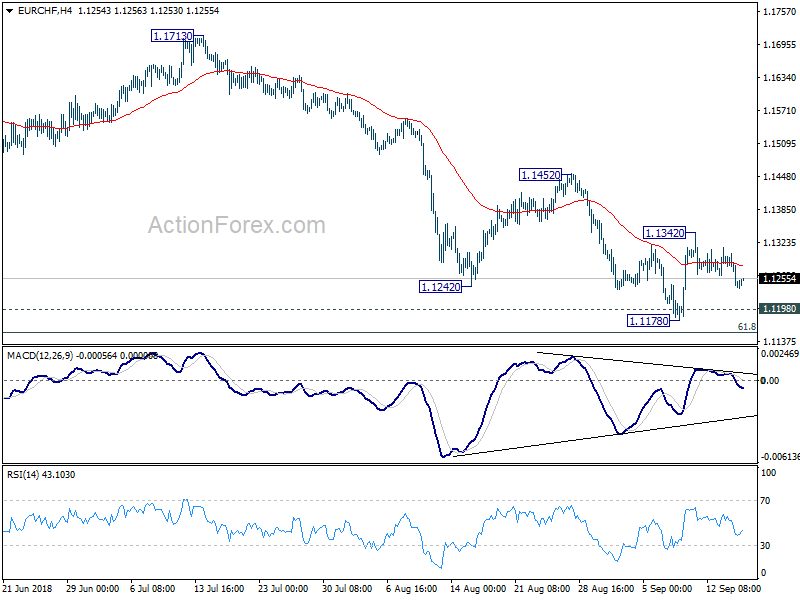
Daily Pivots: (S1) 1.1222; (P) 1.1263; (R1) 1.1286; More...
Intraday bias in EUR/CHF remains neutral for the moment. In case of deeper fall, we'd continue to expect strong support from key support zone of 1.1154/98 to bring reversal. On the upside, above 1.1342 will target 1.1452 resistance first. Break should confirm that whole decline from 1.2004 has completed a target 1.1713 resistance next. However, sustained break of 1.1154/98 will carry larger bearish implications.
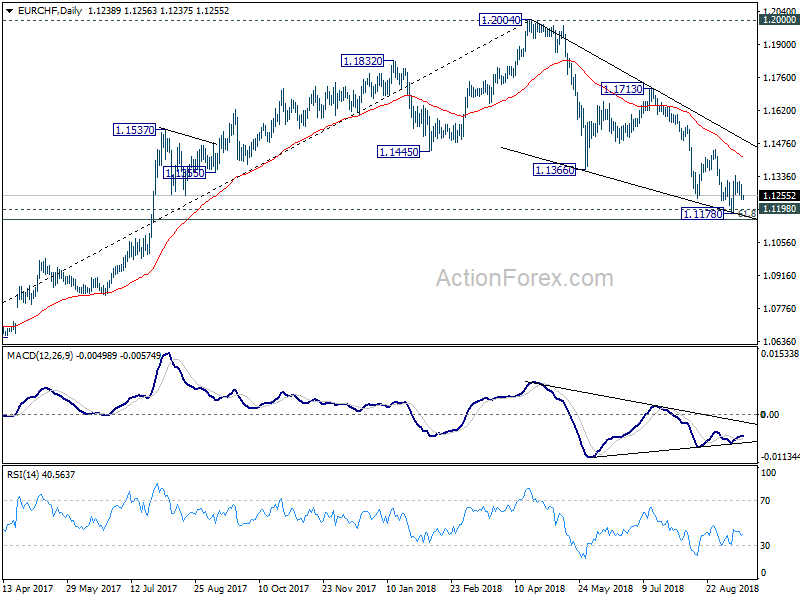
In the bigger picture, for now, the price actions from 1.2004 medium term top is seen as a correction only. Downside should be contained by support zone of 1.1198 (2016 high) and 61.8% retracement of 1.0629 to 1.2004 at 1.1154 to complete it and bring rebound. This cluster level is in proximity to long term channel support (now at 1.1207) too. A break of 1.2 key resistance is still expected in the medium term long term. However, sustained break of the mentioned support zone will mark reversal of the long term trend. In that case, 1.0629 key support will be back into focus.
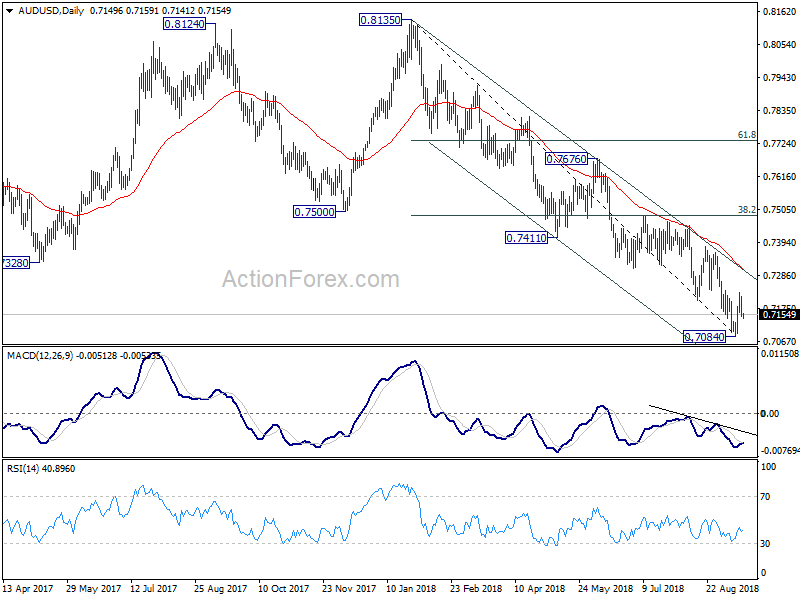
AUD/USD Daily Outlook
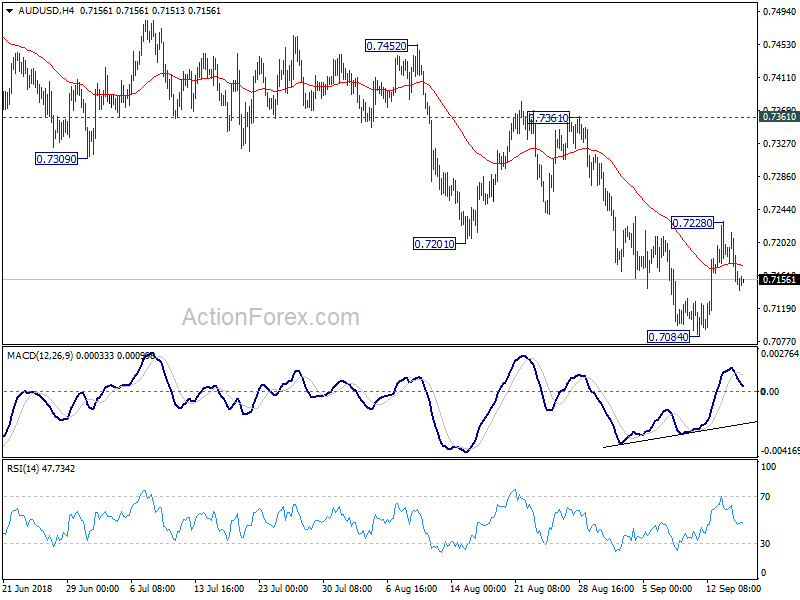
Daily Pivots: (S1) 0.7130; (P) 0.7173; (R1) 0.7199; More...
Intraday bias in AUD/USD remains neutral at this point. Rebound form 0.7084 short term bottom could extend. But it's seen as a correction and upside should be limited well below 0.7361 resistance to bring down trend resumption. On the downside, break of 0.7084 will resume the fall from 0.8135 for key support level at 0.6826. However, sustained break of 0.7361 will carry larger bullish implication.
In the bigger picture, rebound from 0.6826 (2016 low) is seen as a corrective move that should be completed at 0.8135. Fall from there would extend to have a test on 0.6826. There is prospect of resuming long term down trend from 1.1079 (2011 high). Current downside momentum as seen in daily and weekly MACD support this bearish case. Firm break of 0.6826 will target 0.6008 key support next (2008 low). On the upside, break of 0.7361 resistance, however, argues that a medium term bottom is possibly in place, and stronger rebound could follow. We'll assess the medium term outlook later if this happens.