Sample Category Title
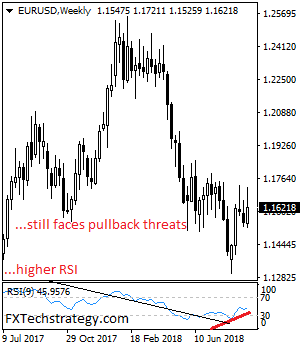
EURUSD – Outlook Remains Lower With Eyes On Key Support
EURUSD - The pair may have closed higher the past week but could see a move lower following its price reversal on Friday (see daily chart). On the downside, support lies at the 1.1600 level where a violation will aim at the 1.1550 level. A break of here will aim at the 1.1500 level. Below here will open the door for more weakness towards the 1.1450. Conversely, resistance comes in at 1.1650 level with a break through there opening the door for more upside towards the 1.1700 level. Further up, resistance lies at the 1.1750 level where a break will expose the 1.1800 level. All in all, EURUSD may have closed higher but faces pullback threats.
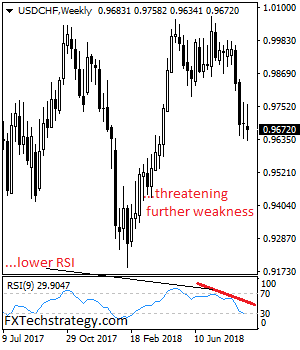
USDCHF – Vulnerable, Retains Its Bearishness
USDCHF - The pair looks to move further lower as it continues to hold on to its downside pressure. On the downside, support lies at the 0.9600 level. A turn below here will open the door for more weakness towards the 0.9550 level and then the 0.9500 level. On the upside, resistance resides at the 0.9700 level where a break will clear the way for more strength to occur towards the 0.9750 level. Further out, resistance comes in at the 0.9800 level. Above here if seen will turn attention to 0.9850. All in all, USDCHF faces further price weakness.
Another 200 Billion In Tariffs Looks More Likely Than Not
Another 200 billion in tariffs looks more likely than not.
Happy to hear that markets in Hong Kong are expected to start trading on Monday after Mangkhut roared through the City. But more significantly friends and colleagues are all safe!!
Now for the nuts and bots.
As many had suspected, despite Treasury Secretary Mnuchin’s attempts to broker a trade deal with China, the US may proceed with tariffs against China. While over the weekend wire reports suggested The Trump administration plans to announce within days new trade tariffs on as much as $200 billion in Chinese goods, quoting people familiar with the matter.
Trade issues and their impact on the global economy are likely to dominate investor focus this week.
Now whether this is little more than the President using this leverage as a negotiating tactic, but China officials will continue to be frustrated. This good cop bad cop routine continues to undermine Mr Mnuchin’s efforts as its still not clear if anyone other the Trump himself is commisioned to cut a deal. And not too unexpectedly and quite ominously China could cancel the meeting.
But assuming the Tariff go through Tuesday, given that this is not so unexpected I guess the big question is 10 % or 25%, and I suspect this is where the event tail risk lies. If Trump comes out with 25 %, we could get an outsized market reaction.
The market had interpreted Munchin meeting favourably and triggered a near 3% short covering rally in Emerging Markets late last week with the Hang Seng Index rallying over 3.5%. But HSI futures dropped over 1% in Friday trading after President Trump tweeted that he did not feel under pressure to reach a trade deal with China while HSCEI futures also fell. The offshore CNH fell to its lows for the day after the news as not unexpectedly Chinese leaders have promised retaliation for any US measures. All this noise is contributing to a very bearish setup this week.
None the less the trade war escalation playbook does suggest EURUSD and USDJPY will move lower, USDJPY on risk aversion but we could see an outsized move on the Australian dollar due to its G-10 China proxy status. And while the XAU-DXY correlation was wobbling a bit on Thursday, but if dollar buying does emerge, as the playbook suggests, Gold could trade lower if the stronger USD narrative re-emerge.
But at a minimum, the dollar should remain supported X JPY especially USDCNH, as the offshore RMB provides an excellent hedge to trade war escalations.
Looking for a glimmer of hope, however, remember Presidents Trump and Xi are expected to be offered a roadmap to work with by November and per White House Economic Advisor Kudlow, more US-China trade talks will likely take place on the sidelines of the UN meeting (September 18) and G20 (November 30). This news could take which will probably lessen the sting of this announcement hoping that indeed prevail and some progress can be made soon.
But mercifully its only 200 billion and not closer to 300 billion or more. Otherwise, it could get a bit messy in the markets this week.
Indeed local equity markets will be in focus as too will both Oil and currency markets. But with the ongoing string of solid US economic data, investors will also be concerned about rising US yields after the 10-year US Treasury bond hit 3 per cent of Friday. Even with best-laid plans, this could be a tricky week to navigate.
Oil Markets
Despite the likely positive impact from Iran sanction, traders were very much focusing on the adverse economic effects from trade war and how that could weight negatively on oil demand in Asia. And the weekend’s tariff headlines will not help that sentiment. So we are seeing some early pressure on WTI in Asia this morning, but frankly, risk sentiment outside of last weeks short covering rally has been sour, and as such I’m not expecting a great deal of support on the front
Also, there has been some backroom discussion again between the US and Russia with the US offering concessions tempting Russia to cap rising oil prices ahead of what is shaping up to be a contentious US midterm election. While it doesn’t necessarily imply lower oil prices, it does support some traders long-held view that OPEC and non-OPEC producer will try to cap Brent at $80 through the US November elections for no other reason to avoid the ” Wrath of Trump.”
In India, the weaker Rupee profile and higher oil prices are causing State-owned oil marketing companies (OMCs) to increase the rates of sensitive petroleum products like petrol and diesel in the country on Sunday. India imports about 80 per cent of its crude oil, and the falling Indian rupee will make the imports costlier and lead to a rise in fuel prices. So that hard cost impact is hitting consumers
Brent crude oil tested decent support level on Friday following up on Thursdays bearish shift in near-term sentiment y but driven primarily on the build in US oil products but trimmed losses into the close. WTI dips remained supported by the larger-than-expected 5.3 million barrels on the inventory report. But perhaps short cover covering as options on October WTI crude oil will expire on Monday probably influence given the markets lean. But with the risk-reward calculus not signalling a bullish setup for energy in general, in the absence of any supply disruption, the markets could struggle ahead of the OPEC meeting as oil producers were making a convincing argument that a likely downturn in the Global economy that could hurt oil. Of course, this is from a soothsayer’s perspective. And while impossible to quantify these unknowns, what we do know it that the weaker EM currency profile would most certainly hurt consumers appetite at the tertiary level of the demand curve. But Chinese commodity demand has appeared not to be destroyed by the 25% US tariffs on $34bn as China continues to offset trade headwinds by upping fiscal spend.
In the wake of depleting oil inventories Baker Hughes US Crude, Oil Drilling Rig Count hit +7 last week.
Gold Markets
The sting of positive US economic data on Friday supporting the markets base case Fed outlook, dented Golds appeal into the close. With US 10’s hitting the psychologically significant 3 % level on Friday, we could see more traders feasting with the Gold bears on Monday. So we could see more pressure on Gold prices as we near that critical $1190 level. While traders focus on the USD -Sino trade, the USD becomes an intricate part of the equation. as US dollar demand could emerge from investors looking to ride the lastest trade war storm under the umbrella of US bond yields.
US Equity Markets
Dow and S&P 500 managed to claw out gains as traders were treating the President more aggressive tone towards China trade with a grain of salt. However, after weakened headlines surfaced that the US administration delay for implementing tariff was more about the USTR taking into consideration comments for leading US business and not indeed as an actual reprieve, I would expect Asia markets could stumble out of the blocks .. So far, the US equity market has been relatively insulated to trade war, but further escalation has huge negative implications for global equities.
US Rates
While everyone thought US yields could begin to rise in September as the markets emerged from holiday but few could have predicted returns to come on as strong as the did with 10Y yield robust 3 % on the back of last week’s strong wage growth data in addition to some hawkish Fed-speak. The most significant shift in my view comes from Fed Governor Lael Brainard, who I dare say it starting to roost with the Hawk suggesting the sitting Federal Reserve Board is a tad more hawkish than markets have priced in.L last weeks lower than expected US CPI print does suggest we are nowhere near a reprice higher of the Fed curve. But with the market emerging from its summer slumber and may soon realise its pricing 2019 rate hike risk far too pessimistically if the strong run of US economic data continues and an even more so on the first glint of inflation.
Currency Markets
Australian Dollar
H The strong local employment data print last week it was a real positive signal for the Aussie, and when taken in context with the weaker USD CPI than expected, The Aussie was looking good, and market sentiment was shifting positive. But just as the Australian dollar bulls thought it was safe to go back into the water, tariffs and trade war-escalation are again front and centre in dealers minds.
The Euro
Trade war does throw some doubt into the EURUSD higher view for no other reason we may see USD demand on haven appeal. But if the latest trade war headlines remain little more than an idle threat given the EURUSD remains undrowned and if the USD does start to weaken again, the EURO could the best way to express USD weakness given Mario Draghi wonderful less dovish lean last week. Key levels remain 1.1730 and 1.1560.
Japanese Yen
Japanese PM Abe is widely expected to win Thursday’s LDP leadership vote which will enable him to continue as leader of the party for the next three years and become Japan’s longest-serving premier. The Bank of Japan is expected to keep policy on hold at its meeting this week as inflation continues to remain subdued. But traders will be focused on guidance
Indian Rupee ( New Currency Measures)
INR was supported via FPI’s on Friday after catching a tailwind from CBT’s aggressive rate hike and oil prices coming off Thursday boil this has marginally improved sentiment. This weekend’s measures will be viewed in a positive light and should keep Friday momentum going, but twin deficit currencies will remain in the market crosshairs.
Its intervention redux 2013 all over again so a good bit of this is priced in, And while Indias Macro picture is considerably more improved since then, but does it matter with the persistent threat of EM contagion wearing on investors? Not to mention higher US yields and the possibility of Oil prices surging after the US Iran sanctions are enforced.
But the overall feeling Im getting from the street is that provided the Rupee stays below 74 there will be no immediate concerns about servicing the debt. But the problem with that level is it does offer a target for the EM bears to focus on
Im still concerned about EM contagion but at his stage, the sell-off remains idiosyncratic mainly, but we could see USD buyers on kneejerk USDINR dip on Monday INR open as sentiment remains incredibly sour.
But ultimately il trade deficits improve the weaker links the EM Chain running large trade deficits will continue to face currency speculation scrutiny.
But the problem with that level is it does offer a target for the EM bears to focus on Im still concerned about EM contagion but at his stage, the sell-off remains idiosyncratic mainly, but we could see USD buyers on kneejerk USDINR dip on Monday INR open as sentiment remains incredibly sour.
Ultimately il trade deficits improve the weaker links the EM Chain running large trade deficits will continue to face currency speculation scrutiny.
Eco Data 9/17/18
[php_everywhere instance="1"]
Forex Forecast and Cryptocurrencies Forecast
First, a review of last week’s events:
EUR/USD. The dollar was under pressure for all five days, the difference between the weekly high and the low was about 200 points. Nothing special was said at the press conference following the ECB meeting, the plan to tighten the Eurozone monetary policy remained unchanged. Therefore, the main reasons for the US currency fall can be named as deflation in the US, called by the experts "the Fed's nightmare", and the decision of the Turkish regulator to increase the interest rate by as much as 625 points. This resulted in the Turkish lira going up and pulling up not only the currencies of developing countries, but also the euro.
Experts had pointed to the upper boundary of the medium-term side channel 1.1530-1.1745 as a ceiling for the EUR/USD growth last week. And this forecast turned out to be absolutely correct: the maximum was fixed at 1.1725, and the end of the five-day period was met by the pair at the level of 1.1622;
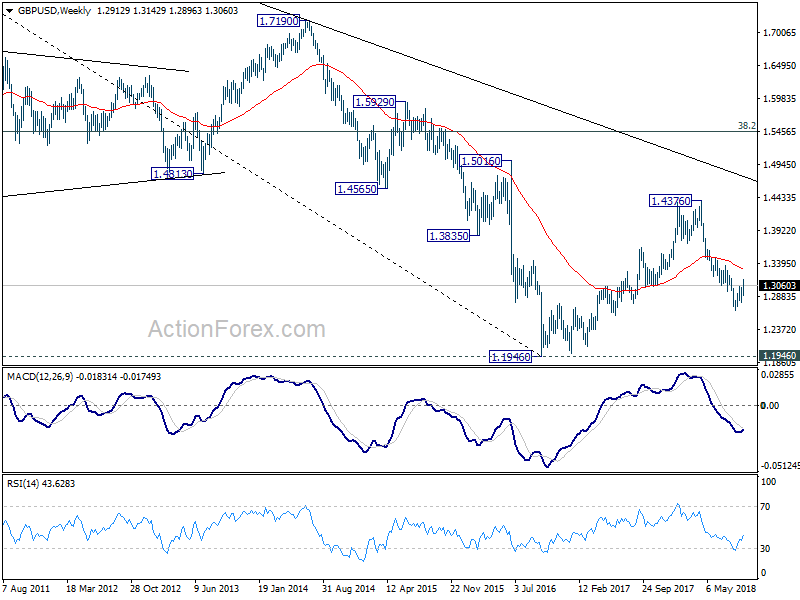
GBP/USD. In general, the weekly chart of this pair is very similar to that of the EUR/USD. On Friday, September 14, the British pound rose to 1.3147, reaching a six-week high. The head of the Bank of England Mark Carney helped his currency. In his view, the lack of an agreement on Brexit will cause a crisis that will lead to a fall in the pound, which will result in a higher inflation, which, in turn, may force the British regulator to raise the interest rate. As for the last week, the final chord here sounded at around 1.3065;
USD/JPY. The forecast, which had been given by graphical analysis on D1, had provided for the pair to grow to a height of 112.15. It was this height that the pair reached at the end of the week. It is interesting to note that while the dollar fell against many other currencies, it was actively growing against the Japanese yen. The reason for this is most likely the expectation of the start of a trade war with the United States to start and the strong dependence of Japan on the Iranian oil. As a result, the pair's growth was about 100 points in five days;
Cryptocurrencies. As was expected, at the beginning of the week the bears tried to break through the $6,000 level, but they have not succeeded to drop bitcoin below the mining profitability zone. When approaching this level, coins are bought out, and the pair BTC/USD goes up again. However, neither the forces nor the reasons for its revolutionary growth are yet sufficient. As a result, a fairly quiet scenario was implemented last week, and the pair stayed within 6,120-6,590.
As for Ethereum (ETH/USD), Litecoin (LTH/USD) and Ripple (XRP/USD), the movement of these pairs can also be considered a side movement: after the mid-week fall, they were able to almost restore their positions by the end of the five-day period.
As for the forecast for the coming week, summarizing the opinions of a number of analysts, as well as forecasts made on the basis of a variety of methods of technical and graphical analysis, we can say the following:
EUR/USD. From the point of view of fundamental analysis, no particularly important events are expected in the coming week. It is unlikely to expect surprises from European statistics on Monday and the speech of the ECB head M. Draghi on Tuesday. Most of the oscillators (60%) are painted in neutral grey, among the remaining, "green" has a certain advantage, 30%, the share of "red" is only 10%. "Bullish" sentiments prevail among the experts: 55% of them vote for the further growth of the pair and its transition to the zone 1.1745-1.1845.
Graphical analysis on H4 believes that the pair will remain in the corridor 1.1525-1.1745 with Pivot Point in zone 1.1630. But on D1, it does not exclude the fall of the pair to the August lows in zone 1.1300;
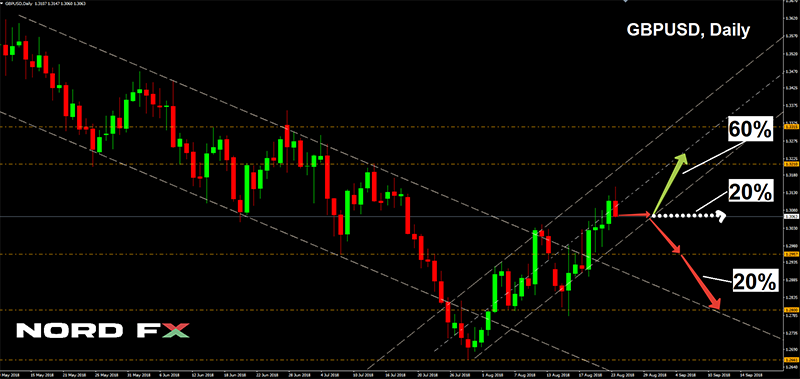
GBP/USD. 60% of experts, inspired by Mark Carney and supported by the overwhelming majority of oscillators, trend indicators, as well as graphical analysis on H4, believe that the pair will continue its growth to the zone of 1.3210-1.3315.
20% of analysts have taken a neutral position, and another 20% are confident that the dollar will recover its positions and the pair will go down to supports 1.2955 and 1.2800. The final target is at the low of August 15 at the level of 1.2660. This scenario is supported by 10% of oscillators giving signals that the pair is overbought. As for the graphical analysis on D1, it specifies that the pair can grow to resistance 1.3210 before going south;
USD/JPY. The formation of trends can be influenced by the Bank of Japan meeting on Wednesday, September 19 and the decision on the interest rate, which is now negative and is -0.1%. Undoubtedly, a lot will depend on the situation with trade relations between the US and China, as well as President Trump's desire to open another front of the trade war, this time with Japan. It is these factors that will determine the market's opinion on whether it is worth considering the yen as a safe haven.
At the moment, 50% of analysts vote for the return of the pair first to zone 111.00, and then to the support of 110.35, 15% of the oscillators agree with this, signaling the pair is overbought.
An alternative scenario, the growth of the pair to a height of 113.20, is supported by 35% of experts, 85% of oscillators and 100% of trend indicators on H4 and D1. 15% of the analysts surveyed could not determine the opinion;
Cryptocurrencies. The stay of the BTC/USD in the corridor between $6,000 and $7,000 indicates that the market is now dominated by short-term speculators. Major long-term players have taken a wait-and-see position, while keeping a strong interest in cryptocurrencies. But it is only them who can initiate a new rally and a massive influx of funds to this market. Meanwhile, the total capitalization fluctuates around the figure of $200 billion, updating local lows repeatedly. Thus, on September 12, the next one was touched, at the level of $186 billion, after which the market returned to $200 billion. It is not excluded that we will see another attempt of the bears to break support at $6,000 next week. However, if bitcoin manages to gain a foothold above the horizon 6,620, the pair has many chances to return to the high of September 5 at the height of 7.410.
Forex Forecasts: Basic Forex Forecasting Techniques
It's not an exaggeration to say that the Forex market is the largest financial market in the world, especially with a daily volume of $1.5 trillion. The FX market has no physical location and no central exchange. Instead the foreign exchange market operates through a huge electronic network of banks, corporations and individuals trading one currency for another.
When entering the Forex market, it's better to come prepared - and that's when Forex forecasting comes into play. Forecasting in FX means predicting current and future market trends by utilising existing data and different facts. Being an analyst, one should rely on both fundamental and technical statistics in order to predict the directions of the economy, stock market and individual securities.
For those who trade in Forex, knowing the techniques of how to forecast the FX market can be the resounding difference between those who trade successfully and those end up losing money. As soon as you start to learn about Forex trading, you should also start learning how to forecast the FX trading market. This article has been prepared with the purpose of helping you learn the basic Forex forecasting techniques and how to apply them in your FX trading.
Overview of main methods
There are a number of methods available to a trader when forecasting the Forex market. Each system is used to gain an understanding of how Forex works and how various fluctuations in the market can affect traders and consequently currency rates. Technical and fundamental analysis are the most commonly used methods used by traders. Although these methods differ, each one can help Forex traders understand how rates are affecting the trade of a certain currency. Experienced traders and brokers who are well acquainted with each method can use a mixture of the two with great efficiency.
The first method used by Forex forecaster is technical analysis. There are three basic principles which are applied to make projections. These principles are based on activity in the FX market in relation to current events, trends in movements in prices and past Forex history. At the time of each market action, almost everything important from supply and demand, current politics and the current state of market in question is taken into consideration. It is widely believed that Forex prices are a direct reflection of events currently taking place in the world.
A trend in price movement is indeed another factor taken into account whilst utilising technical analysis. This means that there are patterns in FX market behaviour which have been regarded as a significant contributing factor in movements in the Forex market. These patterns are often repeated over certain periods of time and are often an essential factor when predicting the Forex market. There is another factor which should be taken into account while making Forex forecasts - and that is history. There are determined patterns in the FX market and they are usually comprised of reliable factors.
In addition, there are several charts that should be taken into serious consideration when forecasting the FX market through technical analysis. Five categories which must be looked at are: indicators, waves, trend, gaps and number theory. These charts can be complicated - and whilst novice traders may find them difficult to follow - most professional FX brokers will have a good understanding of these charts and will provide their clients with well-informed advice about foreign exchange trading.
The second method of FX forecasting is fundamental analysis, which is used by experienced traders as well as brokers to forecast trends in Forex. This type of analysis is also used to predict the future of price movements formed on events that have not occurred yet. This may range from political to geopolitical changes, environmental factors and even natural disasters. Considerable factors and statistics are applied to predict how certain events will affect supply and demand, along with rates in the FX market. This method shouldn't be regarded as a reliable factor on its own, though it can be used in line with technical analysis to form an opinion about the various changes in the FX market.
As you can see, for those who are involved in Forex trading, a basic comprehension of how the system works is crucial. Understanding the methods which allow traders to make Forex forecasts and trading signals may help traders be more successful in their trading. Professional traders and brokers can utilise both technical and fundamental analysis when they have to make definitive decisions about the Forex market. When an individual trader uses them together, it can provide them with useful and indispensable information about the movement of currency trends. Learning how to make Forex predictions is hard and takes time, but having that extra knowledge will prove to be invaluable in your Forex career.
The ways of forecasting currency changes
We would like to show you how you can forecast the Forex market by exemplifying Forex forecasting methods. It is quite a challenging task to generate a forecast of good quality, but we will describe four methods of doing so based on a level of high proficiency.
The purchasing power parity
This method is perhaps the most popular one due to its inclusion in economic textbooks. The PPP forecasting technique is rooted in the theoretical 'Law of One Price', which in fact states that identical goods in various countries should have identical prices. That also implies that there should not be any arbitrage opportunity for someone to buy something cheap in one country and sell it in another in order to gain profit. Based on this principle, the PPP approach of forecasting Forex predicts that the exchange rate will change to counteract changes in prices due to inflation. For instance, let us suppose that prices in the US are anticipated to increase by 4% over the next year, whilst prices in Canada are expected to rise by only 2%. Thus, the inflation difference between these two countries is 2%. In turn, this suggests that prices in the US are anticipated to rise faster in comparison to prices in Canada. Hence, the PPP method would actually forecast that USD would have to depreciate by nearly 2% to keep prices between both countries in relative equality.
Relative economic strength
This approach looks at the power of economic growth in various countries to make currency market forecast concerning the direction of exchange rates. The logic behind this approach is that a powerful economic environment and high growth has a bigger likelihood of attracting foreign investors. Therefore, in order to purchase investments in the yearned country, an investor would have to buy the country's currency. This creates an increased demand that should eventually cause the currency to appreciate. The same will happen due to another factor that may draw the investors' attention - interest rates. High interest rates will undoubtedly attract investors looking for the highest yield on their investments, causing demand for the currency to increase. On the other hand, low interest rates may result in investors avoiding investing in a country, or alternatively borrowing the currency of the country with low interest rates to fund other investments.
If we compare this approach to PPP, relative economic strength does not forecast the actual position of the exchange rate, but instead gives a general sense of the currency's behaviour (appreciate or depreciate) and the overall feel for the movement's strength.
Econometric models
The next method of currency market forecasts involves gathering factors that you anticipate to affect the movement of a particular currency and creating a model that relates those factors to the exchange rate. The factors applied in econometric models are usually based on economic theory, however, any variable can be added if it is thought to considerably influence the exchange rate.
Time series model
The last method we will present to you is the time series model. This approach is entirely technical in nature and is not formed on any economic theory. One of the time series sub-approaches is the autoregressive moving average process. The reason for utilising this method is based on the idea of using past behaviour data and price patterns to predict future price behaviour.
Conclusion
We have discussed Forex trading forecasting and the main techniques to be used. We have also exemplified the methods of forecasting the direction of exchange rate. As you can see, the appliance of certain techniques requires complete understanding and certain trading skills. Not every technique will be suitable for everyone - it is a subjective matter. For novices, forecasting can be a tedious task - especially in the early stages of their career - but it is worth doing as the benefits have the potential to improve profitability.
Trump to announce new tariffs on China as soon as Monday, 10% instead of 25%
Reuters reported that, based on unnamed source, Trump is ready to announce the next round of tariffs on USD 200B in Chinese goods, as soon as on Monday. However, the tariff rate could be at 10%, which is much lower than the 25% rate Trump intended to impose. There is no comment from the White House on the news yet. At the same time, Treasury Secretary Steven Mnuchin is restarting trade talks with China, involving Vice Premier Liu He. But there is no detail the meeting, not even a date yet.
In the middle of last week, before the news that Mnuchin sent an invitation letter to China for talks, a massive new campaign against Trump's tariffs was launched. The Americans for Free Trade campaign rode on the Farmers for Free Trade campaign. The multi-industry coalition consists of over 80 of the US leading trade associations, representing thousands of businesses and workers. It's backed by a multi-million dollar campaign called Tariffs Hurt the Heartland.
The campaign include highlighting opposition to current and new tariffs through:
- Events in congressional districts across the country that bring together farmers, business owners and factory workers to discuss how tariffs are directly hurting them;
- Paid TV, radio and online advertisements highlighting how tariffs are affecting families, farmers, factory workers and businesses of all sizes;
- A rapid response "war room" that will fact check and respond to tariff announcements;
- Op-eds, blogs and statements from Americans bearing the brunt of tariffs;
- A digital media campaign explaining the economic harm of tariffs to a wide online audience; and
- Direct outreach to key members of Congress on behalf of grassroots voices from across the nation.
And it will kick off with events in Chicago, Nashville, Pennsylvania and Ohio.
Here are some links for your reference:
- Americans for Free Trade and the news release on September 12.
- Tariffs Hurt the Heartland and the interactive map that highlights the damages of the tariffs.
- Farmers for Free Trade with farmer's videos
EUR/USD Weekly Outlook
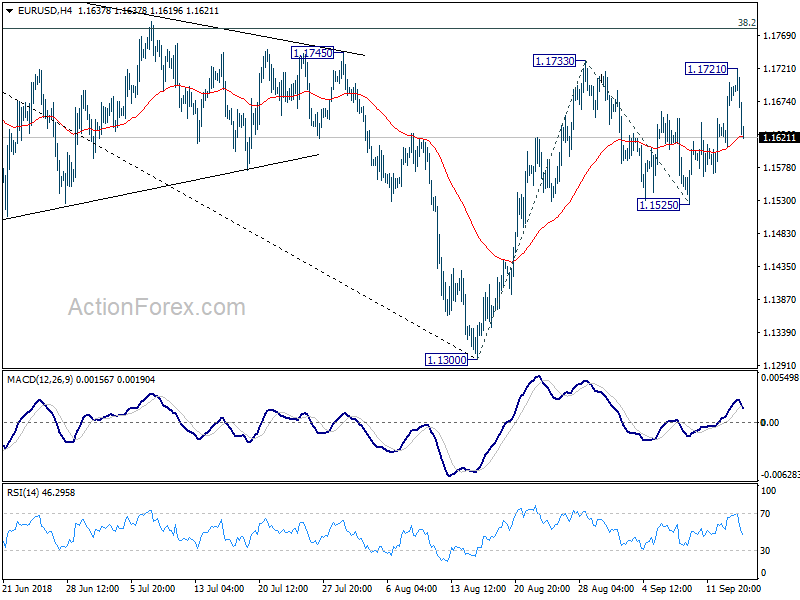
EUR/USD rebounded to 1.1721 last week but failed to take out 1.1733 resistance and retreated sharply. Initial bias is neutral this week first. Rebound from 1.1300 could extend higher. But we'd expect strong resistance from 38.2% retracement of 1.2555 to 1.1300 at 1.1779 to limit upside, at least on first attempt, to bring near term reversal. On the downside, break of 1.1525 support will indicate completion of this corrective rebound. Retest of 1.1300 low should then be seen. However, firm break of 1.1779 will extend the rise to 100% projection of 1.1300 to 1.1733 from 1.1525 at 1.1958.
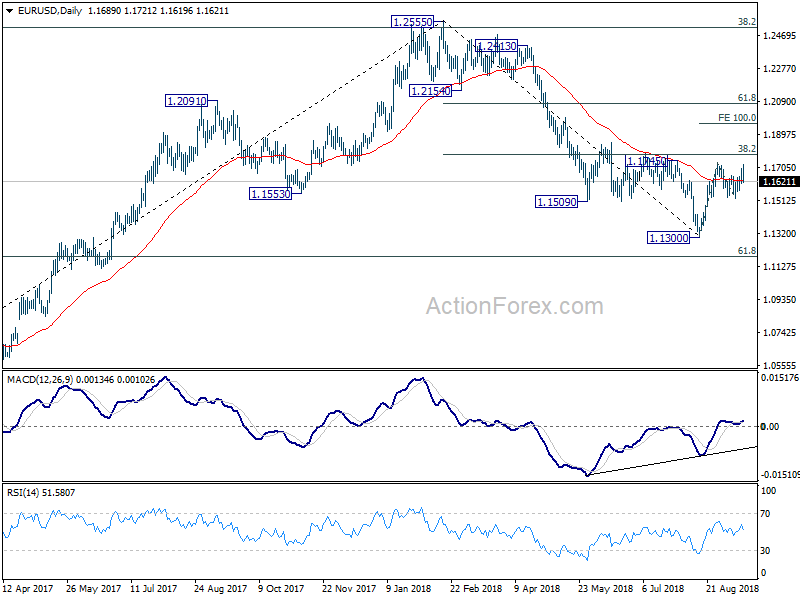
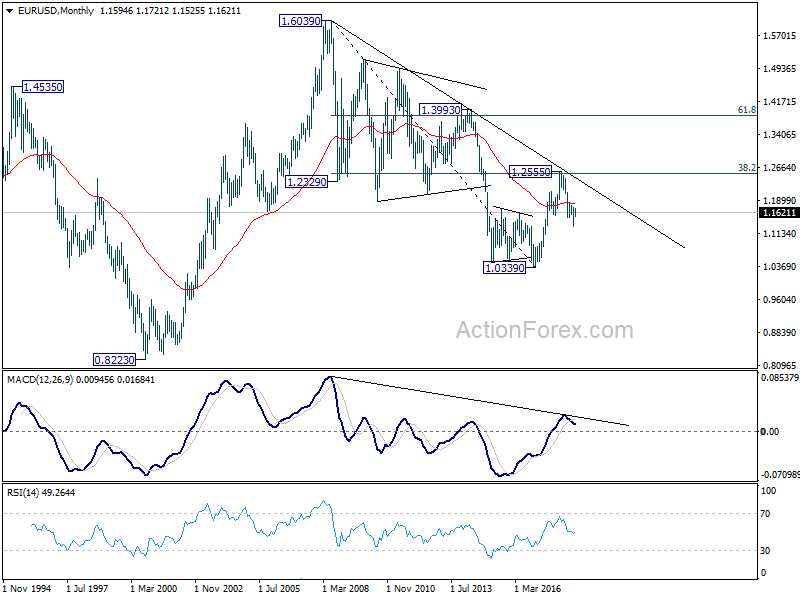
In the bigger picture, a medium term bottom should be in place at 1.1300, on bullish convergence condition in daily MACD and some consolidations would be seen. But still, note that EUR/USD was rejected by 38.2% retracement of 1.6039 (2008 high) to 1.0339 (2017 low) at 1.2516. That carries some long term bearish implications. Thus, we'd expect fall from 1.2555 high to resume after consolidation completes. Below 1.1300 should send EUR/USD through 61.8% retracement of 1.0339 to 1.2555 at 1.1186. And, in that case, EUR/USD would head to retest 1.0339 (2017 low).
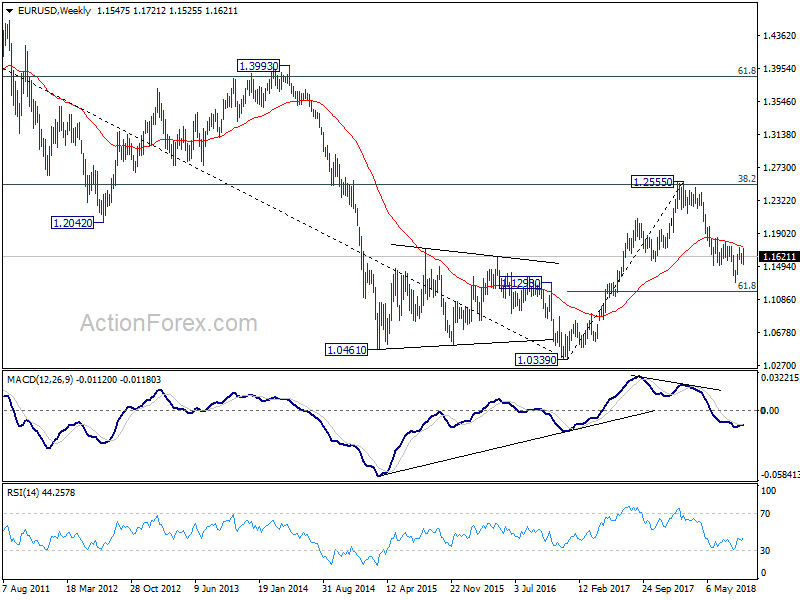
In the long term picture, the rejection from 38.2% retracement of 1.6039 to 1.0339 at 1.2516 argues that long term down trend from 1.6039 (2008 high) might not be over yet. EUR/USD is also held below decade long trend line resistance. Sustained trading below 55 week EMA adds bearishness to the case. Firm break of 61.8% retracement of 1.0339 to 1.2555 at 1.1186 should at least bring a retest on 1.0339 low.
USD/JPY Weekly Outlook
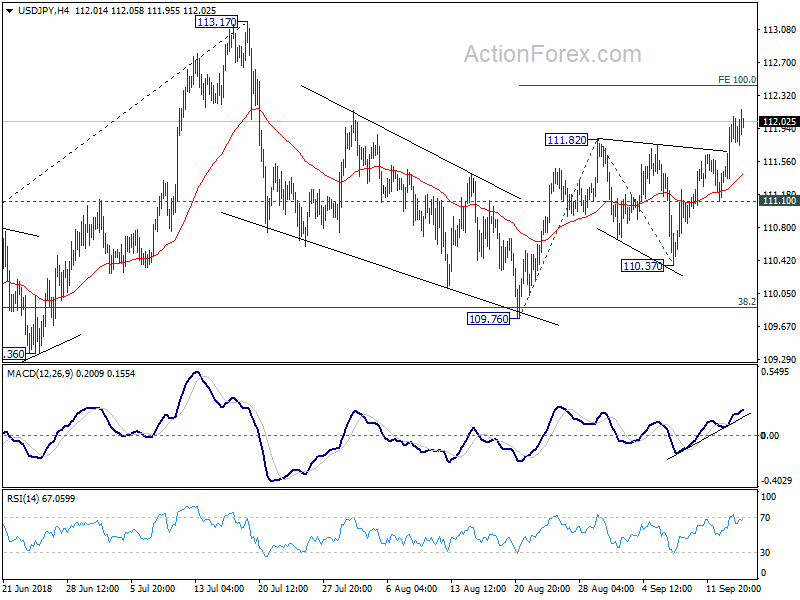
USD/JPY's rebound from 109.76 resumed last week to as high as 112.16. Initial bias remains on the upside this week for 100% projection of 109.76 to 111.82 from 110.37 at 112.43 first. Break will target a test on 113.17 high. On the downside, break of 111.10 minor support is needed to signal completion of the rebound. Otherwise, near term outlook is cautiously bullish in case of retreat.
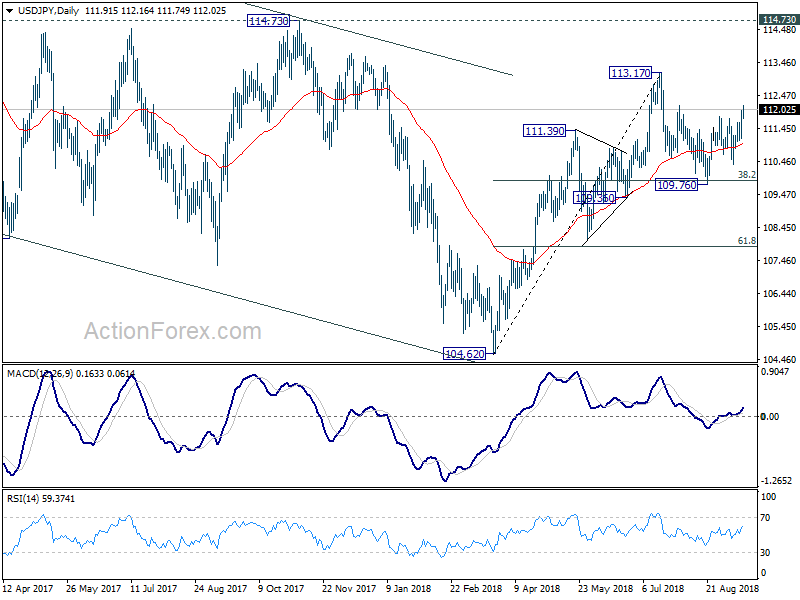
In the bigger picture, corrective fall from 118.65 (2016 high) should have completed with three waves down to 104.62. Decisive break of 114.73 resistance will likely resume whole rally from 98.97 (2016 low) to 100% projection of 98.97 to 118.65 from 104.62 at 124.30, which is reasonably close to 125.85 (2015 high). This will stay as the preferred case as long as 109.36 support holds. However, decisive break of 109.36 will mix up the outlook again. And deeper fall should be seen back to 61.8% retracement of 104.62 to 113.17 at 107.88 and below.
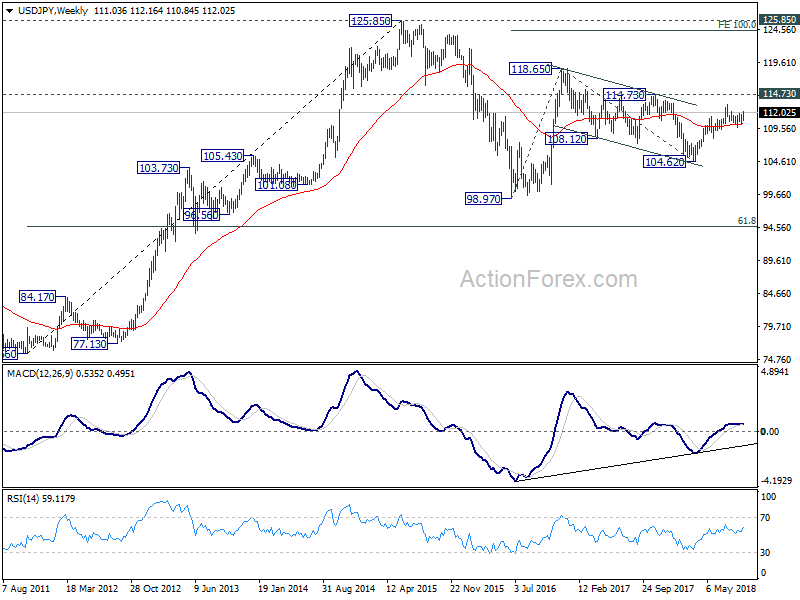
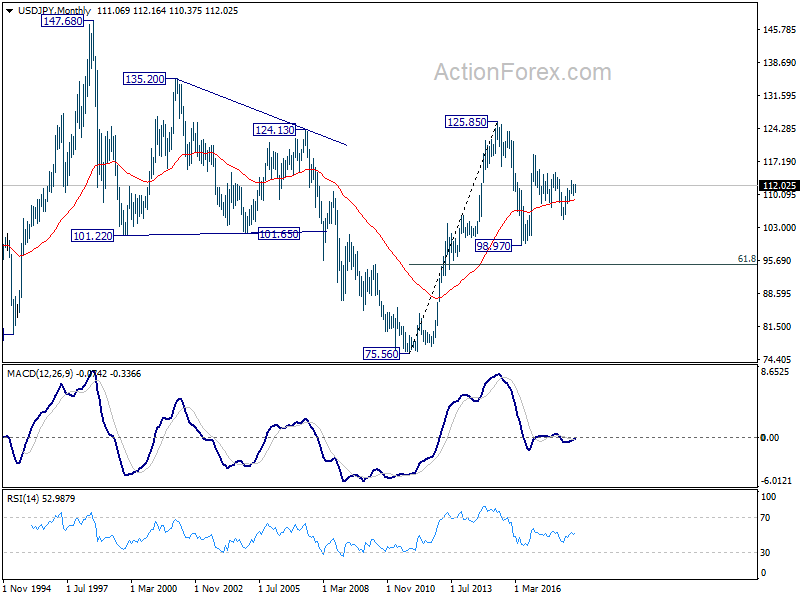
In the long term picture, the rise from 75.56 (2011 low) long term bottom to 125.85 top is viewed as an impulsive move, no change in this view. Price actions from 125.85 are seen as a corrective move which could still extend. In case of deeper fall, downside should be contained by 61.8% retracement of 75.56 to 125.85 at 94.77. Up trend from 75.56 is expected to resume at a later stage for above 135.20/147.68 resistance zone.
GBP/USD Weekly Outlook
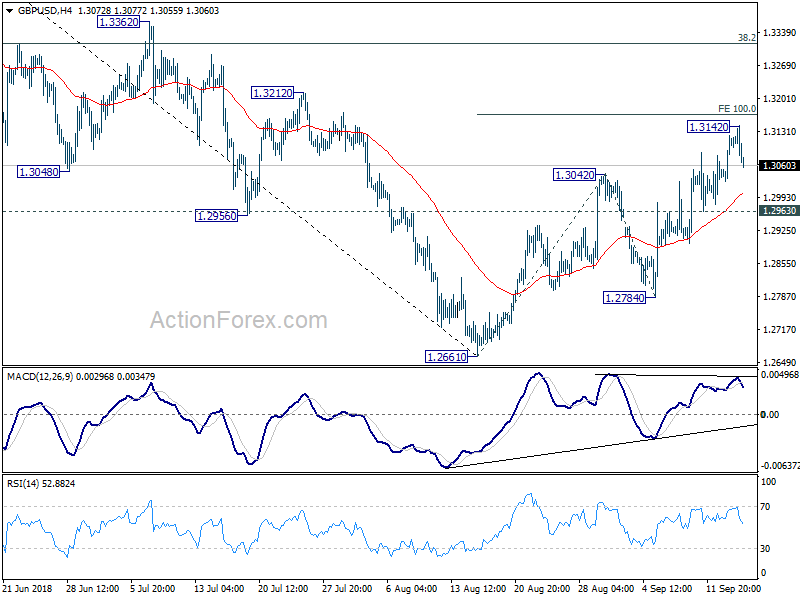
GBP/USD's rebound from 1.2661 extended to as high as 1.3142 last week but formed a temporary top there. Initial bias is neutral this week. Further rise could still be seen for 100% projection of 1.2661 to 1.3042 from 1.2784 at 1.3165 and above. However, as rise from 1.2661 is seen as a corrective move, upside should be limited by 1.3316 key fibonacci level to bring near term reversal. On the downside, break of 1.2963 minor support will now argue that rebound from 1.2661 has completed. In such case, intraday bias will be turned back to the downside for 1.2784 and then 1.2661.
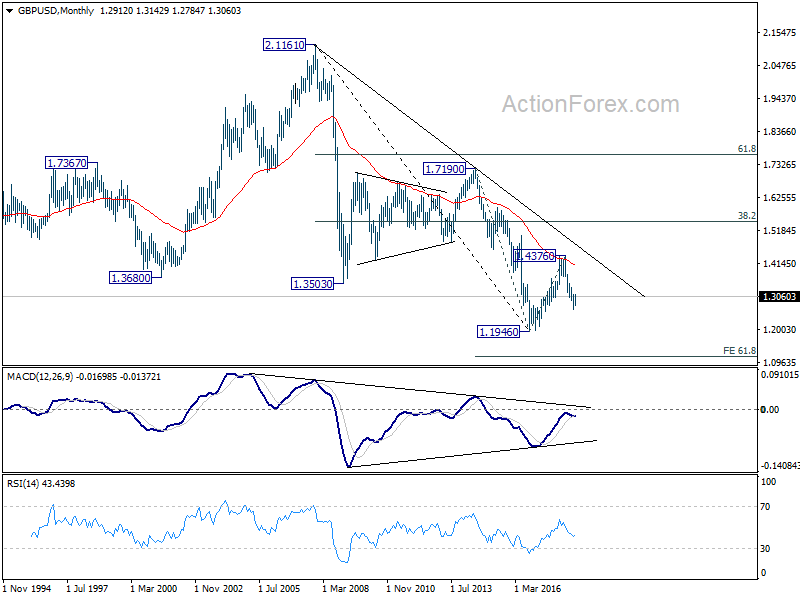
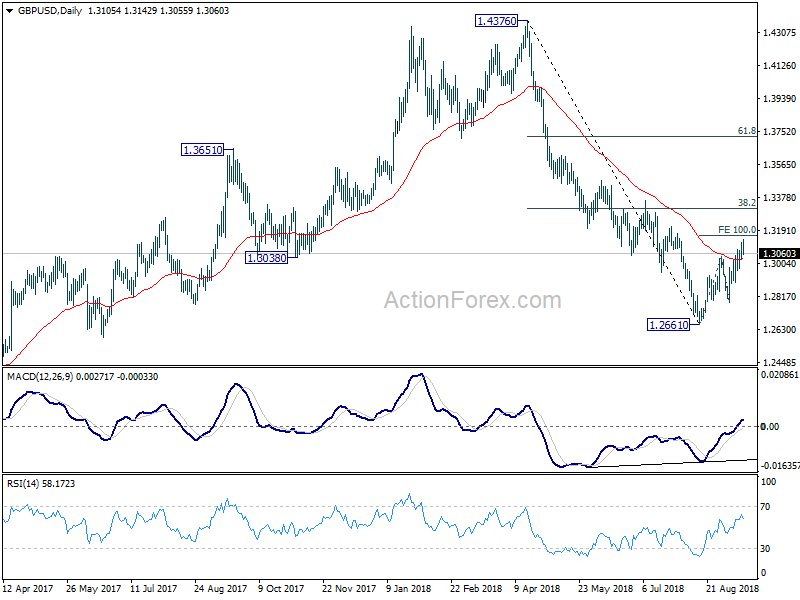
In the bigger picture, whole medium term rebound from 1.1946 (2016 low) should have completed at 1.4376 already, after rejection from 55 month EMA (now at 1.4062). The structure and momentum of the fall from 1.4376 argues that it's resuming long term down trend. And this will be the preferred case as long as 38.2% retracement of 1.4376 to 1.2661 at 1.3316 holds. However, firm break of 1.3316 would bring stronger rebound to 61.8% retracement at 1.3721. And, the eventual depth of the fall from 1.4376, and the chance of hitting 1.1946 low, will depend on the strength of the interim corrective rebound from 1.2661.
In the longer term picture, outlook in GBP/USD is held bearish. Rebound from 1.1946 was rejected solidly by falling 55 month EMA. The pair was limited well below 38.2% retracement of 2.1161 (2007 high) to 1.1946, as well as the decade long falling trend line. On break of 1.1946, next target will be 61.8% projection of 1.7190 to 1.1946 from 1.4376 at 1.1135.