Sample Category Title
USD/CAD Daily Outlook
Daily Pivots: (S1) 1.2992; (P) 1.3024; (R1) 1.3066; More...
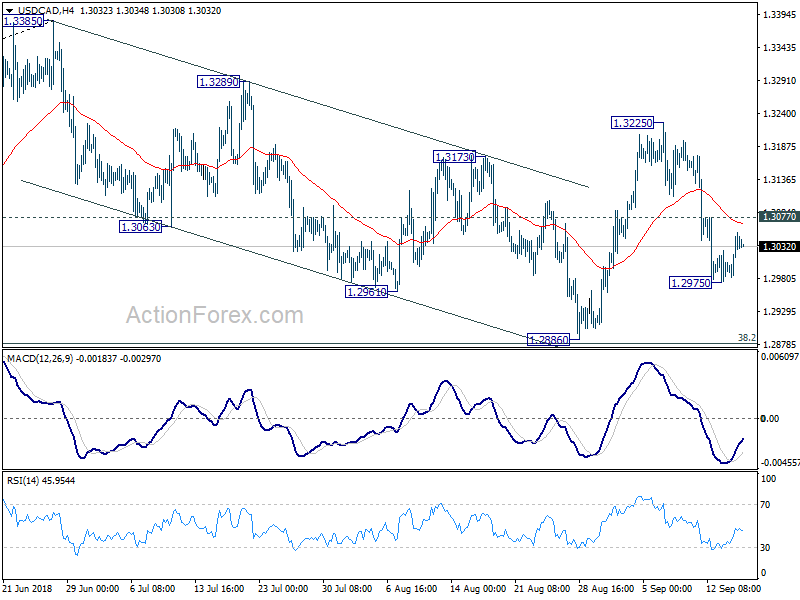
Intraday bias in USD/CAD remains neutral at this point. We're holding on to the view that corrective fall from 1.3385 has completed at 1.2886 already. On the upside, above 1.3077 minor resistance will turn bias back to the upside for 1.3225 resistance first. Break will reaffirm our bullish view and target 1.3385 high. On the downside, in case of another fall, downside should be contained above 1.2886 to bring rebound.
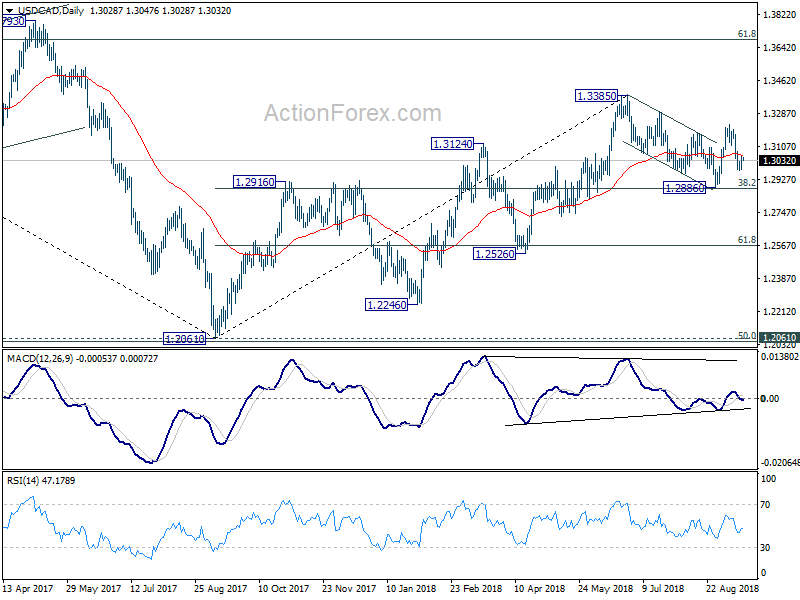
In the bigger picture, strong rebound ahead of 38.2% retracement of 1.2061 to 1.3385 at 1.2879 key fibonacci level retains medium term bullishness. That is, rise from 2017 low at 1.2061 is still in progress. Break of 1.3384 should target 61.8% retracement of 1.4689 (2015 high) to 1.2061 (2017 low) at 1.3685. On the downside, as long as 1.2886 support holds, outlook will now remain bullish.
USD/CHF Daily Outlook
Daily Pivots: (S1) 0.9647; (P) 0.9662; (R1) 0.9689; More.....
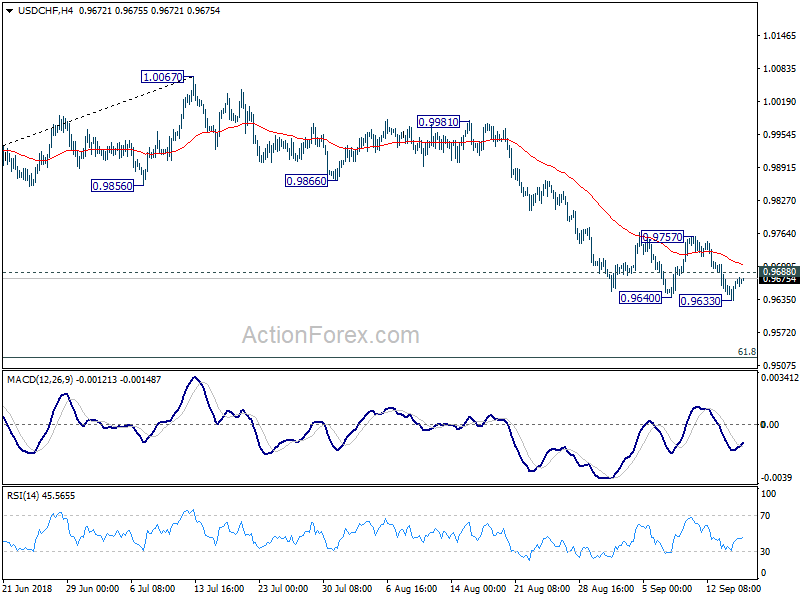
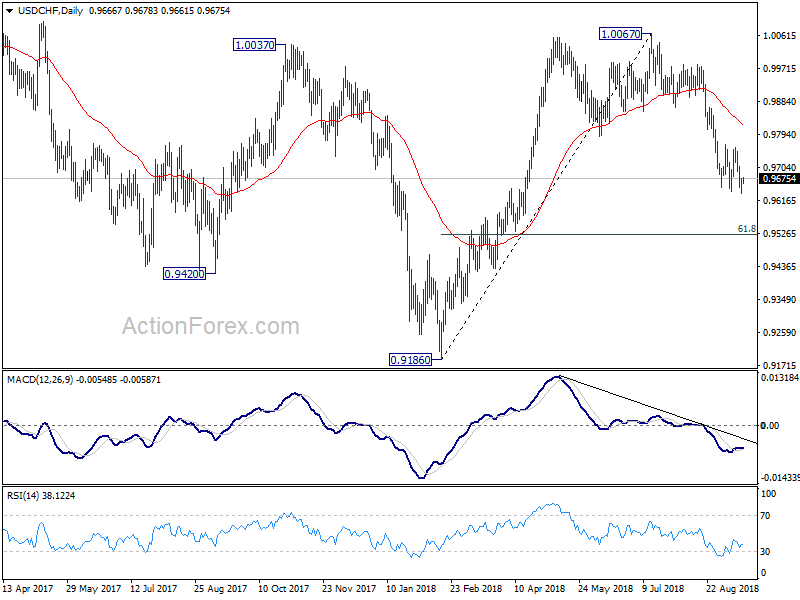
As long as 0.9688 minor resistance holds, deeper decline is expected in USD/CHF. Break of 0.9633 will resume whole decline from 1.0067 and target 0.9523 fibonacci level next. On the upside, above 0.9688 minor resistance will dampen this bearish case and target 0.9757 resistance. Break of 0.9757 resistance will indicate near term reversal and bring stronger rebound back to 0.9866 support turned resistance for confirmation.
In the bigger picture, rise from 0.9186 low has completed at 1.0067, after failing to sustain above 1.0037 resistance. Fall from 1.0067 could extend to 61.8% retracement of 0.9816 to 1.0067 at 0.9523 and below. But for now, we don't expect a break of 0.9186 low. On the upside, firm break of 0.9866 support turned resistance will suggests that fall from 1.0067 has completed and rise from 0.9186 is resuming.
EUR/USD Daily Outlook
Daily Pivots: (S1) 1.1588; (P) 1.1656; (R1) 1.1690; More.....
Intraday bias in EUR/USD remains neutral first. At this point, rebound from 1.1300 could still extend through 1.1733 resistance. But we'd expect strong resistance from 38.2% retracement of 1.2555 to 1.1300 at 1.1779 to limit upside, at least on first attempt, to bring near term reversal. On the downside, break of 1.1525 support will indicate completion of this corrective rebound. Retest of 1.1300 low should then be seen. However, firm break of 1.1779 will extend the rise to 100% projection of 1.1300 to 1.1733 from 1.1525 at 1.1958.
In the bigger picture, a medium term bottom should be in place at 1.1300, on bullish convergence condition in daily MACD and some consolidations would be seen. But still, note that EUR/USD was rejected by 38.2% retracement of 1.6039 (2008 high) to 1.0339 (2017 low) at 1.2516. That carries some long term bearish implications. Thus, we'd expect fall from 1.2555 high to resume after consolidation completes. Below 1.1300 should send EUR/USD through 61.8% retracement of 1.0339 to 1.2555 at 1.1186. And, in that case, EUR/USD would head to retest 1.0339 (2017 low).
GBP/USD Daily Outlook
Daily Pivots: (S1) 1.3037; (P) 1.3088; (R1) 1.3120; More...
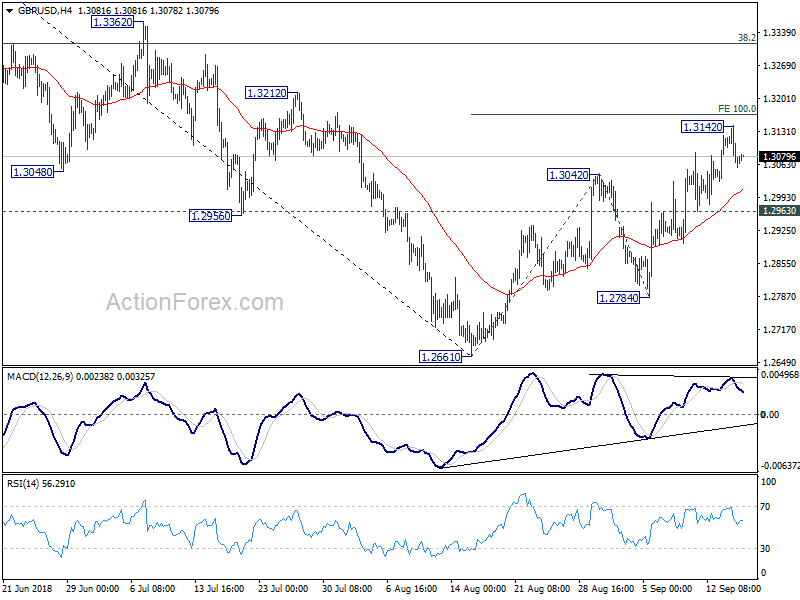
Intraday bias in GBP/USD remains neutral at this point. As long as 1.2963 minor support holds, rebound from 1.2662 could extend higher to 100% projection of 1.2661 to 1.3042 from 1.2784 at 1.3165 and above. However, as rise from 1.2661 is seen as a corrective move, upside should be limited by 1.3316 key fibonacci level to bring near term reversal. On the downside, break of 1.2963 minor support will now argue that rebound from 1.2661 has completed. In such case, intraday bias will be turned back to the downside for 1.2784 and then 1.2661.
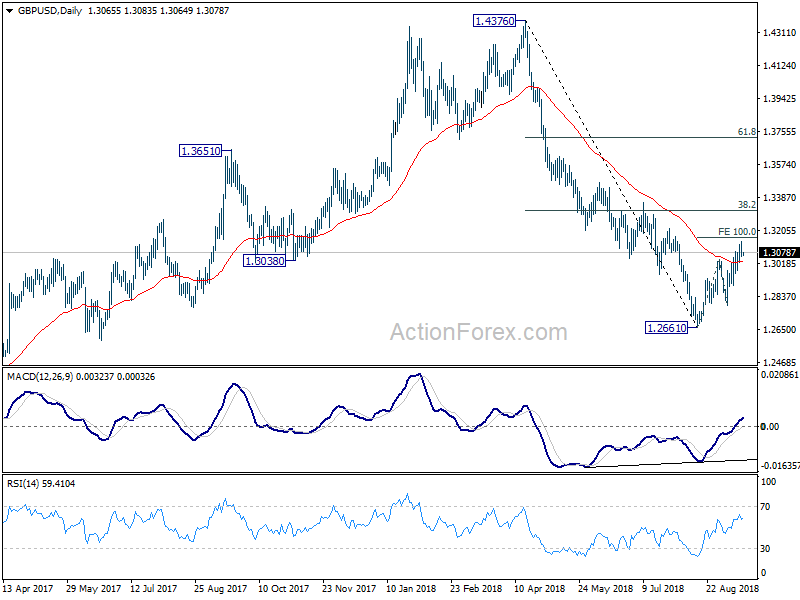
In the bigger picture, whole medium term rebound from 1.1946 (2016 low) should have completed at 1.4376 already, after rejection from 55 month EMA (now at 1.4062). The structure and momentum of the fall from 1.4376 argues that it's resuming long term down trend. And this will be the preferred case as long as 38.2% retracement of 1.4376 to 1.2661 at 1.3316 holds. However, firm break of 1.3316 would bring stronger rebound to 61.8% retracement at 1.3721. And, the eventual depth of the fall from 1.4376, and the chance of hitting 1.1946 low, will depend on the strength of the interim corrective rebound from 1.2661.
USD/JPY Daily Outlook
Daily Pivots: (S1) 111.82; (P) 112.00; (R1) 112.24; More...
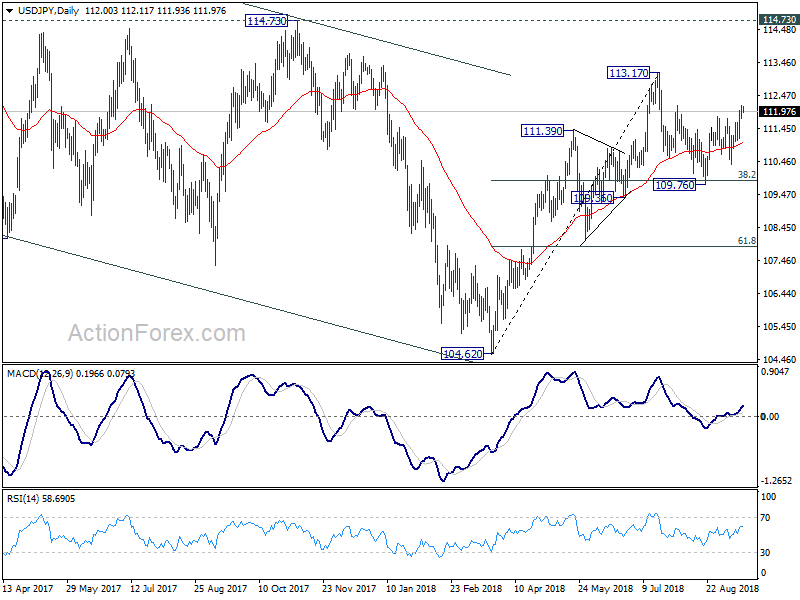
Intraday bias in USD/JPY remains on the upside at this point. Current rebound from 109.76 is in progress for 100% projection of 109.76 to 111.82 from 110.37 at 112.43 first. Break will target a test on 113.17 high. On the downside, break of 111.10 minor support is needed to signal completion of the rebound. Otherwise, near term outlook is cautiously bullish in case of retreat.
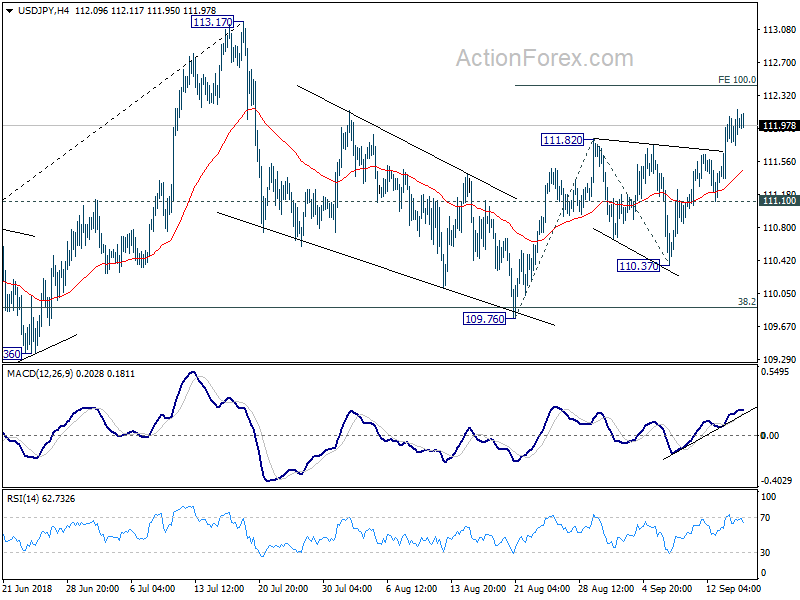
In the bigger picture, corrective fall from 118.65 (2016 high) should have completed with three waves down to 104.62. Decisive break of 114.73 resistance will likely resume whole rally from 98.97 (2016 low) to 100% projection of 98.97 to 118.65 from 104.62 at 124.30, which is reasonably close to 125.85 (2015 high). This will stay as the preferred case as long as 109.36 support holds. However, decisive break of 109.36 will mix up the outlook again. And deeper fall should be seen back to 61.8% retracement of 104.62 to 113.17 at 107.88 and below.
Forex Markets Range Bound Despite Risk of US-China Trade War Escalation
The forex markets are trading steadily today, as another week starts as usual. Major pairs and crosses are so far still bounded in Friday's range. It seems that traders took the news regarding escalation in US-China trade war rather lightly. Or, it's actually widely expected that no matter his colleagues say, Trump is going to march on with tariffs war. For now, New Zealand Dollar is the strongest one, followed by Euro and then Yen. Canadian Dollar is the weakest, followed by Dollar and then Swiss Franc. But this picture could easily change, and drastically, as volatility kicks in.
In other markets, Asian markets are generally lower, with exception of Nikkei which is on holiday. Singapore Strait Times is down -0.65%, Hong Kong HSI is down -1.58% at the time of writing. China Shanghai SSE is losing -1.06% at 2653.15. Last week's low at 2647.17 is a level SSE would challenge soon. But the key level lies in 2638.30, 2016 low. Gold is bounded in tight range at around 1195. As long as 1187.58 support holds, recent rebound from 1160.36 is still in favor to extend through 1214.30 at a later stage.
Technically, the key development to watch is whether Dollar would extend Friday's rebound to build up some momentum. EUR/USD is in the middle of range of 1.1525/1733. AUD/USD is inside 0.7084/7228. USD/CHF is inside 0.9633/9757. For now, it's hard to tell which side Dollar would take on first.
Trump to announce new tariffs on China as soon as Monday
Over the weekend, Reuters reported that, based on unnamed source, Trump is ready to announce the next round of tariffs on USD 200B in Chinese goods, as soon as on Monday. However, the tariff rate could be at 10%, which is much lower than the 25% rate Trump intended to impose. There is no comment from the White House on the news yet. At the same time, Treasury Secretary Steven Mnuchin is restarting trade talks with China, involving Vice Premier Liu He, possibly on around September 20.
The WSJ reported that Chinese government may reject to re-start trade talks with the US if Trump imposes new tariffs. An unnamed Chinese official was quoted saying the country would not negotiation "with a gun pointed to its head". In addition, other unnamed officials said China could impose export restraints on some supplies needed by US businesses, to disrupt their supply chain.
It doesn't matter if the new round of tariffs are imposed before or after the meeting. As long as they are imposed, anything agreed during the meeting will not take effect for sure.
Separately, the PBoC surprisingly injected CNY 265B in liquidity to the markets via its one-year medium-term lending facility (MLF) today. Interest rate was unchanged at 3.30%. It's an unexpected move because no MLF loans were due to expire today.
BCC downgraded UK growth forecasts, economy to grow at a snail's pace
The British Chambers of Commerce downgraded UK growth forecasts, citing "weaker outlook for trade and investment" as main reasons. Key points in the new forecasts:
- 2018 GDP growth at 1.1%, down from 1.3%. 2019 GDP growth at 1.3%, down from 1.4%. 2020 GDP growth at 1.6%, unchanged.
- 2018 exports growth at 1.7% only, down from 2.8% in prior forecast.
- 2018 total investment growth at 1.4%, down from 1.8%. 2019 at 1.4% and 2020 at 1.5%.
- BoE expected to hike in Q1 2019 and Q2 2020. Bank rate to hit 1.25% by the end of the forecast period.
Adam Marshall, Director General of the BCC said that the UK economy as a whole is set to grow at a "snail's pace". Brexit uncertainty "continues to weigh heavily on many firms" as "most of the practical questions" remained unanswered. And, the "lack of precision" of future relationship with the EU "is lowering expectations for both business investment and export growth." He also warned that "the drag effect on investment and trade would intensify in the event of a 'messy' and disorderly Brexit".
Looking ahead - BoJ and SNB to stand pat
Two central bank meetings will be featured this week, BoJ and SNB. Both are expected to keep policy unchanged. In particular, recent surge in the Swiss Franc highlighted that the markets are still vulnerable to different risks, emerging markets this time. There is no room for complacency for SNB. RBA minutes will also be watched but they shouldn't do anything to alter RBA's neutral stance. There is no urgency for RBA to make any rate move in the near term, even though the next move will be a hike.
There are also some important economic data featured in the week. UK CPI and retail sales, Canada CPI and retail sales, Japan CPI, Eurozone PMIs and New Zealand GDP will be watched.
Here are some highlights for the week:
- Monday: Eurozone CPI final; Canada foreign securities purchases; US Empire State manufacturing index
- Tuesday: RBA minutes, Australia house price index; Canada manufacturing sales; US NAHB housing index
- Wednesday: Japan trade balance, BoJ rate decision; Swiss SECO economic forecasts; Eurozone current account; UK CPI, PPI, house price index; US new residential construction, current account
- Thursday: New Zealand GDP; Swiss trade balance, SNB rate decision; UK retail sales; US Philly Fed survey, jobless claims, leading indicator, existing home sales
- Friday: Japan CPI, PMI manufacturing, all industry index; Eurozone PMIs; UK public sector net borrowing; Canada CPI, retail sales; US PMIs
USD/JPY Daily Outlook
Daily Pivots: (S1) 111.82; (P) 112.00; (R1) 112.24; More...
Intraday bias in USD/JPY remains on the upside at this point. Current rebound from 109.76 is in progress for 100% projection of 109.76 to 111.82 from 110.37 at 112.43 first. Break will target a test on 113.17 high. On the downside, break of 111.10 minor support is needed to signal completion of the rebound. Otherwise, near term outlook is cautiously bullish in case of retreat.
In the bigger picture, corrective fall from 118.65 (2016 high) should have completed with three waves down to 104.62. Decisive break of 114.73 resistance will likely resume whole rally from 98.97 (2016 low) to 100% projection of 98.97 to 118.65 from 104.62 at 124.30, which is reasonably close to 125.85 (2015 high). This will stay as the preferred case as long as 109.36 support holds. However, decisive break of 109.36 will mix up the outlook again. And deeper fall should be seen back to 61.8% retracement of 104.62 to 113.17 at 107.88 and below.
Economic Indicators Update
| GMT | Ccy | Events | Actual | Forecast | Previous | Revised |
|---|---|---|---|---|---|---|
| 23:01 | GBP | Rightmove House Prices M/M Sep | 0.70% | -2.30% | ||
| 9:00 | EUR | Eurozone CPI M/M Aug | -0.30% | -0.30% | ||
| 9:00 | EUR | Eurozone CPI Y/Y Aug F | 2.10% | 2.10% | ||
| 9:00 | EUR | Eurozone CPI Core Y/Y Aug F | 1.00% | 1.00% | ||
| 12:30 | CAD | International Securities Transactions (CAD) Jul | 4.35B | 11.55B | ||
| 12:30 | USD | Empire State Manufacturing Index Sep | 23.2 | 25.6 |
Market Morning Briefing: Aussie Has Immediate Support On Daily Candles Near 0.714
STOCKS
Dow (26154.67, +0.033%) is slowly inching up and could test 26500 on the upside. A break above 26500 thereafter would turn bullish on the medium term movement taking the index to higher levels of 27000.
Dax (12124.33, +0.57%) is headed towards 12300 in the near term from where another dip back towards 11900-11700 could be expected. Unless a sharp break above 12300 is seen, the index could trade within the broad 11700-12300 region.
Nikkei (23094.67, +1.20%) has broken above 23000 for the first time in the last few attempts made since May’18. If the index is able to sustain above 23000 this time, it could rally towards 24000 on the upside, testing previous high of Jan’18. While the index is above 23000, it looks bullish and could pull up Dollar-Yen in the near term.
Shanghai (2662.75, -0.70%) is currently trading below the immediate resistance at 2700. Movement in the past few sessions have been very narrow in the small range of 2650-2700 and the range could continue for the next 1-2 sessions before a sharp move on either side is seen. Note both 2650 and 2700 are important near term support and resistance levels.
Nifty (11515.20, +1.28%) saw a sharp gap up opening on Friday and closed above 11400. Now, while the rise sustains, the index could head higher towards 11600-11800 in the near to medium term.
COMMODITIES
Brent (78.08) now has support at 78 and while that holds, can move up towards important resistance near 80-81 before coming off from there. A fall below 78 could take it to lower support near 76.70.
WTI (68.96) has equal scope of moving up towards 70-71 or coming off to test 66 on the downside. Trading at the middle of this 66-71 range, WTI could spend some time whipsawing in the mentioned range. Weekly candles suggest bullishness for the medium term.
The Brent-WTI spread (9.31) has come off from 9.71 seen on Friday. While the spread comes off towards 8, Crude prices could see a decent dip in the near term.
Gold (1199.40, -0.14%) and Copper (2.6245) have again dipped after seeing some upward movement last week. Gold is likely to remain in the 1190-1210 region for now while Copper could trade in the 2.60-2.70 region. Although the two metals make attempts to move up, they are unable to sustain sharp rise at the moment. Some more of ranged sessions looks possible in the near term. If daily resistance on Gold near 1220 holds, it could come off towards 1190 or even lower in the near term.
FOREX
Watch out for crucial resistance @ 95.0-95.2 on Dollar Index, support @ 1.16 on Euro and support near 1.305 on Pound. Meanwhile USDINR looks oversold – but the RBI and the government should prevent another rise past 72.20-50.
Euro (1.1631) has immediate Support near 1.16 on daily candles. While above 1.16, the chances of a breach of resistance near 1.17 remain high - a breach could lead to 1.18 quickly.
Dollar Index (94.92) has resistance near 95.0-95.2, which is likely to push it down towards 94.5-94.0 in this week. A breach above 95.2 is less preferred currently.
Dollar Yen (111.99): After having breached resistance near 111.5 on 3 day candles last week, Dollar Yen is looking bullish towards resistance on weekly candles near 112.5.
Euro Yen (130.27) is trading below resistance on weekly candles near 131 but could find support near 130 (on daily line chart). In the near term, a rise beyond 1.17 and 112.17 on Euro and Dollar-Yen respectively (as forecasted above) would make Euro Yen breach the resistance near 131.
Pound (1.3079) is staying below the 21 weeks MA (1.3172) on weekly line chart. A break below 1.305 could again bring in some bearishness.
Aussie (0.7155) has immediate support on daily candles near 0.714, which if broken could again take it down towards 0.708-0.707 – long term support level on weekly line chart. A week close above 0.72 could establish 0.7085 (tested last week) as the bottom.
Dollar Rupee (71.85) Over to the RBI-Government team now. Need to ensure that the market does not rise past 72.20-50. Ideally push it below 71.60 by Day Close. BUT, they will be fighting against an Oversold market.
INTEREST RATES
Last week, the ECB had maintained status quo in its policy. But, Draghi's optimism on the inflation trajectory has made the markets start expecting a rate hike in Sep 2019. Hence, inspite of the dovish policy and reduced growth forecasts, German bond yields are rising.
German 10 year yield (0.45%), as per expectation, has risen to 0.45%. If it rises further, then a rise towards 0.58% could also take place quickly.
US Retail Sales data on Friday showed only a moderate month-on-month rise of 0.1% but the July growth figures were revised upwards from 0.5% to 0.7%. This led to further bullishness in US yields.
Earlier, US CPI for August was below expectations with the month on month growth in Headline CPI being 0.2% instead of the expected 0.3%. On the trade war front: Trump might still go ahead with tariffs on $200 bn worth of Chinese imports (in spite of another round of trade talks with China slated to take place).
The Retail Sales data has managed to take the US 10 year yield (3%) to the 3% level once again. As we have been saying, this is a psychologically crucial barrier and the trade war induced risk aversion is likely to bring the yield back below 3% in the near term.
Note that we have also been saying that the previous high of 3.125% might have been the top for the US 10 year yield in 2018
BCC downgraded UK growth forecasts, economy to grow at a snail’s pace
The British Chambers of Commerce downgraded UK growth forecasts, citing "weaker outlook for trade and investment" as main reasons. Key points in the new forecasts:
- 2018 GDP growth at 1.1%, down from 1.3%. 2019 GDP growth at 1.3%, down from 1.4%. 2020 GDP growth at 1.6%, unchanged.
- 2018 exports growth at 1.7% only, down from 2.8% in prior forecast.
- 2018 total investment growth at 1.4%, down from 1.8%. 2019 at 1.4% and 2020 at 1.5%.
- BoE expected to hike in Q1 2019 and Q2 2020. Bank rate to hit 1.25% by the end of the forecast period.
Quote from Dr Adam Marshall, Director General of the British Chambers of Commerce (BCC):
"UK economy as a whole is set to grow at a snail's pace. Brexit uncertainty continues to weigh heavily on many firms, as most of the practical questions facing trading businesses remain unanswered. The lack of precision on the nature of the UK's future relationship with the EU is lowering expectations for both business investment and export growth."
"The drag effect on investment and trade would intensify in the event of a 'messy' and disorderly Brexit"
"A deal with Brussels won't deliver stronger UK growth on its own. The Prime Minister and the Chancellor must now pull out all the stops here at home to bolster business confidence, slash costs, and crowd in investment."
Full release here.
China may reject trade talk if new tariffs are imposed
The WSJ reported that Chinese government may reject to re-start trade talks with the US if Trump imposes new tariffs. An unnamed Chinese official was quoted saying the country would not negotiation "with a gun pointed to its head". In addition, other unnamed officials said China could impose export retraints on some supplies needed by US businesses, to disrupt their supply chain.
The news followed shortly after report that Trump is going to kick start new tariffs (10% rather than 25%) on USD 200B in Chinese imports, as soon as Monday. Last week, Treasury Secretary Steven Mnuchin proposed to have a meeting involving Chinese Vice Premier Liu He on around September 20. It doesn't matter if the new round of tariffs are imposed before or after the meeting. As long as they are imposed, anything agreed during the meeting will not take effect for sure.
Separately, the PBoC surprisingly injected CNY 265B in liquidity to the markets via its one-year medium-term lending facility (MLF) today. Interest rate was unchanged at 3.30%. It's an unexpected move because no MLF loans were due to expire today.
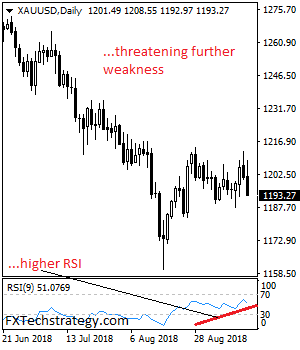
GOLD – Bear Pressure Sets To Target The 1,187.00 Level
GOLD - The commodity continues to target lower prices following its lower close the past week. This has opened the door for more weakness towards the 1,187.00 level. On the downside, support comes in at the 1,180.00 level where a break will turn attention to the 1,170.00 level. Further down, a cut through here will open the door for a move lower towards the 1,160.00 level. Below here if seen could trigger further downside pressure targeting the 1,150.00 level. Conversely, resistance resides at the 1,200.00 level where a break will aim at the 1,210.00 level. A turn above there will expose the 1,220.00 level. Further out, resistance stands at the 1,230.00 level. All in all, GOLD looks to weaken further towards its key support.