Sample Category Title
The Weekly Bottom Line: Rising Rates Eating Into Household Incomes
The Weekly Bottom Line
U.S. Highlights
- Foreign central banks took center stage this week. The Central Bank of Turkey raised its policy rate to 24% from 17.75% in the hope of retaining and attracting new foreign capital.
- The ECB confirmed it will taper its asset purchases to €15 bn a month in October, with the program slated to end this December.
- On the domestic front, data this week confirmed that a robust economic expansion is underway. Labor market conditions are increasingly tilting in favor of workers.
Canadian Highlights
- Housing was in the spotlight this week. Starts declined slightly in August, but the underlying trend remains healthy.
- Slowing mortgage growth helped tame the rise in household-debt to income, but debt servicing costs continue to move higher in line with borrowing costs.
- Little progress was apparent in NAFTA discussions this week, with dairy remaining a key sticking point. Recent trade agreements suggest that Canada may be willing to provide some additional access to satisfy U.S. demands.
U.S. - Labor Market Tilting in Favor of Workers
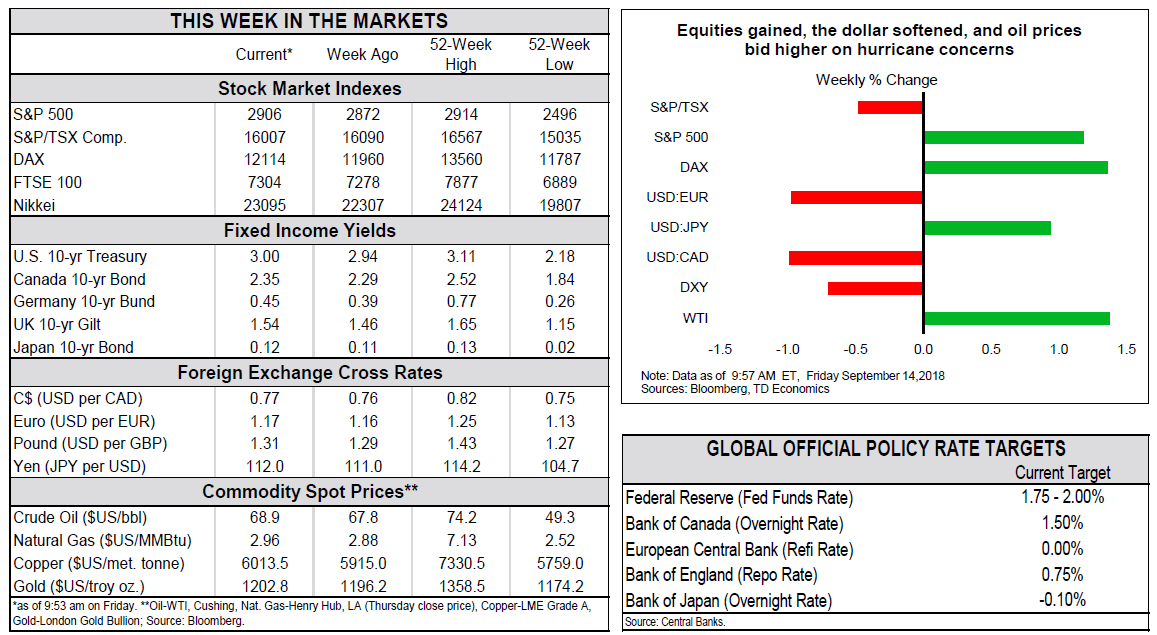
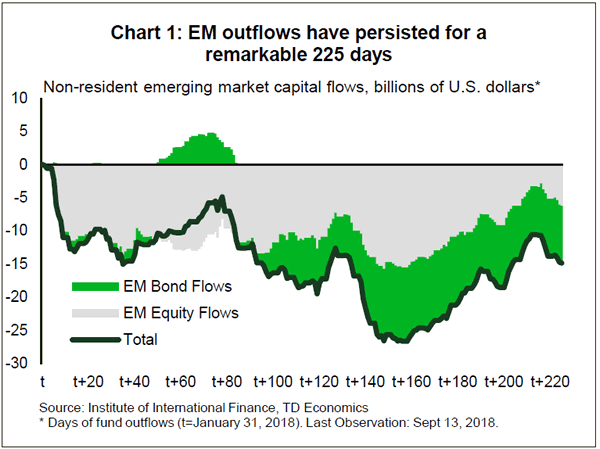
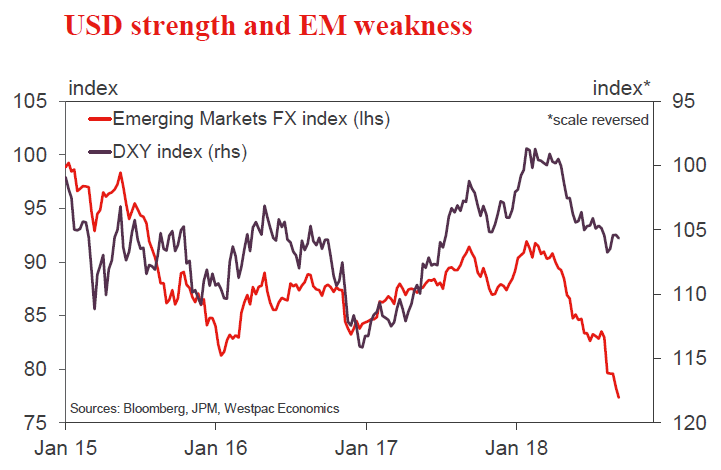
U.S. equities managed to make gains this week, shrugging off turmoil in emerging markets and the threat of additional tariffs. Meanwhile, the selloff and pressure on emerging market currencies eased a bit, and the U.S. dollar softened a touch as foreign central bankers took center stage (Chart 1).
First up was the central bank of Turkey. It hiked its policy rate to 24% from 17.75% in the hope of retaining and attracting new foreign capital. The lira rallied, but still remains down 38% relative to the U.S. dollar since the end of January. Further rate hikes may yet be needed to help facilitate the rebalancing of Turkey's economy, weaning it off from its reliance on foreign financing. But, these are likely to be resisted by President Erdogan, suggesting that Turkey may be unable to avoid the economic cost of high inflation and capital flight.
In neighboring Europe, both the Bank of England (BoE) and the European Central Bank (ECB) held monetary policy unchanged this week. With Brexit looming, the BoE is likely to hold interest rates at 0.75% until May. We anticipate a withdrawal agreement with the EU to be signed by year end, but there is still a small chance that the UK could make a chaotic exit from the EU next March. Such an event would prove detrimental to the UK economy, highlighted in recent discussions between Governor Carney and the UK government. Easy monetary policy would be unable to mitigate the economic damage from the negative supply shock that would result. Nor would it be able to offset the real income and spending drag resulting from a surge in inflation.
As largely anticipated, the ECB confirmed that it will taper its asset purchases to €15bn a month starting in October, with the program slated to end this December. Moreover, it signaled that, so long as risks to the economic outlook remain broadly in balance, interest rates may rise as early as September 2019. While the outlook for growth and inflation was revised down a touch, markets reacted positively to the ECB's conviction that core inflation will near 2.0% by 2020, spurring a bid for the euro.
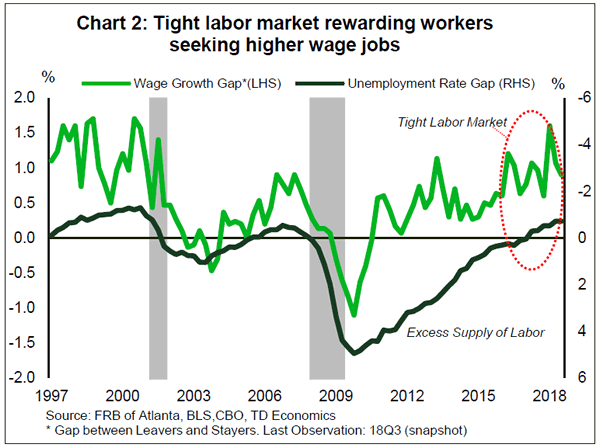
On the domestic front, data this week confirmed that a robust economic expansion is underway. Small businesses remained jubilant even as labor shortages and tariffs start to bite. The tightness of the labor market was underscored by July's JOLTs data that recorded an uptick in the quits rate. Workers are increasingly being rewarded for quitting their current jobs for higher paying ones (Chart 2). Rising wages should continue to stoke prices pressures in the months ahead. That said, August inflation softened a touch to 2.7% (y/y), but we don't view this as lasting given rising business cost pressures. Lastly, retail sales disappointed in August, but consumer spending is expected to remain healthy this quarter, buoyed by gains in wages and jobs. All told, the data this week suggest that this expansion has more room to run.
Canada - Rising Rates Eating Into Household Incomes
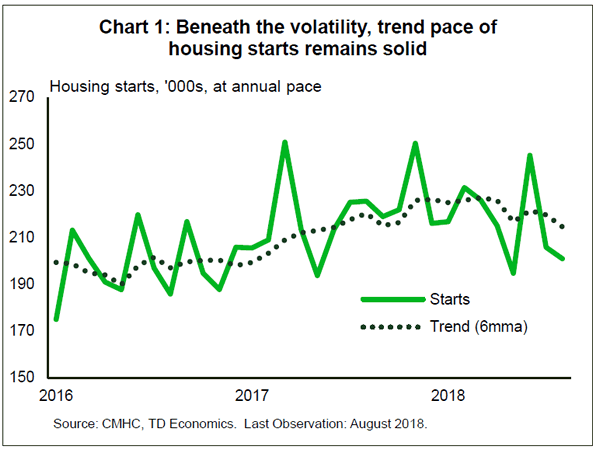
The major economic data this week was by and large housing focused. Housing starts disappointed expectations, dipping to a 201k annualized pace in August (from 205k in July). This tends to be a volatile series, and as it stands, there is little to be concerned about in the recent data. The modest slowing in the summer months comes after a robust June figure, and the trend remains comfortably above the 200k mark we associate with demographic fundamentals (Chart 1). Indeed, it remains the case that the trend is likely to drift back towards this anchor with time. With permit issuance still solid, there is little cause for alarm.
Statistics Canada also gave us an updated snapshot of Canadian household finances. The picture is pretty much what you'd expect. The closely watched measure of household debt to income rose to 169.1% (i.e. $1.69 owing for each dollar of disposable income). Reported on a non-seasonally adjusted basis, this ratio has risen in Q2 every year it has been published, but it is noteworthy that this year's increase was the smallest since the year 2000. This moderation is likely a reflection of softer mortgage borrowing activity post B-20 implementation. With home sales already coming back late in the quarter, and further increases expected in the August data (watch for our commentary Monday), this respite may prove short-lived.
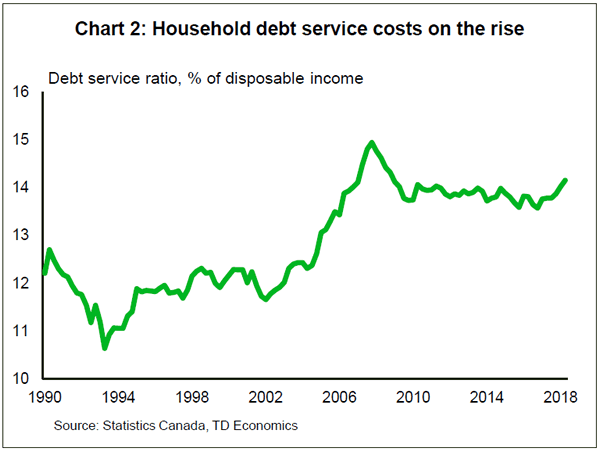
Of course, rising borrowing costs should act as a countervailing force as we move further through the year and into next. Elevated debt levels have left households more sensitive to rising interest rates than in the past. Evidence of this can already be seen in the household debt service ratio (Chart 2). The cost of servicing debt hit 14.2% of disposable income in Q2. This is a 0.4 percentage point increase over just 3 quarters, as the Bank of Canada raised its policy interest rate three times (75 basis points). July's rate hike is not captured in this data, and with another likely to come in October, borrowing costs appear set to eat up a growing share of household income in coming years.
Finally, away from the data, there were mixed messages this week on the NAFTA front. Progress does appear to be continuing, but one clear point of contention is U.S. access to Canadian markets for dairy and other protected products. The good news is that there is recent precedent suggesting that Canada could yield some ground in this area, perhaps using it as a bargaining chip to achieve other goals. Both the TPP and CETA trade deals included at least some opening up of Canadian markets to foreign competition, indicating that there is scope for agreement as part of a broader deal. Of course, there also remains the issue of dispute resolution, another sticking point for Canadian negotiators. With two more weeks of negotiations remaining before any proposed text (with or without Canada) goes before Congress, there is still much ground to cover. Watch this space.
Canada: Upcoming Key Economic Releases
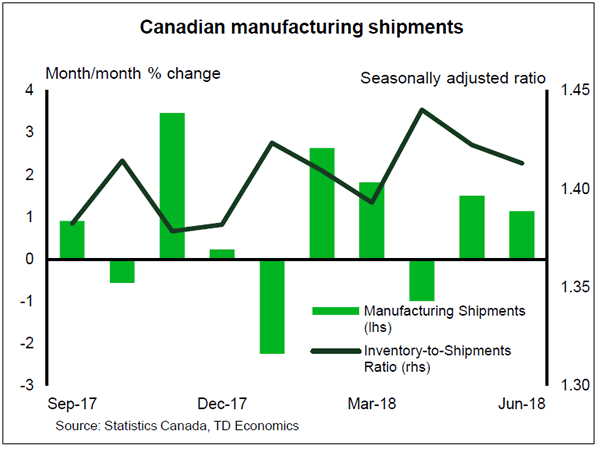
Canadian Manufacturing Sales - July
- Release Date: September 18, 2018
- Previous: 1.1%
- TD Forecast: 0.3%
- Consensus: 1.0%
Manufacturing sales are poised for a 0.3% increase in July. Durable goods should lead the advance on further gains in motor vehicle output, as foreshadowed by a pickup in exports, which should more than offset a modest drag in metals from steel and aluminum tariffs. Retaliatory tariffs were imposed on July 1st but will have little impact on manufacturing as a whole given that a large portion was directed towards goods for consumption. Energy may also act as a modest headwind on a pullback from the 15% increase in June though oil sands shutdowns are unlikely have a significant impact on downstream activity. Volumes should see a more modest gain (~0.1%) on higher factory prices which indicates little to no contribution to industry-level GDP growth in July.
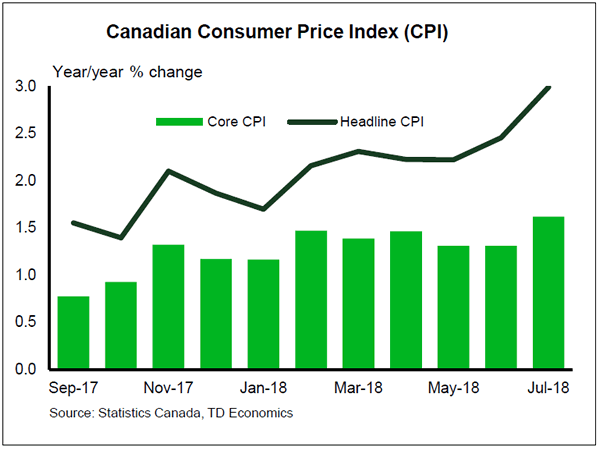
Consumer Price Index - August
- Release Date: September 21, 2018
- Previous: 0.5% m/m, 3.0% y/y, index: 134.3
- TD Forecast: -0.4% m/m, 2.5% y/y, Index: 133.8
- Consensus: N/A
We expect CPI to come back down to earth to 2.5% after hitting 3.0% in July. The prior month's spike was driven by upswings in airfares and to a less extent in travel tours and telephone services. We expect a significant correction in airfares in particular, as the recent methodological change is likely to introduce more volatility to the index. This should drive an overall 0.4% drop in prices on the month. Energy prices are also a net negative this month (led by lower gasoline prices) and we also see scope for a moderation in food prices. So far price impacts from Canada's retaliatory tariffs have been negligible, but the categories to watch are food items, household appliances, personal care products and vehicles.
Our forecast implies exclusion-based core indexes (CPIX and CPIXFE) to slow this month, with the latter falling back to 2% or below. We expect the BoC core measures to remain near 2.0% on average. Looking ahead, despite the July upside we continue to expect a moderation toward 2.0% through year end.
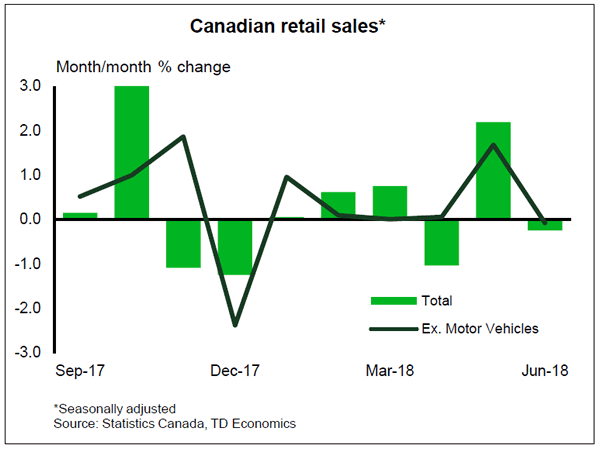
Canadian Retail Sales - July
- Release Date: September 21, 2018
- Previous: -0.2%, ex auto: -0.1%
- TD Forecast: 0.1%, ex auto: 0.6%
- Consensus: N/A
Retail sales should post a 0.1% advance in July as a pullback in motor vehicle sales offsets a more upbeat 0.6% increase in the ex-autos measures. Unseasonably warm weather across most of the country will support gasoline sales along with higher prices at the pump, while alcohol sales should also benefit from the weather and World Cup festivities. Volumes should post a slight decline on higher consumer prices which will set up for a more modest pace of consumer spending in Q3, especially after a poor handoff from June. However, this should not come as a grave concern to policymakers at the BoC concerned with elevated levels of household debt.
Week Ahead: A Variety of Recent Events Have Influenced the Markets
Market Wrap
The markets have seen a mixture of bearish and bullish sentiments. Moreover, the dollar has been unfortunate to taste weakness in recent sessions as commodities and neighboring currencies have taken advantage of this. Gold has seen good strength as the greenback declines due to trade disputes. In the oil markets, it seems that supply is becoming more and more of a major concern as the sanctions placed on Iran approach. This in turn has reduced demand for oil which has forced the prices to decline for both Brent crude and West Texas Intermediate. In addition, indexes seem to have had a variety of highs and lows, as the recent events in tech stocks had shown declines. Nevertheless, it seems that Dow Jones is on the rise with a bullish momentum.
EURUSD
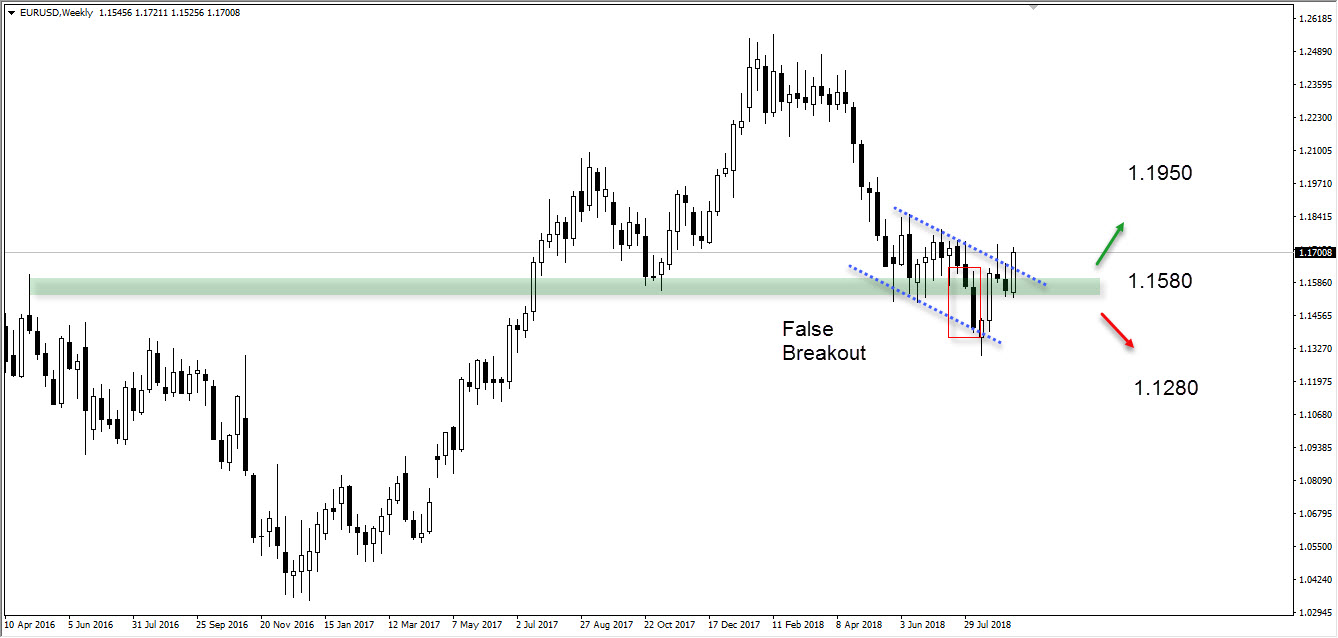
The chart below on a weekly time-frame shows the pair EUR/USD trading in a downward channel where the price had initially experienced a rebound and in result of this the price had continued to rise, which led to a close above the major level $1.1580. Moreover, it is also displayed below that the previous bearish breakout had failed. If the price continues to rise it may trade towards resistance zone (indicated by green arrow) which is priced at $1.1950.
On the other hand, if the price declines and breaks out of the downward channel then the pair in this case may travel towards the support zone (indicated by red arrow) which is priced at $1.1280.
Major support: 1.1280
Major resistance: 1.1950
GBPUSD
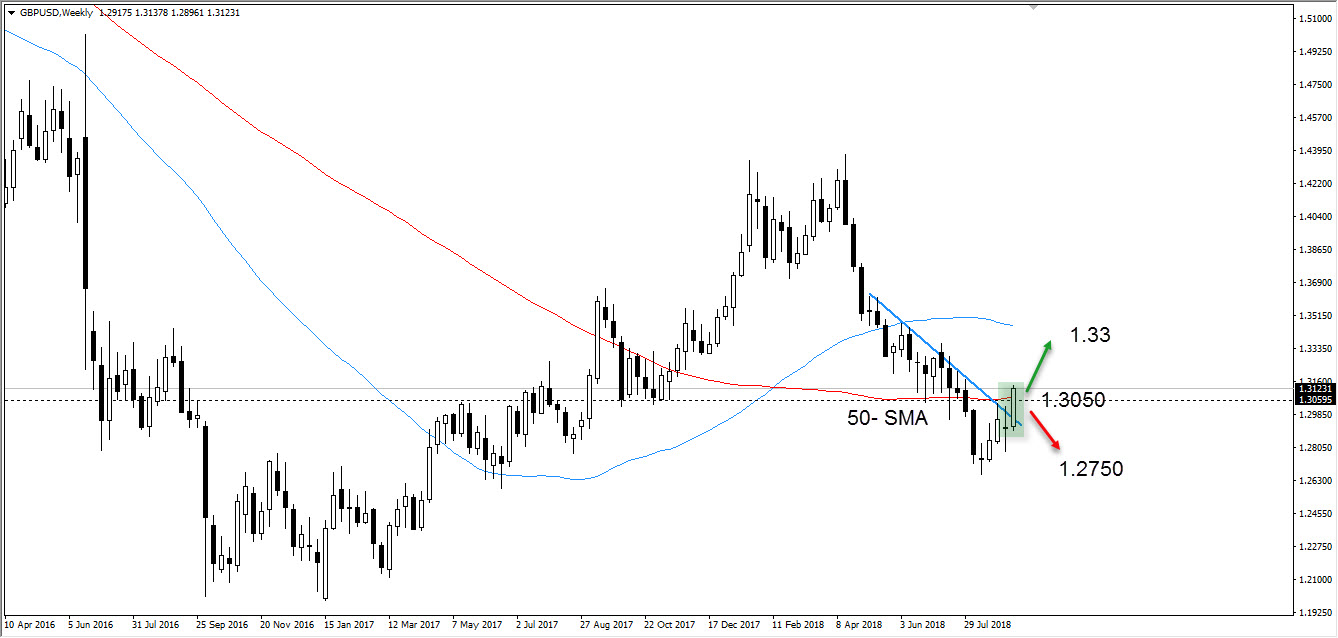
The chart below on a weekly time-frame shows the pair GBP/USD trading in an uptrend where the weekly close has finished above the 50-day moving average. This is a bullish sign which may continue to drive the price higher. Moreover, the strong buying momentum remains where the weak U.S. dollar is liable to this.
In addition, the price at present is controlled by the bulls. Therefore, if this carries on it may allow the pair to trade in the direction of the resistance zone (indicated by green arrow) which is priced at $1.33. Nevertheless, if by chance the bullish momentum dies out and bears gain the upper hand, then this may provoke the price to trade towards the support zone (indicated by red arrow) which is priced at $1.2750.
Major support: 1.2750
Major resistance: 1.33
USDJPY
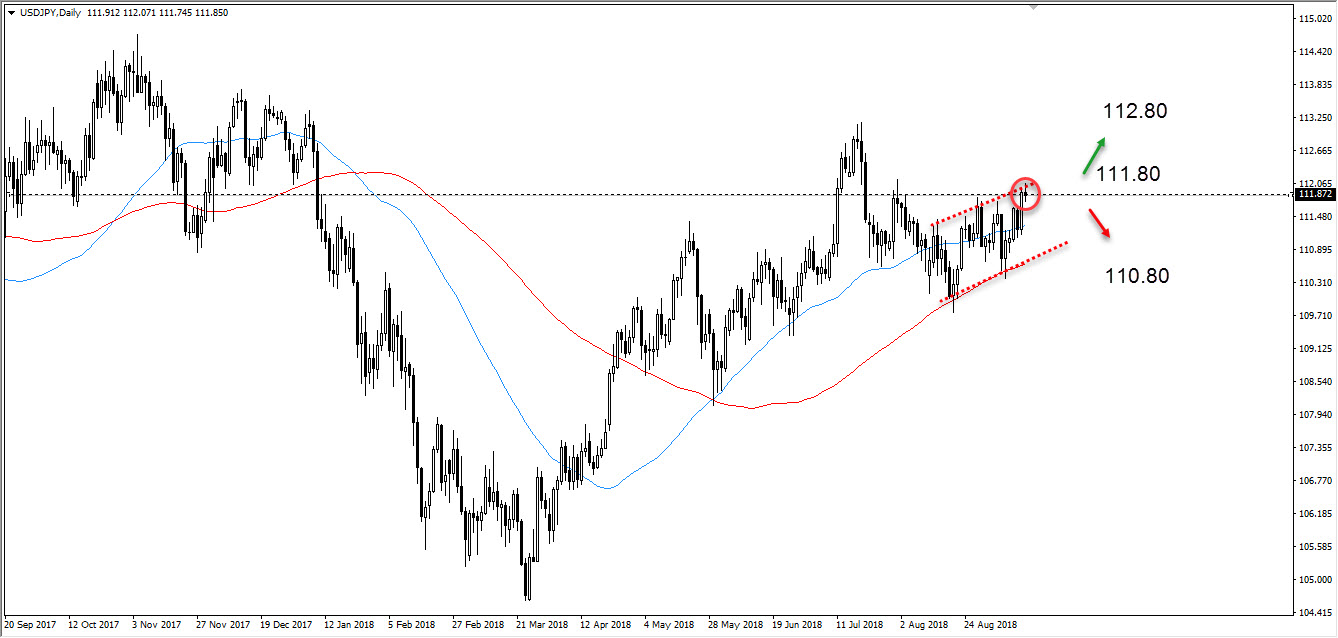
The chart below on a daily time-frame shows the pair USD/JPY presently trading in an upward cannel, where the price is currently at $111.87. Moreover, it is displayed that the price had failed to break above the resistance zone (indicated by green arrow) which is priced at $112.80. Additionally, this is in the same region as the upper line of the upward channel. This has prevented the price from increasing like the previous candle shown at resistance zone.
As long as the markets continue to trade below $111.80 there maybe a strong downward move where the price could approach the down line of the upward channel and support zone (indicated by red arrow) which is priced at $110.80.
Major support: 110.80
Major resistance: 112.80
Gold
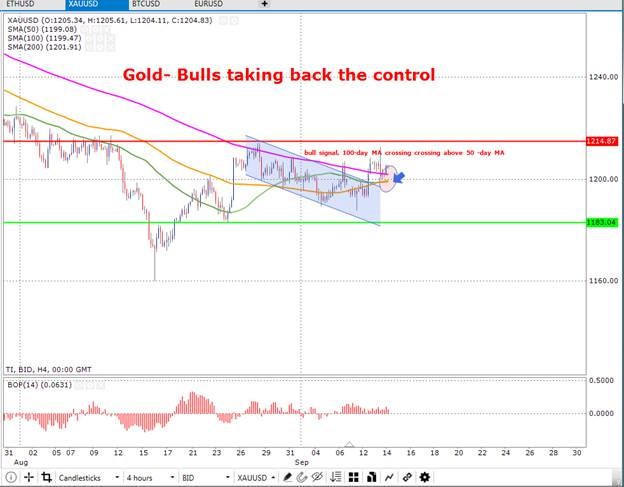
The chart below on an intra-day time frame (4 hours) shows gold trading in an uptrend. Moreover, the price is currently trading above all moving averages where additionally, it is displayed below that the 100-day moving average seems to be performing a cross over above the 50-day moving average which lets off a strong bullish signal. In result, this may allow the price to continue trading towards the resistance zone (colored in red) which is priced at $1214.87. On the other hand, if the price starts to decline where the bears take over, then the price may move in the direction of the support zone (shown in horizontal green line) which is priced at $1183.04.
The Balance of Power chart below confirms the bullish momentum which is present in the markets for gold. However, the chart shows a variety of highs and lows, but at present the price looks to be in bull territory. Nevertheless, this is not to say this will always be the case.
Major support: 1183.04
Major resistance: 1214.87
Oil
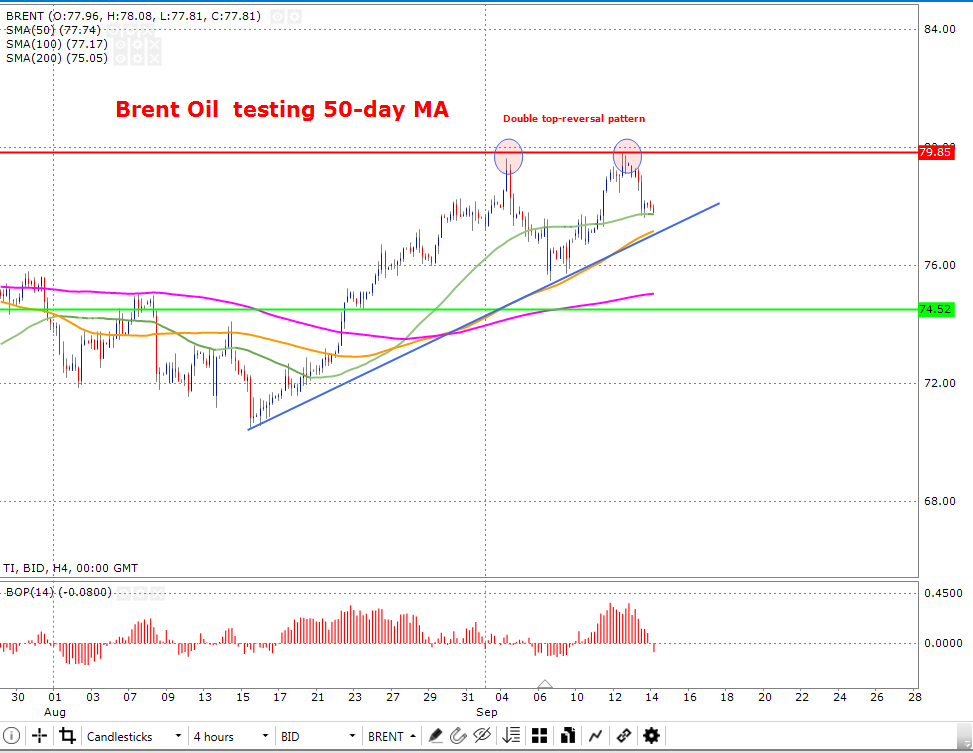
The chart below on an intra-day time frame (4 hours) shows Brent crude oil trading in an uptrend where the price is testing the 50-day (colored in green) moving average. It is displayed that the price had encountered two double top reversal patterns which is clearly displayed in the chart as transparent circles. Moreover, this is most commonly known as a reversal pattern which informs a potential correction.
If the price experiences an increase in price, then oil may trade towards the resistance zone (shown in horizontal red line) which is priced at $79.85. In addition, this is where the two-previous double top reversal patters had taken place. On the other hand, if the price declines where a bearish momentum would be present, then the price may trade towards the support zone (shown in horizontal green line) which is priced at $74.52.
The Balance of Power chart below shows that the bears have gained strength and are currently in control. Nevertheless, it is also displayed that the bulls had a long win streak. However, dependent upon the outcome of the price testing the 50-day moving average shown below may determine which side of the markets will hold dominance.
Major support: 74.52
Major resistance: 79.85
Dow Jones
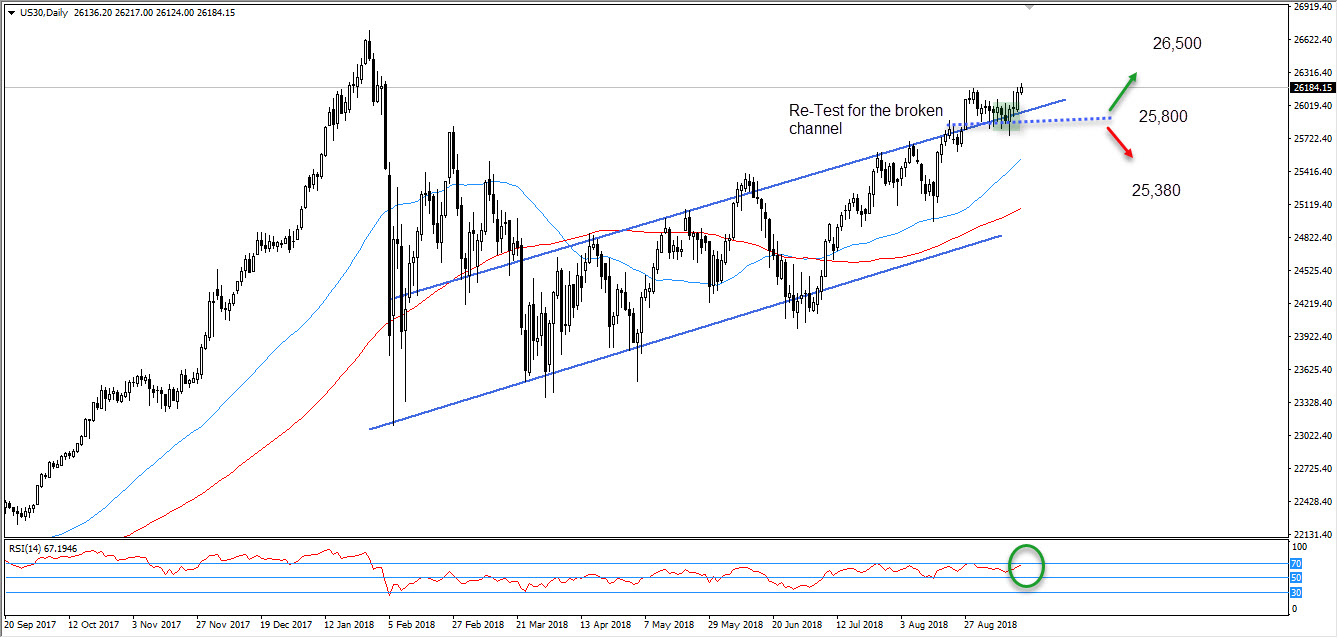
The chart below on a daily time-frame shows the index Dow Jones currently trading at $26184.15. Moreover, it is displayed that buying interest had increased as the Index experienced a re-test at the upper line of the upward channel where the support zone also stands (dotted blue line) which is priced at $25,800.
It is displayed below that a strong buying momentum is present in the markets and if this persists, then the index may see increases in the direction of the major resistance zone (indicated by green arrow) which is priced at $26.500. However, this is if the price continues to trade above $25,800. If the prices fail to do so, it may trade towards support zone (indicated by red arrow) which is priced at $25,380.
The Relative Strength Index chart shows that the price is heavily in the over sold territory. Therefore, a bearish sentiment maybe among the markets in the upcoming sessions. However, this is only a possibility.
Major support: 25,380
Major resistance: 26,500
Trade Tensions Return as US Tariffs on China Lift Dollar
The dollar bounced back on Friday, after a couple of economic indicator misses this week, the greenback is higher against all major pairs. Major pairs and commodities are lower against the greenback ahead of the weekend. The American currency did not manage to overturn the losses posted during the rest of the week. On a weekly basis the USD is lower against all majors except the Japanese Yen.
A slowdown in the pace of inflation, miss in retail sales expectations and a softer tone on trade from the Trump administration were the three major factors for the softness of the currency.
Rate differentials also helping the USD. This week was mostly a non event for the Bank of England (BoE) and the European Central Bank (ECB). Although the Sept rate hike by the Fed is priced in, it also shows its the only economy with some momentum to even lift rates. Next up in the economic calendar are the Bank of Japan (BOJ) and the Swiss National Bank that are not expected to modify their monetary policies.
Euro Scored a Win on a Weekly Basis but Falls as Trade Tensions Rise
The escalation of trade tensions was a positive for the US dollar as investors sought a safe haven during times of uncertainty. As potential olive branches are put forward there is optimism that Canada will join the US-Mexico agreement and talks with China could lead to closing the gap between the two points of view on trade. US President Trump tweeted on Friday that the a meeting with China is no guarantee of anything and reports in the media suggest the $200 billion US tariffs are still on the table.
A September rate hike is still fully priced in, but the inflation and retail sales miss did slim down the probabilities of a follow up rate hike in December.
The American economic calendar is short on blockbuster releases with Washington development to guide markets as trade tensions have eased, but are far from resolved.
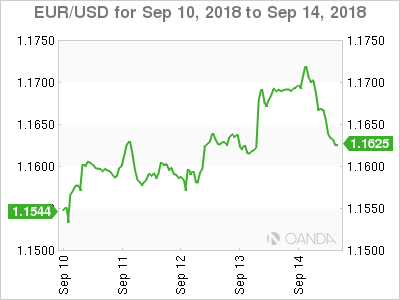
Investors were not given any new information and instead bought the currency on improved international trade environment. The olive branches are just now entering the picture, and ECB economists could not have predicted the timing as they also announced a downgrade of their economic projections, citing trade worries.
Upcoming European inflation along with service and manufacturing PMIs will bookend the economic calendar in the EU. The gap between interest rates will continue to grow as the U.S. Federal Reserve pushes on its tightening policies as growth fails to spark momentum in Europe.
Fed rate hikes are priced in into the USD, but signs of European slowdown or the US economy hitting a higher gear could be a gift for dollar bulls.
Canadian Dollar Awaits News on NAFTA as US Gets Tough on China
The Canadian dollar fell on Friday. After the Trump administration softened its stance on international trade, in particular by reopening trade talks with China, NAFTA optimism boosted the loonie. Traders did not feel confident in carrying over short dollar positions into the weekend and the greenback saw a recovery on Friday.
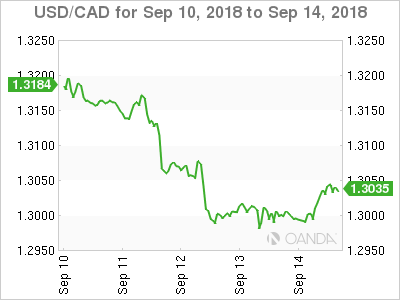
Expectations are mixed on NAFTA, as Canada seems ready to make concessions on dairy but the US and Mexico continue to press for a trilateral deal while also adding they are ready to forge ahead if its only a bilateral one.
China Tariffs Cap Rise of Oil as Growth Concerns Hit Commodities
Oil fell 0.35 percent on Friday compounding on losses seen on Thursday, but will head into the weekend with a 1.09 percent gain. Supply disruptions have lifted prices after the 2014, be it the Organization of the Petroleum Exporting Countries (OPEC) and major producers agreement to limit their output to weather and geopolitical disputes.
Hurricane Florence in the US was downgraded and with it the negative short term effect on potential disruptions. IEA reported today that OPEC is starting to ramp up production by 420,000 daily barrels more than making up for the impact that the sanctions on Iranian exports will have on supply.
Global demand for crude has not shown signs of recovery and if producers start pumping there is a risk that oversupply could once again bring instability to oil prices.
Geopolitical factors like the US-China trade tensions will continue to put downward pressure on crude prices as higher levels of protectionist measures tend to slow down global growth.
Yellow Metal Falls as Risk Aversion and Fed Rate Hikes Advance
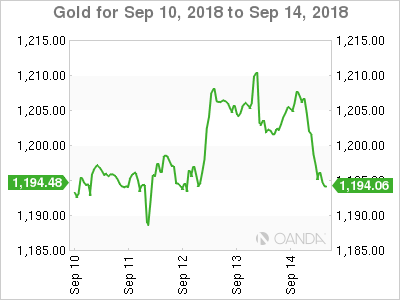
Gold fell 0.46 on Friday after a bounce in the US dollar at the end of the week. Risk aversion has been the main dollar of US strength as trade war concerns could have a deep impact in global growth. Commodities have recovered this week after the Trump administration has softened its tough stance with China with bilateral talks to restart in a couple of weeks.
Forex Trading Psychology
Forex trading psychology is a big thing. Often, it is the psychology, not a lack of academic knowledge or skill in application, that is considered to be the primary originator of trading mistakes.
Mistakes are constantly repeated by financial traders of various national, cultural and social backgrounds, which suggests that it is the common traits shared among us as humans that lie in the base of those mistakes.
That common trait is fear, which creates the fight or flight response in humans. Unfortunately, it is this fight or flight response which can cause the downfall of many traders.
We cannot change what we have evolved to feel over millions of years, but we can change how we approach these feelings by studying the psychology of successful Forex traders and applying the findings. Today, we will look at how we should behave and respond to trading situations from the correct Forex trading psychology point of view.
Fear can have a significantly limiting effect on trading behaviour. Naturally, your mind will want to find the safest option to ensure survival. In terms of trading, this means that if a trade looks like it is going to lose profit, your natural instinct would be to pull out of the trade so you don't incur further losses.
However, this can take you away from a carefully planned trading strategy. Even worse, it could cause you to make rash decisions with the hope of turning that losing trade around, causing you to lose much more money than you would of if you had just left it to play out.
Instead of focusing on the long term plan, your mind wants to focus on making the best out of this short term losing position.
Understanding the role of psychology in Forex trading will help alleviate fear from your decision making process. Becoming aware of fear on the spot will empower you, both as a trader and as an individual. It will also allow you to re-establish the control of logic and reason, which is your ultimate goal.
Enemy mine
It's easy for traders to feel confident in their ability to stay calm and collected during their trading sessions before the market opens. However, once the clock starts it's a different story. When faced with real, financial decisions it's very easy for emotions to come into play. We can't avoid our emotions, but we can work around them. Traders cannot afford to give in to feelings of excitement, fear or greed when trading, as it can cause costly and irreversible mistakes.
Evaluate yourself psychologically by identifying if you are exposed to one of the following psychological biases of Forex trading:
Overconfidence bias - 'The market will go here'
Anchoring bias - 'This probably means that'
Confirmation bias - 'This also proves that I am right'
Loss bias - 'I hope the price will come back'
Notice how they overlap, because no matter how you look at it each of these biases boil down to fear. Nonetheless, we shall discuss them in detail because the first step is to become aware of our emotions.
Overconfidence bias
Lesson number one in Forex trading psychology is to watch out for trading euphoria. Humans are naturally self-focused. Our egos want to be validated through proving that we know what we are doing and that we are better than the average person. Any hint that confirms these thoughts only reinforces our self-image by a distinct feeling of self-love.
The problem is that this is where traders are most likely to succumb to the overconfidence bias. It's not uncommon for traders to complete a winning streak and then believe that they can't get anything wrong in the future. To believe this is of course unwise and is only going to end in failure. Make sure you always analyse your trading sessions and look at your wins and losses.
This is the only way you can really stay on top of your trading. Allow yourself to make mistakes - and don't make the mistake of being scared to prove yourself wrong - you'll be in a much better position for it in the long run.
You have to be comfortable with accepting that mistakes are inevitable, especially in the early stages, but it's all part of the learning curve.
Anchoring bias
This one is about mental comfort zones created by traders when performing market analysis, ultimately thinking that the future will be the same as the present, purely based on the reason that the present appears to be like the past. Just as other biases in Forex trading psychology, this one is directly borrowed from social studies.
Anchoring is a tendency to rely on what is already known to a trader for decision making in the future, instead of considering new situations and the changes they can bring. At times, anchoring tends to cause traders to rely on obsolete and irrelevant information, which of course won't help them trade successfully. In practical terms this manifests in traders holding losing positions open for too long, simply because they fail to consider the options that are outside their comfort zone.
You mustn't be afraid of trying new things when trading Forex - be willing to try new strategies and go against what you know. By anchoring yourself to outdated strategies and knowledge, you're only increasing the probability of bigger losses.
Confirmation bias
Confirmation bias is the one that is most common amongst traders. Looking for information that will support a decision you have made, even if it wasn't the best decision, is a way to justify your actions and strategy. The problem is that by doing this, you're not actually improving your methods and you're just going to keep making the same mistakes. Unfortunately, this can create an infinite loop in Forex trading psychology that can be difficult to break.
The best case scenario in confirmation bias is that a trader will simply waste precious time researching what they already knew to be true. However, the worst case scenario is that not only will he lose time, but also money and the motivation to trade. A trader must learn to trust himself, and be happy to use his intelligence to develop profitable strategies and be able to follow them without fear or doubt.
Loss bias
Loss aversion bias derives from the prospect theory. Humans have a funny way of evaluating their gains and losses, along with comparing their perceived meanings against each other. For example, when considering our options before making a choice, we are more willing to give preference to a lower possible loss over a higher possible reward. Fear is a much more powerful motivator than greed. In practice, a trader with a loss bias is more akin to cutting profits when they are still low, while allowing bigger drawdowns.
Conclusion
There is only one piece of advice to solve the problems of traders that can be drawn from studying Forex trading psychology - develop a trading plan and stick to it.
As a trader in doubt, you should absolutely feel free to research every other possible remedy available, but the chances are that you will still come back to a simple trading plan. It's understandable for traders to feel fear when trading.
However, being able to push this fear aside and work through it is absolutely vital for any trader who wants to be successful. Practice trading, make notes, research new strategies and make mistakes.
Trial and error is a massive part of the Forex learning curve, and generations of traders have proved that this is the most effective way to eliminate trading fears.
You might consider this example as a point of reference if you start to doubt yourself. Dr. Alexander Elder in one of his lectures told a story about an old friend of his, a private trader who was inconsistent and experienced periods of wins and losses alike. In a couple of years this trader's name ended up on the US list of top money managers.
When Elder asked 'How, what changed?', the trader said, 'I am using the same trading strategy that I always have. What changed is that I stopped trading against myself and my strategy.' That money manager pulled a mental trick on himself.
When he was still a private trader and was inconsistently profitable, he pretended he was employed by an investment firm and had a real boss, who gave him a trading strategy and left for a year, leaving the man in charge with one condition. Upon the boss's return, the performance of the trader will be not judged by how much money he made, but by how meticulously he followed the strategy.
In other words, he split his trading into two separate roles - the planner, who had no exposure to the market, and the executor, who had no say in planning.
What's more, it worked.
Is the US Economy Running Out of Labour?
Key points
- Tight US labour market a rising risk to growth.
- US-China trade war set to escalate further before deal is reached.
- Emerging market assets cheaper but still short-term risks.
Tight labour market a rising challenge to US growth
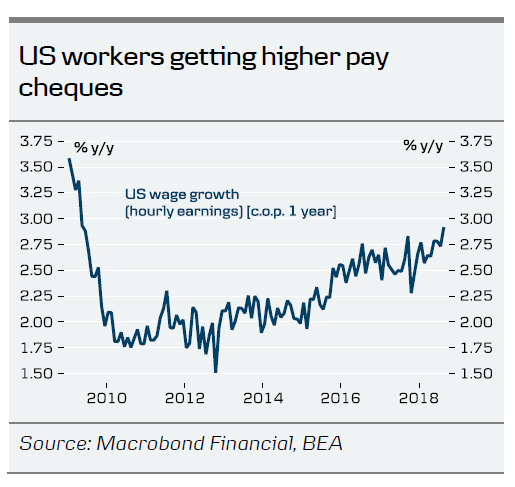
The main news in the US labour market report last week was a 2.9% jump in wage growth. It was the highest level in close to 10 years and suggests a tight labour market is starting to feed into higher wage growth and thus inflation pressure – something that has been missing so far. However, Thursday's inflation data painted a different picture. US core inflation surprised on the downside, rising only 2.2% y/y in August, down from 2.4% y/y in July. Hence, the jury is still out on whether we are finally getting higher inflation in the US.
However, indicators of tightness in the labour market suggest that US companies are finding it increasingly difficult to find skilled labour (see chart below) – something that typically translates into higher wage growth and inflation eventually.
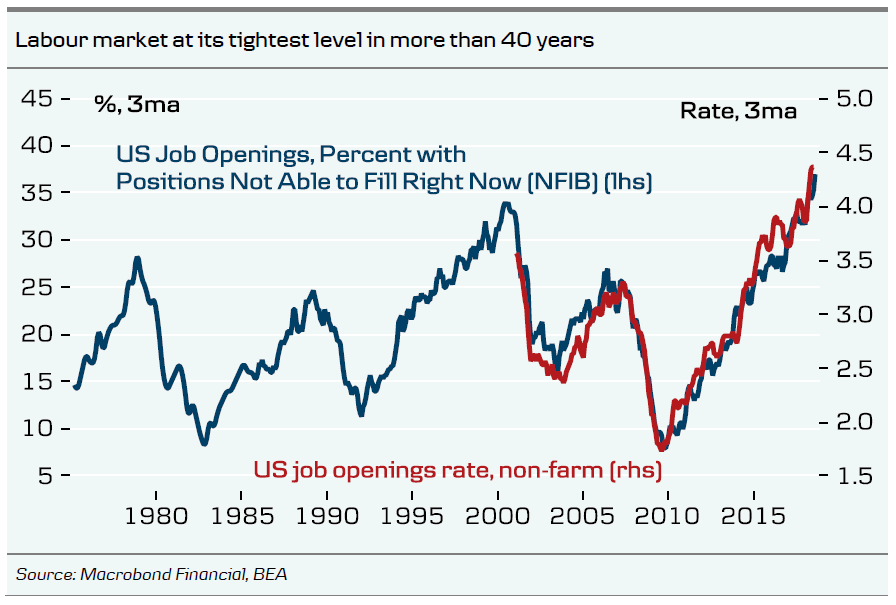
Even if inflation fails to pick up, it could still prove an obstacle for growth. For companies to keep increasing production, they need more hands. If they face bottlenecks, it could put a brake on growth. Similarly, it would be likely to pave the way for continued higher policy rates by the Fed to stem demand growth and lean against the wind to avoid overheating.
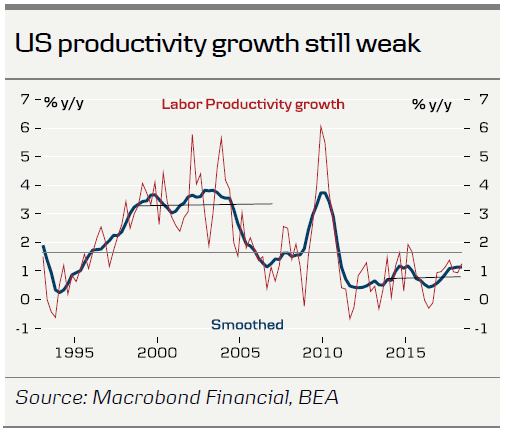
A way to keep strong growth even with bottlenecks in the labour market is by squeezing more out of each worker – in other words, by increasing productivity growth. However, so far there is no sign of rising productivity growth, which is still hovering around 1% y/y, much lower than the 3% level prior to the financial crisis. While US President Donald Trump is stating his policy is already working by boosting growth, there is no evidence that it is raising the potential growth rate of the US economy.
Rather, the tax cuts are boosting demand and thus pushing up production faster. However, unless productivity growth increases, the higher demand growth will just use up the available resources earlier than otherwise. It will also push up investment orders to increase production capacity but without available labour, it is hard to produce more investment goods as well. For now, we continue to look for 2.7% growth this year and 2.5% in 2019. However, we need to see higher productivity growth soon for this to be within reach.
The tighter labour market underpins our expectation of another two rate hikes this year, followed by another three hikes next year. We look for the Fed to be on autopilot until March, when we expect rates to hit the neutral rate of 2.75-3.00%. After this, it is likely to be more cautious.
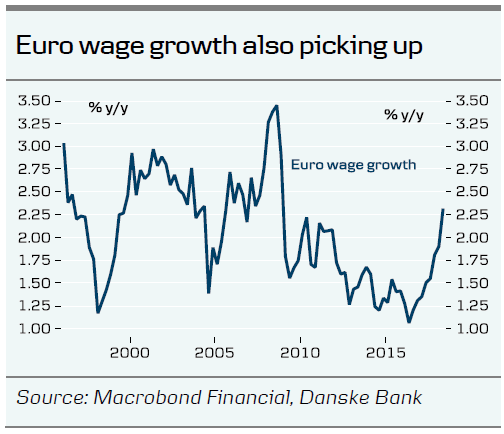
In the euro area, wage pressures have also picked up lately. Wage growth currently stands at 2.3%, after hitting a bottom two years ago at 1.0%. At the ECB meeting this week, the ECB seemed increasingly confident that wage growth would move higher and push up inflation as well over the medium term.
US-China trade war: further escalation coming
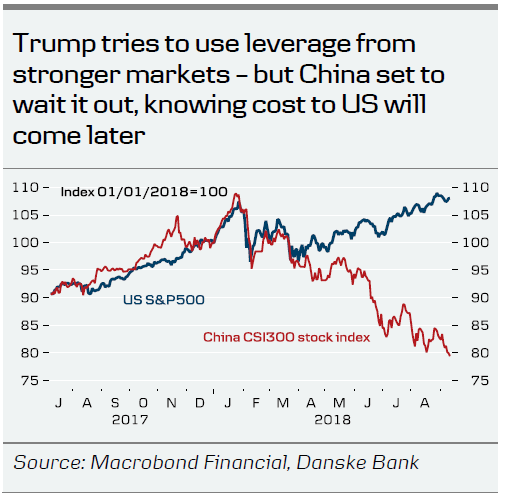
In the US-China trade war, we are still waiting for Trump to reveal when he will go through with a 25% tariff on another USD200bn of Chinese imports. Developments this week suggest it is only a matter of time. Trump was quick to quash a small hope that the US and China would meet for high-level trade talks. While China confirmed it had received an invitation for trade talks from Treasury Secretary Steven Mnuchin, Trump tweeted shortly after that the US was under no pressure to meet with China and that 'our markets are surging, theirs are collapsing'. With this signal, it is very unlikely that China will enter into new high-level talks. Having already been burnt once in May when Trump left negotiations, China is unlikely to go into new talks without a clear signal from Trump that he is serious about reaching a deal. China strongly opposes US bullying and what it calls Trump's 'winner-takes-all' approach to deal making. In China, deals have to have a 'win-win' outcome. No Chinese leader can afford to look like it is giving in to US bullying. Hence, we continue to expect the tariffs on USD200bn worth of Chinese goods to come into effect within the next month and we expect China to retaliate.
Emerging markets: looking cheaper but still short-term risks
Emerging market assets have been through a rough time lately, taking a hit from a slowdown in China, higher US policy rates and crises in several emerging market economies such as Turkey, Argentina and, to some extent, South Africa. While many emerging market assets are getting cheaper, we still see short-term risks from a further escalation in the US-China trade war and further US Fed hikes. However, from a long-term point of view, many emerging market assets look increasingly attractive.
Week Ahead – Inflation and flash PMI data to dominate; BoJ to leave policy unchanged
Economic data will move to the fore next week with several countries reporting inflation, retail sales and flash PMIs. Canada and the United Kingdom will publish CPI and retail sales figures, while in the Eurozone, the focus will be on the flash PMI releases by IHS Markit. Second quarter GDP figures out of New Zealand will be another highlight. Central bank activity will also keep the markets busy as the Bank of Japan and the Swiss National Bank hold policy meetings.
No tweaks expected from Bank of Japan this time
The Bank of Japan made several modifications to its program of “Quantitative and Qualitative Monetary Easing with Yield Curve Control” at its July meeting. The yen managed to avoid a sharp appreciation as the BoJ succeeded in convincing markets that allowing long-term yields to trade in a wider band does not translate to tapering. With no change in policy anticipated from the BoJ on Wednesday, investors will likely turn to Friday’s inflation numbers. The 12-month core CPI rate, which excludes fresh food prices, is expected to inch up to 0.9%. A stronger-than-expected figure would be positive for the yen as it would increase speculation of the BoJ lifting interest rates out of negative territory sooner rather than later.
Other data to keep an eye on from Japan next week are the August trade numbers on Wednesday and the flash manufacturing PMI on Friday.
New Zealand GDP growth to remain subdued
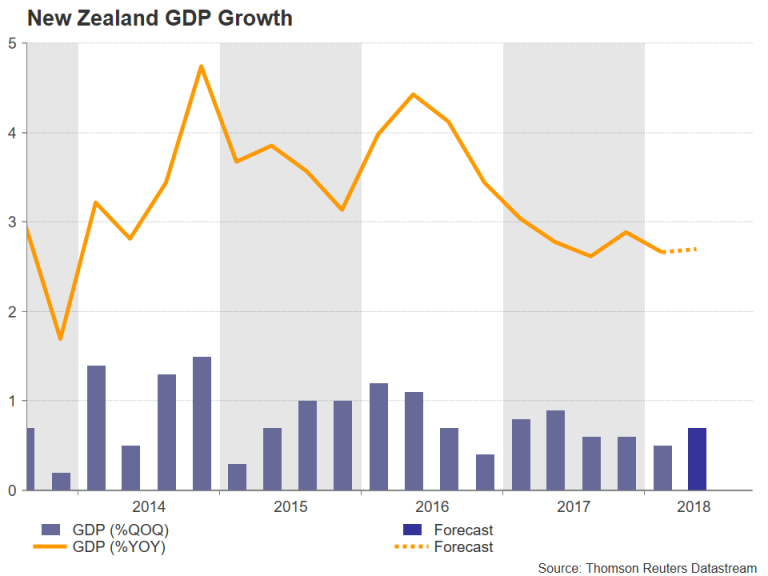
New Zealand’s GDP numbers for the second quarter will be watched closely on Wednesday as incoming data continue to point to weakness in the economy. The country’s GDP is forecast to have expanded by 0.7% quarter-on-quarter in the three months to June, improving from the prior quarter’s 0.5% rate. The annual rate is projected to have increased by 2.7%. A worse-than-expected reading could bring the Reserve Bank of New Zealand closer to a rate cut and that could send the kiwi spiralling below this week’s 2½-year low of $0.6499.
Eurozone flash PMIs eyed as growth stuck at low gear
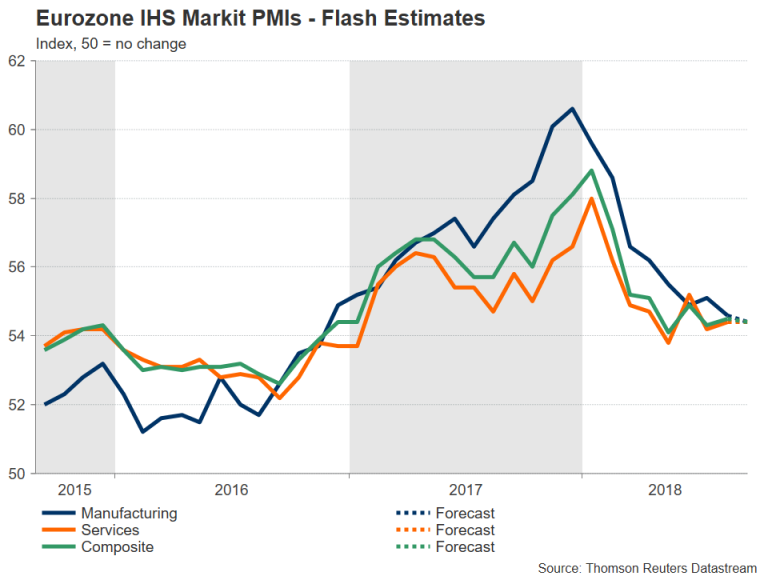
The flash IHS Markit PMIs will be the only focal point for the euro in the coming week as the Eurozone calendar will be rather light. The final CPI print for August will start the week on Monday but is unlikely to attract much attention as no revision to the preliminary reading of 2.0% year-on-year is anticipated. It will be followed by the flash consumer confidence release on Thursday before traders are drawn to the flash PMIs on Friday. The composite PMI, consisting of both the manufacturing and services sectors, is forecast to decline by 0.1 points to 54.4 in September. A surprise stronger reading could be viewed as a sign that worries in the bloc over a global trade war are subsiding, indicating faster growth in the months ahead. Eurozone growth has failed to bounce back from a slowdown at the start of the year and a change in the outlook would drag the euro out of neutral mode.
Norges Bank set to raise rates but SNB to remain on hold
The Swiss National Bank will once again follow in the footsteps of the European Central Bank, which met this week, and keep interest rates unchanged on Thursday as the central bank continues to fret over an overvalued exchange rate for the franc. Concerns about the Italian budget and the turmoil in Turkey drove the euro briefly below the 1.12 level versus the safe-haven Swiss franc this week before bouncing higher. The rebound was a bit suspicious and could have been down to intervention by the SNB, though it did coincide with a drop in Italian-German yield spreads. The SNB is expected to continue to highlight the “highly valued” franc and will probably keep the 3-month LIBOR target range at between -0.25% and -1.25% until at least after the first ECB rate hike in late 2019.
In contrast, Norway’s central bank, the Norges Bank, is widely expected to raise its key policy rate from 0.50% to 0.75% on Thursday, in what would be the first increase since 2011. The Norwegian krone has been rallying agianst the dollar and the euro during September. It could extend its gains if the Norges Bank couples the rate increase with a steeper rate path guidance.
UK inflation and retail sales data may drown under Brexit noise
Brexit talks between the UK and the EU are expected to be stepped up in the coming days with the topic likely to dominate the informal summit of EU leaders in Austria on September 20. Sterling should therefore continue to see high volatility as it remains sensitive to Brexit headlines. The currency got a boost during the past week on signs the EU is prepared to make some concessions to the UK in order to avoid a disorderly Brexit. Upbeat economic data also contributed to the bullish momentum, although next week’s indicators may not be as positive and could fail to provide support for the pound in case the Brexit negotiations were to break down.
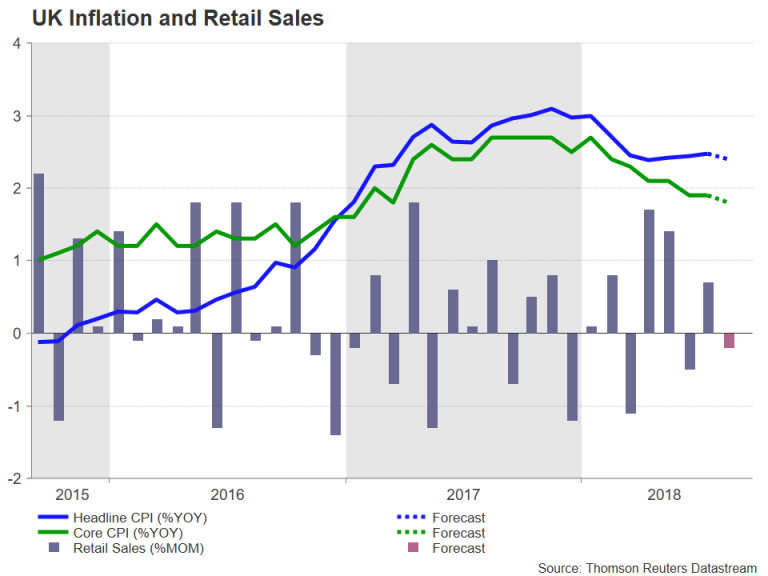
CPI figures will be watched on Wednesday for evidence that inflationary pressures in the UK continue to edge lower towards the Bank of England’s 2% target. Headline inflation is forecast to dip back to 2.4% y/y in August, while the core rate is predicted to fall to 1.8% from 1.9% previously. Retail sales numbers will follow on Thursday and are expected to show a 0.2% month-on-month contraction in sales in August after a 0.7% bounce in July.
Muted week for the US
It will be a relatively subdued week for the US over the next seven days with few top tier releases on the schedule. The New York Fed’s Empire State manufacturing index for September will be the only highlight on Monday before the focus shifts to the housing market on Wednesday with the release of August building permits and housing starts. On Thursday, the housing theme will continue with existing home sales, while the Philly Fed manufacturing index will provide a second look at manufacturing activity in September. The final gauge for the sector will come from IHS Markit’s flash manufacturing PMI on Friday, which will be published alongside the flash services PMI for September. The absence of major data next week means the US dollar would be vulnerable to trade-related safe-haven flows.
Loonie to look to Canadian inflation and retail sales as NAFTA talks drag on
With the possibility that talks between the US and Canada to update NAFTA could go on until October 1, which is the deadline for submitting an agreement to the US Congress, traders will have economic numbers to turn to for distraction. Manufacturing sales for July are out first on Tuesday, with the remainder of releases not due until Friday when attention will fall on the latest inflation and retail sales figures. Annual inflation surged to 3% in July to the highest since 2011. A further acceleration in August would strengthen the odds of the Bank of Canada raising interest rates at its October policy meeting, helping the Canadian dollar advance beyond this week’s 2-week high of C$1.2971 per US dollar. As for retail sales, it’s been a more mixed picture, with sales slowing notably since late last year. However, another unimpressive figure for July is unlikely to be enough to deter the BoC from hiking again soon.
Australia & New Zealand Weekly: AUD on Track to Reach USD 0.70 Before Leg Down in the US Cycle
Australia & New Zealand Weekly
Week beginning 17 September 2018
- AUD on track to reach USD 0.70 before leg down in the US cycle.
- Australia: Westpac-MI Leading Index, RBA minutes, RBA Assistant Governor (Financial Markets) Kent speaks.
- NZ: Westpac-MM consumer sentiment, GDP, current account.
- Europe: ECB President Draghi speaks, consumer confidence.
- US: housing starts and building permits.
- Central bank meetings: BoJ, BoT.
- Flash PMI's for Japan, the Euro Area and the US.
- Key economic & financial forecasts.
Information contained in this report current as at 14 September 2018.
AUD on Track to Reach USD 0.70 Before Leg Down in the US Cycle
Over the last month the Australian dollar has fallen from around USD0.74 to USD0.71 and is now settling around USD0.72. The AUD is closing in on our mid 2019 forecast of USD0.70 at a much faster pace than we had envisaged.
Recall that the key arguments we have used throughout 2018 to signal a significant fall in AUD from its peak in January 2018 of USD0.81 have been around: Australian interest rates falling much further below US rates than had been expected by markets; a general slowdown in the world economy, particularly through 2018 and 2019; some deterioration in the Australian housing market; and political uncertainty associated with the Australian Federal Election due by May 2019.
These issues have been evolving largely as we expected.
In July last year markets were priced for the RBA cash rate to be around 40bps above the Federal Funds rate by end 2018 whereas Westpac argued that the RBA cash rate would be around 40bps below the Federal Funds rate by that time. Markets have now largely embraced our call although, with the advent of the tax cuts and spending boost from the Trump administration, we revised up our Fed call to give a margin of around 88bps by end 2018. Markets are now largely in line with our call for end 2018 but still remain somewhat cautious for mid-2019 with Westpac expecting a margin of 137bps compared to market expectations of 115-120bps. That interest rate differential points to further downside risks for the AUD.
Disappointing developments in Europe; an ongoing slowdown in China; and some instability amongst some emerging markets support our view that global growth in 2019 will slow from 3.8% to 3.6% with further weakness expected in 2020. Slowing US growth remains the cornerstone of this view.
In Australia, house prices have been falling in the two largest cities - Sydney and Melbourne - through most of 2018. Foreign investors remain nervous about Australia's housing market given Australia's high household debt and stretched affordability. The banks are the main vehicle for borrowing to fund this debt and, with their assets dominated by mortgages, international lenders are always sensitive to adverse developments in the housing market.
Political uncertainty has also been a factor for markets following the recent leadership change in our Federal Government. Several elections are due between now and mid- 2019 including for the Federal Government (by 18 May 2019 at the latest); the Victorian State Government (scheduled for 24 November) and the NSW State Government (scheduled for 23 March).
Last month we reaffirmed the target of USD0.70 for the AUD (around USD0.74 at the time) by mid-2019. The move to USD0.72 has run ahead of our timetable.
Fears of a global trade war and general contagion through emerging markets seem to be dictating this current development. We would argue that these two factors will prove to be largely transient in terms of implications for the AUD.
While the trade dispute between the US and China could escalate and certainly has further to run, we strongly doubt that a bilateral dispute is likely to spread globally - a view that appears to have driven the recent sharp drop in the AUD. The prospect of the US and China 'dumping' goods on other countries which in turn respond with their own across the board tariffs seems unlikely. Currency markets are currently running on momentum and emotion.
Westpac puts its highest weight on our medium term guidance to customers. We need to be careful not to extrapolate short term movements unless we believe the changes supporting those movements are going to be sustained.
Accordingly we are slightly lowering our end 2018 forecast from USD0.73 to USD0.72 and expect the final adjustment in the profile to USD0.70 to play out through the first half of 2019. However we are not sharply lowering our target low point in AUD - at this stage recent movements look to be an overreaction to fears that will not be franked.
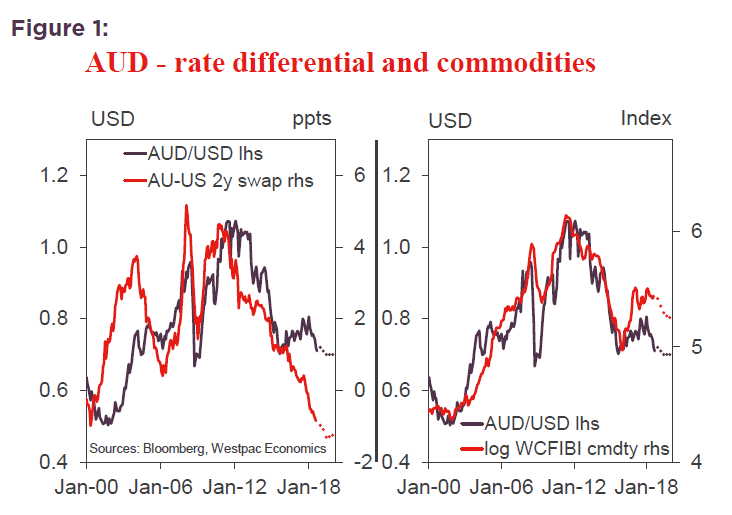
In that regard we point to the outperformance of Australia's basket of commodity export prices. As noted in Figure 1 export prices are running well ahead of the normal relationship with the Australian dollar. That is, on the basis of the export price basket, the Australian dollar looks under-valued. On the other hand there is a looser relationship between the AUD/USD and the AU/US interest rate differential.
Figure 1: points to the AUD falling further given the sharp deterioration in the interest rate differential. Clearly, the commodity factor is offsetting. Our fair value models which seek to balance the relative impact of rates and commodities, favour a stronger relationship with commodity prices and are currently signalling that the net effect has the AUD undervalued.
Risks to our current forecasts centre around Fed policy. Our central view is that the Fed will tighten four more times in this cycle with the tightening cycle coming to an end in June next year. Further Fed hikes in the second half of 2019 would extend that interest rate differential beyond our central view and put additional downward pressure on the AUD even if the basket of export prices holds up.
Nevertheless our central view is that the peak in the USD will be around the June quarter 2019 when the market abruptly shifts to recognising that the Federal Funds rate has peaked. In extending our forecasts through 2020 we believe that the issues driving the AUD/USD cross will be dominated by the USD. With the Fed expected to go on hold by mid-2019, markets moving to price in rate cuts and the US yield curve inverting through 2020, the consequent weakening of the USD should see AUD lifting through 2020 to USD0.75 by year's end.
The week that was
Updates on consumer and business sentiment this week highlight its susceptibility to political and global uncertainty.
For consumer sentiment, up until August, 2018 had been a favourable period, with the headline index remaining above its long-run average of 101.5. However, this changed in September as the index fell back to 100.5 despite persistent strength in the labour market and 4.0% annualised GDP growth through the first half of 2018 - reported early September. In the month, these factors look to have been well and truly offset by political instability and announced increases in mortgage interest rates for all borrowers. The latter comes at an inopportune time for households, with family finances already under pressure from low wage growth; elevated debt levels and rising oil prices. Whereas headline sentiment has been above average this year, the family finance components have remained below throughout - all the more so after a 3.6% fall in these indexes in September. While it doesn't immediately affect household cash flows, declining house prices are also likely weighing on household's financial views. Here there remains considerable uncertainty, with our survey's house price expectations measure down 3.0% in the month and 23% over the year to be 14% below average. It is not surprising then that 'time to buy a dwelling' is also 14% below average at present.
For the business sector, political uncertainty also looks to have shocked sentiment, with NAB's confidence measure falling 3pts in August to a below average read of +4. Confidence was steady in the mining states of WA and Qld, but deteriorated in NSW and Vic. Against this decline in confidence, conditions actually improved in the month, rising +2 to +15 - an elevated level versus history, albeit off the highs seen from late-2017 to April 2018, circa +19. Importantly, the strength in conditions is being seen across all the major states, a situation not seen since 2007. By industry however, conditions remain mixed, with the strongest momentum apparent in mining, construction and manufacturing, and the weakest in consumer-related sectors. On the manufacturing sector, additional detail was provided by our AustChamber-Westpac Survey of Industrial Trends.
Regarding household incomes, the August labour force survey was constructive. Following a 4k decline in jobs in July, employment jumped 44k in August. This result kept the average monthly pace for 2018 around 20k, well below 2017's extraordinary 34k pace but still well ahead of population growth (2.2% in six-month annualised terms versus circa 1.7% for the population). While the unemployment rate was unchanged at 5.3% in the month, the latest quarterly update for underemployment put it at its lowest level since May 2014. This outcome implies labour market slack is being eroded, albeit slowly, providing support for the view that wages growth has troughed. That said, we remain sceptical of the pace at which the remaining slack can be reduced and thus the possible trajectory for wages growth hence.
Moving offshore, sentiment has again been in focus this week. Both the ECB and BOE held to a constructive central view on the outlook while remaining cognisant of the risks. For the ECB, the risks to the outlook remain balanced. On the one hand are the global concerns emanating from trade tensions; emerging markets; and broader financial market uncertainty. On the other however is robust strength in the Euro Area's labour market which is seeing expectations for wages growth firm. On the central view, the growth forecasts of the ECB Governing Council have been edged down, but through 2020 they remain above trend. As such, inflation is expected to head back towards target over that period. Throughout the forecast horizon, there will be no cause to rapidly shift the policy stance.
BOE Governor Carney's reported remarks to a Cabinet meeting seem to have received greater press coverage than the largely as-expected meeting decision statement. Highlighted by the Financial Times were particular concerns over house prices; employment and real incomes, along with the potential inability of the BOE to act to offset a marked economic deterioration from a no-deal Brexit because a reduction in supply would arguably result in inflation pressures, as would a weaker currency. More positively, the current plan of Prime Minister Theresa May was viewed favourably versus the BOE's current base view for Brexit. Hence, if that deal eventuates, there may be upside risks for the UK economy.
To the US then, the week started off on a positive footing after another strong employment report, within which an acceleration in hourly earnings growth was the most notable development. While we believe that the acceleration is likely to remain well contained, at least until remaining labour market slack is worked through, the trend is most certainly up. Late in the week, below expectation producer and consumer price reports for August have highlighted that inflation also remains in hand. We continue to expect the headline CPI measure (2.7%yr) to trend back towards core inflation (2.2%yr) and the PCE measures (2.3%yr and 2.0%yr respectively in July) through the remainder of 2018. Though risks will remain skewed to the upside given the threat of tariffs and Hurricane Florence.
Chart of the week: Market Outlook - emerging markets
In our Market Outlook is an assessment of emerging market developments as they pertain to trade uncertainties and broader concerns regarding financial stability and capital flight. Here we are not focused on Turkey and Argentina, but rather the emerging markets of Asia which are seen as potential contagion risks. In keeping with our expertise and their significance to Australia, the focus is on China and India. The former has weathered significant pressure this past month with little change in its currency. For India, their current account and fiscal deficits have instead resulted in further pressure on the Rupee. In both cases however, underlying economic strength points to resilience to current headwinds that, in time, will become apparent to markets. As a final point, this edition also contains an updated assessment of the Australian outlook to the end of 2020 post Q2 GDP and a timely piece on the Australian housing market focusing on the build-up of unsold stock on the market - a risk to prices in addition to sentiment.
New Zealand: week ahead & data wrap
Not bad at all
A lot of the commentary on the New Zealand economy has turned decidedly gloomy, in part prompted by the plunge in surveyed business confidence. But indicators of real activity actually show a confluence of solid gains over the June quarter. While we think that next week's GDP figures will overstate the case a little, the underlying picture is of an economy that continues to grow slowly but steadily.
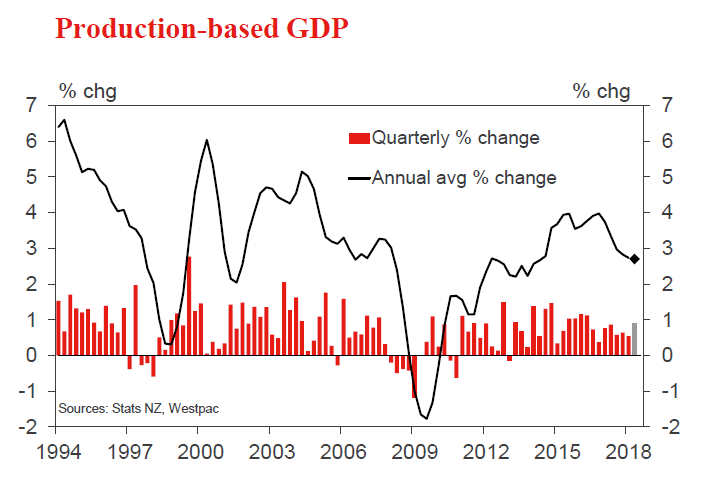
We're expecting next Thursday's GDP release to show a 0.9% rise for the June quarter, following three quarters of subdued growth between 0.5% and 0.6%. Our forecast would see the annual rate of growth hold steady at 2.7%. While the economy doesn't appear to have slowed further this year, it is still well down from its peak growth rate of 4% in 2016.
In part, our forecast reflects some large one-offs in particular sectors, where the impact on GDP is uncertain and is unlikely to be repeated. Hydroelectric power generation rose sharply after a low March quarter, rail freight has rebounded back to where it was before the Kaikoura earthquake, and public sector employment appears to have risen strongly.
However, there is also likely to be a substantial negative impact on growth from temporary shutdowns in oil refining and methanol production. We expect these to knock about 0.2% off June quarter GDP, but this impact will be added back into September quarter growth (where we have revised up our forecast slightly to 0.7%).
Setting aside those temporary influences, recent surveys have pointed to solid growth across a range of sectors. Retail trade rose by 1.1%, building activity was up 0.8%, and wholesale trade rose an estimated 1.6% after adjusting for prices. A strong lift in hours worked in the Quarterly Employment Survey, along with other sectoral surveys, point to strong growth in many of the services sectors.
The manufacturing sector was mixed. Dairy and meat processing saw strong gains compared to a weak March quarter, whereas wine production fell back after a jump in Q1. There was a second quarter of strong growth in machinery and equipment manufacturing, which suggests that businesses are still prepared to invest in their productive capacity.
Our forecast of a 0.9% rise in GDP appears to be at the top of the market range. More notably, it's quite a bit higher than the Reserve Bank's forecast of 0.5% growth in its August Monetary Policy Statement. This difference is important, given the RBNZ's recent comments that it is nearing the trigger point for cutting the OCR. Financial markets have taken this to heart, with interest rate markets giving close to a 50% chance of a cut in the next year, and the New Zealand dollar falling to its lowest levels since early 2016.
How would the RBNZ's thinking be swayed if GDP turned out in line with our forecast? You could argue that June quarter data is quite dated, and that plunging business confidence is signalling a downturn yet to come. Indeed, the RBNZ's own comments seemed to gloss over the June quarter outcome, and focused on the need to see a pickup in growth in the September quarter, as increased government spending and transfers to households kick in.
A better than expected starting point for the economy still matters, and it's unlikely that the RBNZ would be able to dismiss all of a June quarter surprise as temporary. Nevertheless, we're also keeping a close eye on the flow of high-frequency data for any signs that the economy has taken a turn since June. The handful of indicators that we have so far don't point to any change in the economy's momentum one way or another.
Electronic card spending rose by 1% in August, more than we expected. However, that was balanced out by a surprising downward revision to the July figures, which are now reported to be up just 0.2%. The downward revision to fuel spending is curious, given we know that petrol prices increased over the month (including the introduction of Auckland's 10c a litre regional fuel tax), and that fuel spending rose sharply again in August. But averaging out the two months suggests that retail spending continued to grow at around the same pace as in recent months.
August was a mixed month for the housing market. House prices have continued to fall gradually in Auckland, but elsewhere they have risen at a slightly faster pace in the last couple of months. The latter is likely due to the recent decline in mortgage rates, something that we think will continue to support prices in the near future. (Further cuts announced this week have taken some fixed-term mortgage rates down to new record lows). Auckland's underperformance is understandable given the range of new Government policies aimed at dampening housing market speculation, as the Auckland market has tended to have a relatively high proportion of investors.
Elsewhere, the manufacturing sector PMI lifted a little in August, though it still suggests a slower pace of growth this year compared to last year. Measures of job advertisements and traffic volumes also fared well in August. However, these monthly indicators can be very choppy, and it takes some time to discern whether there have been any genuine changes in the trend.
We do think there's a serious chance that the RBNZ decides to cut the OCR sometime in the next year, even without a significant downturn in the economy. Inflation has been stubbornly on the lower side of the RBNZ's inflation target midpoint, and there doesn't seem to be much risk of the economy overheating. However, we think that a stronger starting point for activity, higher near-term inflation (partly due to rising fuel prices) and a bigger than anticipated fall in the exchange rate will be enough to stay the RBNZ's hand for now.
Data Previews
Aus Aug Westpac-MI Leading Index
- Sep 19, Last: +0.55%
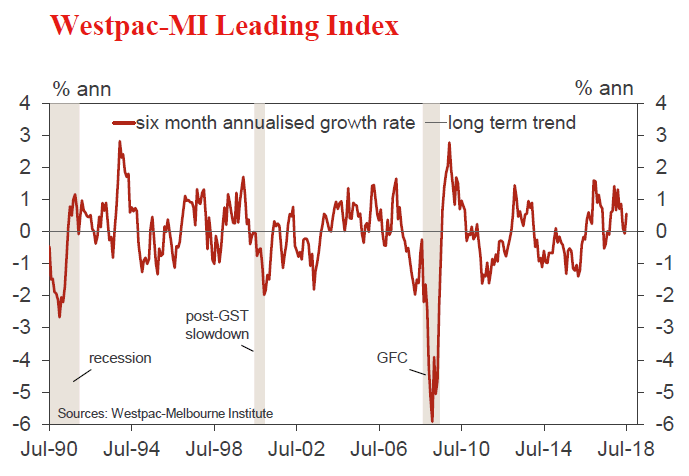
The six month annualised growth rate in the Westpac- Melbourne Institute Leading Index, which indicates the likely pace of economic activity relative to trend three to nine months into the future, rose from -0.06% in June to +0.55% in July. Despite the solid rebound from last month's below trend read, the Leading Index growth rate has still slowed materially since the start of the year, the growth rate peaking at +1.31%in February.
The August read will include a mixed bag of monthly updates. Dwelling approvals (down -5% vs 6.4% last month) and the Westpac-MI Consumer Expectations Index (down -3.2% vs -3% last month) recorded softer reads. Against this, commodity prices (up 1.8% in AUD terms vs -0.3% last month) and the Westpac-MI Unemployment Expectations Index posted solid gains.
NZ Q3 Westpac McDermott Miller Consumer Confidence
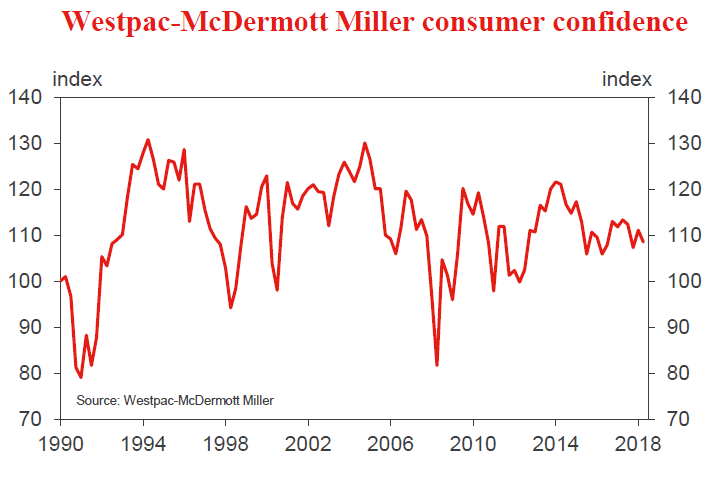
- Sep 19, Last: 108.6
Consumer confidence fell in June, taking it slightly below its long-run average. The drop in confidence was widespread, and consistent with other signs that the edge has come off the economy's upturn. That said, the drop in confidence hasn't been particularly large to date. That speaks to more of a general malaise among households, rather than specific worries about the direction the economy is heading.
The exception to the weaker tone of the June survey was households' perceptions as to whether it's a good time to buy a major household item, which rose for a second quarter.
The September quarter survey will provide a look at how households' spending appetites are faring as the Government's Families Package has been rolled out.
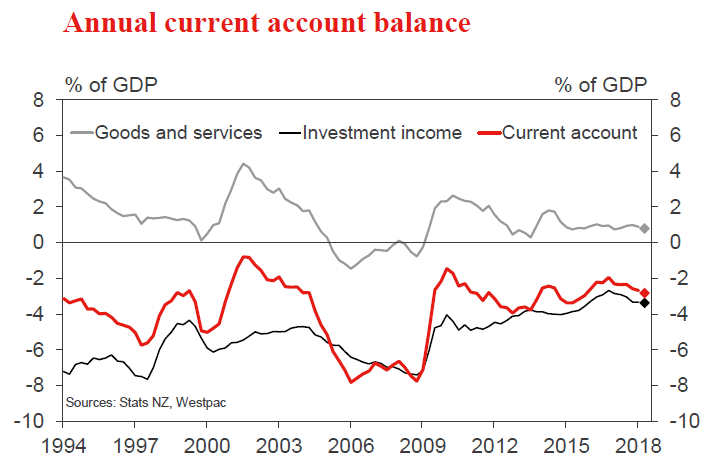
NZ Q2 current account, % of GDP
- Sep 19, Last: -2.7%, Westpac f/c: -2.8%, Mkt f/c: -2.9%
We expect a current account deficit of 2.8% of GDP for the year to June. This represents a slight widening from what we expect to be a revised 2.7% of GDP in March. Annual revisions to the balance of payments have led to a sharp lift in services exports for the last few years.
The goods balance improved in the June quarter as export prices and volumes recovered from a weak March quarter. Imports remain elevated, particularly for plant and machinery. We expect an increase in the investment income deficit, due to higher profits for foreign-owned firms in New Zealand.
The current account deficit remains low relative to history, and current levels support a further improvement in New Zealand's net overseas liabilities position.
NZ Q2 GDP
- Sep 20, Last: 0.5%, Westpac f/c: 0.9%, Mkt f/c: 0.8%
After a few quarters of patchy, subdued growth, the stars seem to have aligned for the New Zealand economy during the June quarter. Recent activity indicators have shown growth ranging from modest to strong across a wide range of sectors. We expect a 0.9% rise in GDP for the quarter.
In part, our forecast reflects some big one-off gains in particular services sectors that are unlikely to be repeated. However, there are also some temporary negatives. Shutdowns in fuel and methanol production will subtract around 0.2% from Q2 growth, but will boost Q3 growth by the same amount.
The Q2 result could have an important bearing on the Reserve Bank's thinking, given its low expectation of 0.5% growth and its recent comments that it is nearing the trigger point for OCR cuts.
Weekly Focus: Wanted – More US Hands
Market Movers ahead
- We look for more stabilisation in the Euro Flash PMI released on Friday.
- On the trade war front, we wait to see whether the US and China re-enter talks or whether Donald Trump implements of a 25% tariff on another USD200bn of imports from China.
- Brexit is set to be in focus as EU leaders meet for an informal Summit in Austria on Thursday-Friday.
- The Fed enters the blackout period ahead of the FOMC meeting on 26 September.
- In Scandinavia, focus turns to the Norges Bank meeting, where we look for the first hike for more than seven years. Minutes from the recent Riksbank meeting will also be scrutinised.
Global macro and market themes
- The tight US labour market is a rising risk to growth.
- The US-China trade war is set to escalate further before a deal is reached.
- Emerging market assets are cheaper but there are still short-term risks.
Sunset Market Commentary
Markets
US Treasuries and core EGB’s remained under pressure from the start of trading this morning and the decline persisted throughout the session. US yields rose 2.1 bp (2y) to 2.8 bp (30-y) with the 10-yield almost touching the 3.0% barrier. US eco data (retail sales production) were mixed and were no decisive factor for bond trading today. Several US Fed governors gave their view on monetary policy and on the economy. Comments from Fed’s Evans did catch the eye as he indicated it is time to return to a more conventional monetary policy. This is in line with strong fundamentals for growth and with inflation developing in line with the symmetric 2% target. German yields followed to a large extent the development of US treasuries. The German yield curve bear steepens with 2-year yields rising 0.1 bp while 10/30-y yields are rising close to 3 bp.
The dollar started the session on a soft footing as global sentiment on risk remained positive and as tensions on emerging markets eased further. Yesterday’s rather upbeat comments of ECB’s Draghi apparently also still encouraged euro bulls. EUR/USD filled bids in the 1.1720 area mid-morning in Europe, but a real test of the 1.1733 intermediate resistance didn’t occur. US August retail sales disappointed, but July sales were upwardly revised. The dollar tried a shy down-move upon the release, but the topside in EUR/USD proved tough. USD bulls soon came again in control. Some hawkish comments from Fed’s Evans and a rise in short term US yields maybe also helped to tilt the balance in favour of the US currency. EUR/USD is changing hands in the 1.1660 area. USD/JPY still struggles to regain the 112 big figure in a sustainable way.
In line with recent price action, the EUR/GBP cross rate held a rather tight sideways range in the 0.89 area. The intraday price action was again haunted by Brexit comments from different sources. BoE’s Carney repeated in a speech in Dublin that the Bank is prepared for ‘whatever path the economy takes, including a wide range of potential Brexit outcomes’. However, also this ‘whatever it takes commitment’ from the BoE Chairman also able to provide a clear directional guide for EUR/GBP trading (currently near 0.8910). Cable (1.3090 area) returns back below the 1.31 mark.
News Headlines
Swedish August CPIF inflation declined -0.2% M/M resulting in an unchanged Y/Y reading (2.2%). The market expected a modest rise to 2.3%. The soft inflation report weighed on the Swedish Crown as markets questioned whether the Riksbank would be able to raise rates in December or February next year, as indicated.
Growth in US retail sales slowed in August to 0.1% M/M, the smallest gain in six months. Amongst others, a decline in motor vehicle sales was to blame. However, the July figure presented a substantial upward revision from 0.5% M/M to 0.7% M/M. So, the data suggest an ongoing solid contribution from private consumption to Q3 US GDP growth. US August industrial production was slightly stronger than expected at 0.4% M/M. July rise was upwardly revised from 0.1% to 0.4% M/M.
Today, the Central bank of Russia unexpectedly raised its policy rate by 0.25% to 7.50 %.It was the first increase of the policy rate since 2014. The policy statement indicated that the Bank will consider further increases in the policy rate. The bank will also will continue to suspend foreign exchange purchases until the end of the year.
US: August Retail Sales Slump Is Offset by Upward Revisions
Take the disappointing print for August retail sales with a grain of salt. Prior data got a boost from revisions. There is legitimate weakness in auto sales, but aside from that consumer spending is still on track in Q3.
Nobody on the Road, Nobody on the Beach
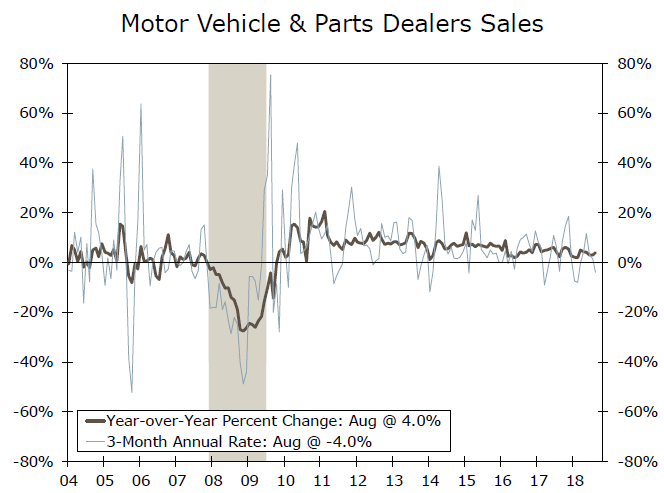
Motor vehicle sales comprise roughly one fifth of all consumer spending in the retail sales report and this category has been a weak link in recent months, particularly here with this 0.8% decline in August. It marks the third straight monthly decline for autos. In separately reported data, we had already learned that sales from auto manufacturers to dealers declined in both July and August, which in this case at least alleviates concern about too much old inventory on dealer lots.
Going into today's report one theme that had been underpinning the solid retail sales numbers had been consumers' increased proclivity to spend on experiences. In the three months leading up to this report, spending at bars and restaurants increased by 1.6% or more each month. Spending in this category still picked up in August, but the 0.2% increase was small by comparison to recent momentum.
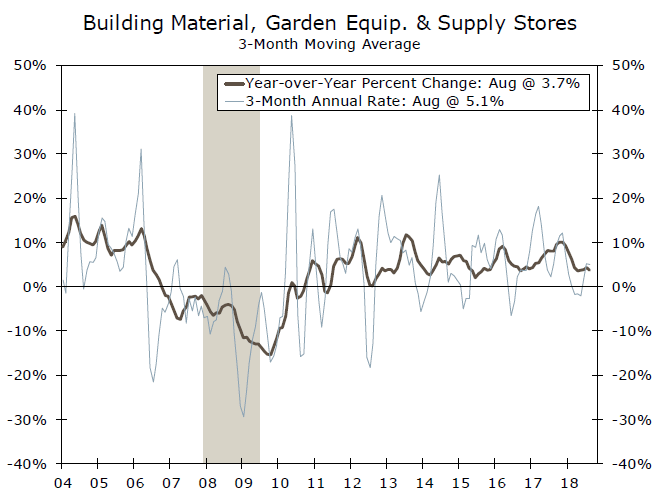
Clothing store sales (down 1.7%) and department store sales (off 1.0%) also gave back most of the increase reported in the prior month. Sales stalled at stores that provide building materials and garden supplies with virtually no change in this category for August; that follows a scant 0.1% increase in the prior month. With Hurricane Florence currently lashing the Carolinas and bringing potentially damaging rain and winds across the East coast, there is scope for this category to drive growth in retail sales in the months ahead…at least potentially. For that to actually happen, the increased storm-related spending would have to outpace the gains in prior years, which have also seen lots of storm activity.
Don't Look Back, You Can Never Look Back
While today's report was broadly disappointing, there were significant upward revisions to prior data, which on balance suggest that consumer spending is still on track to be supportive of GDP growth in the third quarter. The headline print of 0.1% was well short of the 0.4% that had been expected, but July's initially reported 0.5% gain was bumped up to 0.7% in the revision.
The revisions were even more pronounced for control group retail sales, which offer a better early read for the consumption figures in the GDP report. This category was also up just 0.1%, but the revision lifted the prior month's increase to 0.8% from 0.5%.
Smiling at Everyone
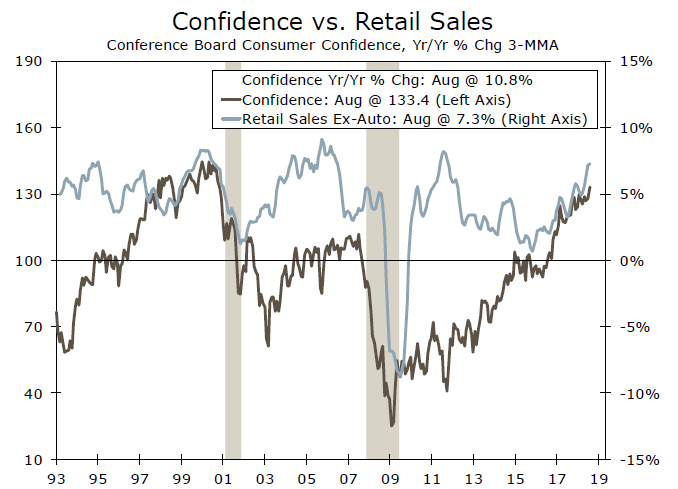
The boost from tax cuts will eventually start to fade for consumers and this is occurring amid rising prices and only modest wage growth, at least for now. The silver lining to all that is that measures of consumer confidence still remain at or near levels last seen roughly 17 years ago. This gives us a degree of confidence in our forecast for solid consumer spending in the second half.