

Sample Category Title
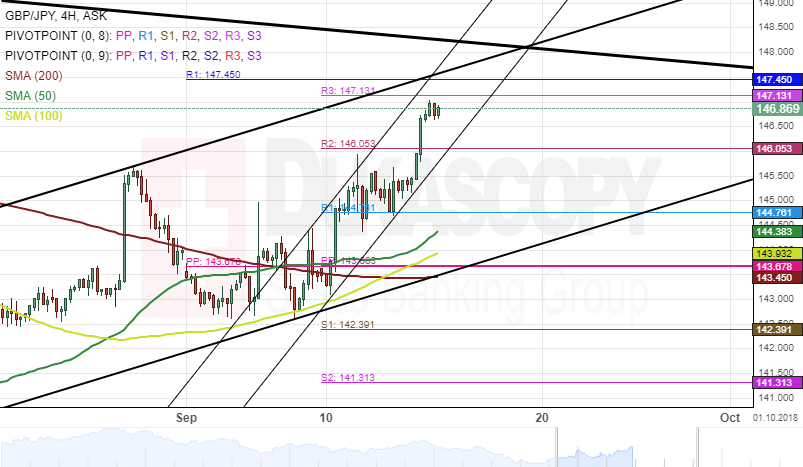
GBP/JPY 4H Chart: Sets For Breakout
The British Pound versus the Japanese Yen has been trading in an ascending channel for the last one month. This pattern was formed when the currency pair reversed from a support cluster formed by the combination of the weekly and the monthly pivot points at the 140.19 marks.
The bullish sentiment has sent the exchange rate towards the upper boundary of the junior ascending channel pattern, and it is likely to break the channel during the coming days.
The potential target for the GBP/JPY currency exchange rate in the short-term could be the upper border of a dominant descending channel at 148.00.
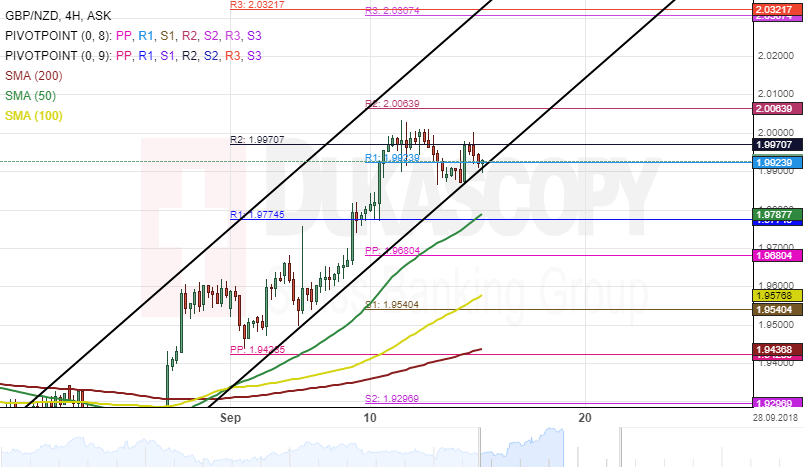
GBP/NZD 4H Chart: Targets At 2.03
The Pound Sterling has increased its trading range significantly against the New Zealand Dollar. This movement has been constrained in a junior ascending channel pattern.
The currency pair reached a nine-month high mark of 2.00 during Thursday's trading session. This appreciation has pushed technical indicators in the overbought zone. Bearish sentiment could drive the rate lower towards the 50-hour SMA during the following trading sessions.
By and large, it is likely that the GBP/NZD continue its upward momentum in the short-term. The likely target for bull's traders could be a resistance cluster at 2.03
Prospect Of Sino-US Talks Lifts Markets
- China open to US invitation for trade talks;
- Carney appears in Dublin after fresh Brexit warning;
- Lira steadies after CBRT hike but significant risks remain.
It's been a more positive start to trading on Friday, with talks of new Sino-US trade talks potentially helping to lift risk appetite among investors.
Stocks in Asia ended the week on a high, with major indices recording gains of around 1% and those in Europe up by a slightly more modest 0.3% or so. US futures are roughly tracking those gains in Europe which potentially highlights the increased risk of a trade war for Asian markets compared to Europe and the US at the moment. Still, with Trump also apparently preparing to announce the next $200 billion of tariffs on China, who are responding with closer ties with US foe Russia, we are clearly not currently close to a resolution.
The US economy has been gathering positive momentum despite the risk of a trade war and today's retail sales data is expected to provide further evidence of that, with spending expected to have risen by 0.4% last month. This would continue the steady trend of rising sales over the course of the year as consumers spend the additional income that tax cuts afforded them thanks to last year's reforms.
Mark Carney is due to speak in Dublin this morning which is sure to attract some attention, coming a day after the Bank of England kept interest rates on hold and, arguably more interestingly, the Governor risk the wrath of Brexiteers with more gloomy predictions. Carney met with the cabinet on Thursday and laid out what the bank considers to be a worst case no deal Brexit scenario, which included house prices falling by 35%, something Brexiteers will be keen to stress is more project fear from a closet remainer.
I think there's a good chance that Carney steers clear of Brexit forecasts when possible in the coming months for fear of being seen as interfering in the process. The central bank may also be planning a similar approach after raising interest rates last month and giving itself the freedom to take a step back now for the rest of the year.
The actions by the CBRT on Thursday appears to have had the desired effect for now, with the lira having since stabilized at around six to the dollar, which is still extremely high compared to earlier in the year but around 15% off its peak a month ago. While inflation is still expected to continue to rise from around 18% currently and the economy could face a tough recession, the moves by the central bank may prevent a much greater crisis.
The question now is whether President Recep Tayyip Erdogan will be willing to accept the central bank going against his wishes and raising interest rates, or whether he's going to seek to control the central bank as well which could have devastating effects. We may have some stability in the near-term, which is welcome, but I have little confidence that this will last and feel a lot more needs to be done to reassure investors.
EURUSD Forms Bullish Pattern
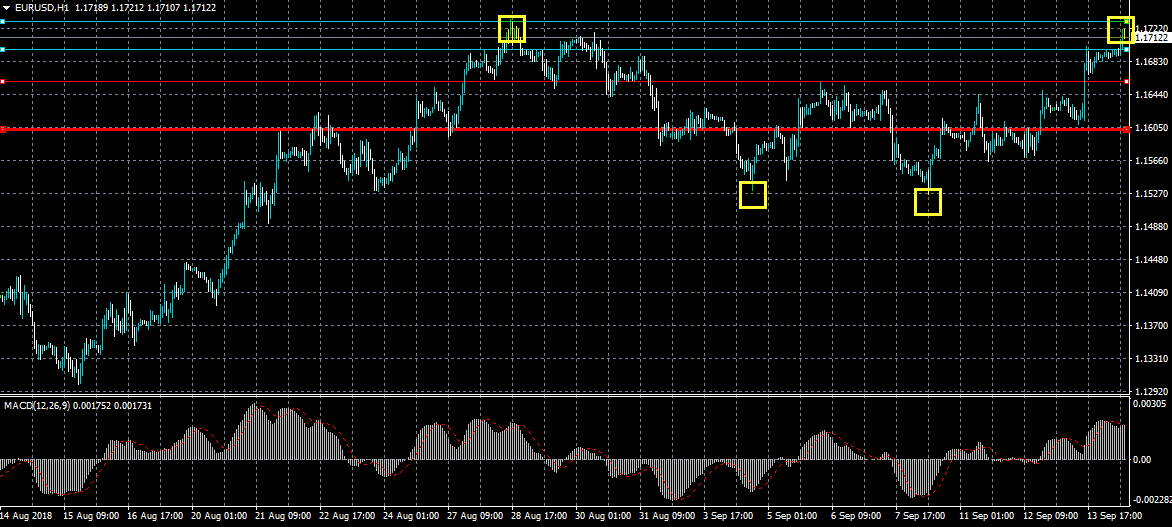
The euro has broken above the 1.1700 level against the US dollar during the European trading session, with the price falling just short of the 1.1730 resistance level. The EURUSD pair has now created a bullish inverted head and shoulder pattern, with a sizeable upside projection. Buyers will look to break the 1.1730 level, while sellers will need to push the EURUSD below the 1.1650 level to change the short-term sentiment.
The EURUSD pair is strongly bullish while trading above the 1.1700 level, key resistance is now located at the 1.1730 and 1.1790 levels.
If the EURUSD pair moves below the 1.1700 level, sellers may test towards the 1.1670 and 1.1650 support levels.
GBPUSD Strongly Bullish Above 1.3100 Level
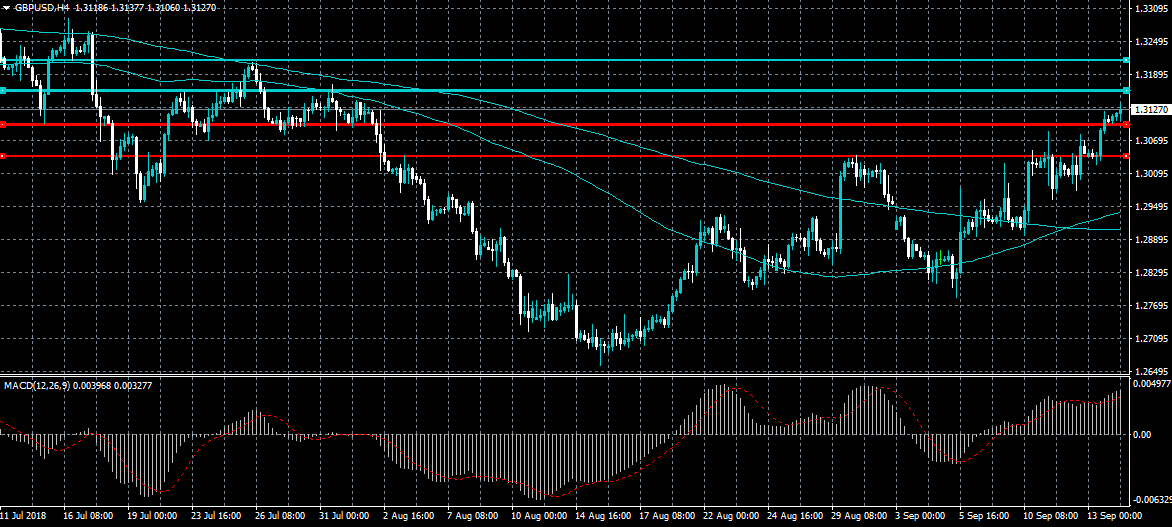
The British pound has risen to its highest trading level against the greenback since August 1st, hitting 1.3135, as the US dollar continues to fall over softer inflation data from the American economy. The GBPUSD pair is strongly bullish while trading above the 1.3100 level and now await a scheduled speech from the Bank of England Governor Mark Carney. Buyers will likely target the 1.3200 level, while sellers will need to break the 1.3100 level.
The GBPUSD pair is strongly bullish while trading above the 1.3100 level, key resistance is found at the 1.3155 and 1.3200 levels.
If the GBPUSD pair moves below the 1.3100 level, key intraday support is found at the 1.3080 and 1.3040 levels.
DAX Gains Ground As Investors Upbeat After ECB Meeting
The DAX index has posted gains in the Friday session. Currently, the index is at 12,092, up 0.30% on the day. On the release front, the eurozone trade surplus was dismal, dropping to EUR 12.8 billion, well short of the estimate of EUR 16.3 billion. This was the lowest surplus since July 2014.
There were no surprises from the ECB policy meeting, as policymakers held the course, keeping the benchmark rate at 0.00%. However, there were some noteworthy items at the meeting. In a slight change to guidance, the Bank announced that it would wind up asset purchases at the end of this year. As well, the ECB will trim its monthly bond purchases from EUR 30 billion to 15 billion, starting in October. These measures mark a vote of confidence in the eurozone economy, which has softened in the second quarter, but still remains solid. The euro moved higher on the news, and the currency has enjoyed a strong week, with gains of 1.4 percent. The ECB reiterated that it will maintain monetary policy “through next summer”, so there is little chance of a rate hike before the second half of 2019. The Bank also revised downwards, albeit slightly, its growth forecast – the previous forecast of 2.1% growth in 2018 and 1.9% in 2019, was lowered to 2.0% and 1.8%. The ECB is predicting that inflation will remain steady at 1.7% through 2020, which meets the ECB target of slightly below the 2% level.
German ZEW economic surveys are well respected and often have an impact on the movement of the euro and German stock markets. Earlier in the week, ZEW Economic Sentiment improved in September, but remains mired in negative territory. The indicator came in at -10.6, posting a decline for a sixth straight month. The survey press release noted that during the survey period, Turkey and Argentina saw their currencies plunge, and German industrial production was soft. On Thursday, German Final CPI dipped to 0.1%, down from 0.3% a month earlier.
Brent Oil – 50-Day MA Being Testing| Gold – Bulls Repossessing Control
Gold – Bulls repossessing control
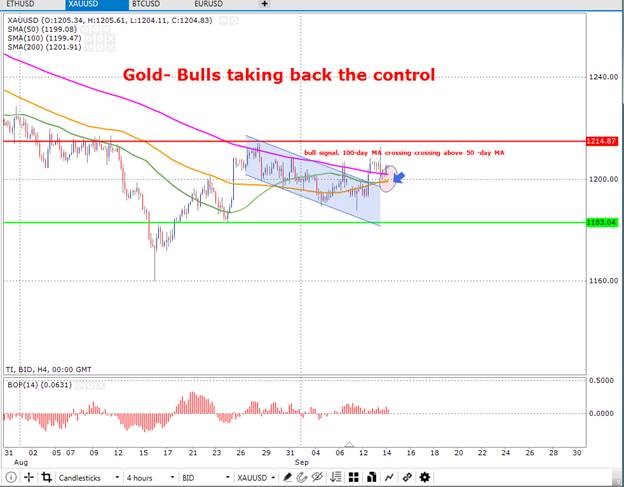
The chart below on an intra-day time frame (4 hours) shows gold trading in an uptrend. Moreover, the price is currently trading above all moving averages where additionally, it is displayed below that the 100-day moving average seems to be performing a cross over above the 50-day moving average which lets off a strong bullish signal. In result, this may allow the price to continue trading towards the resistance zone (colored in red) which is priced at $1214.87. On the other hand, if the price starts to decline where the bears take over, then the price may move in the direction of the support zone (shown in horizontal green line) which is priced at $1183.04.
The Balance of Power chart below confirms the bullish momentum which is present in the markets for gold. However, the chart shows a variety of highs and lows, but at present the price looks to be in bull territory. Nevertheless, this is not to say this will always be the case.
Major support: 1183.04
Major resistance: 1214.87
Brent oil – 50-day MA being testing
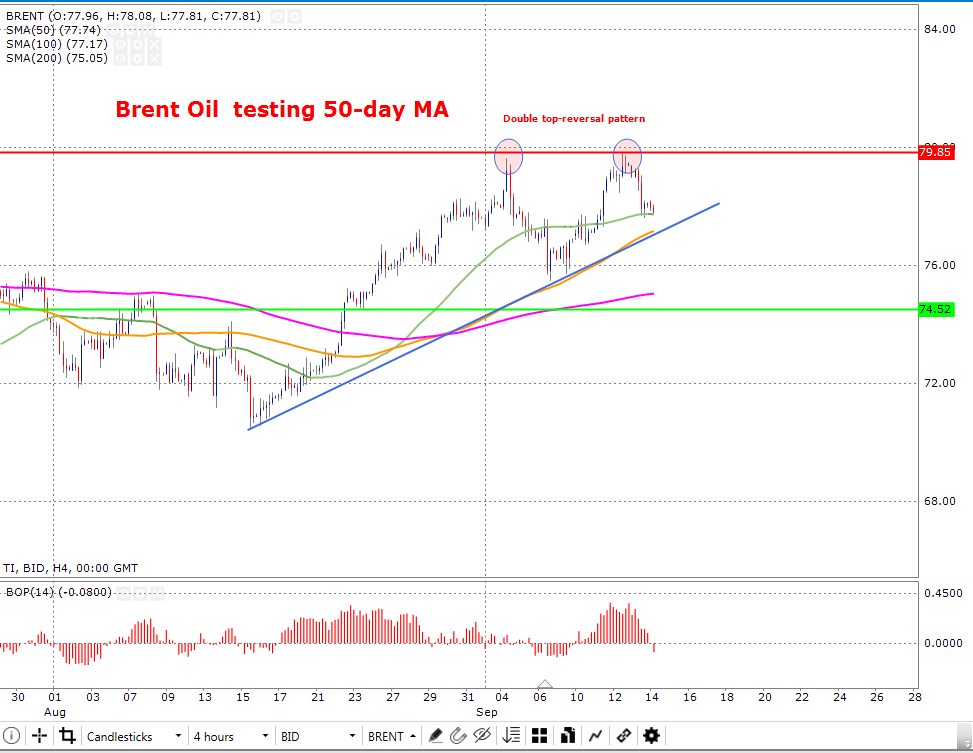
The chart below on an intra-day time frame (4 hours) shows Brent crude oil trading in an uptrend where the price is testing the 50-day (coloured in green) moving average. It is displayed that the price had encountered two double top reversal patterns which is clearly displayed in the chart as transparent circles. Moreover, this is most commonly known as a reversal pattern which informs a potential correction.
If the price experiences an increase in price, then oil may trade towards the resistance zone (shown in horizontal red line) which is priced at $79.85. In addition, this is where the two-previous double top reversal patters had taken place. On the other hand, if the price declines where a bearish momentum would be present, then the price may trade towards the support zone (shown in horizontal green line) which is priced at $74.52.
The Balance of Power chart below shows that the bears have gained strength and are currently in control. Nevertheless, it is also displayed that the bulls had a long win streak. However, dependent upon the outcome of the price testing the 50-day moving average shown below may determine which side of the markets will hold dominance.
Major support: 74.52
Major resistance: 79.85
The Analytical Overview Of The Main Currency Pairs
The EUR/USD currency pair
Technical indicators of the currency pair:
Prev Open: 1.16251
Open: 1.16891
% chg. over the last day: +0.56
Day's range: 1.16864 – 1.17142
52 wk range: 1.0571 – 1.2557
The ECB, as expected, kept the main parameters of monetary policy at the same level. The regulator worsened the forecast for GDP growth for 2018-2019, and also expressed concern about the trade conflict and the unstable situation in the markets of developing countries. The US published a weak inflation report, which caused pressure on the US currency. Yesterday, the bullish sentiment prevailed on the EUR/USD currency pair. The growth of quotes exceeded 70 points. At the moment, the trading instrument is consolidating in the range of 1.16850-1.17150. The EUR/USD currency pair has the potential for further growth. Positions should be opened from the key levels.
The news feed on 2018.09.14:
At 15:30 (GMT+3:00) we expect a report on retail sales in the US.
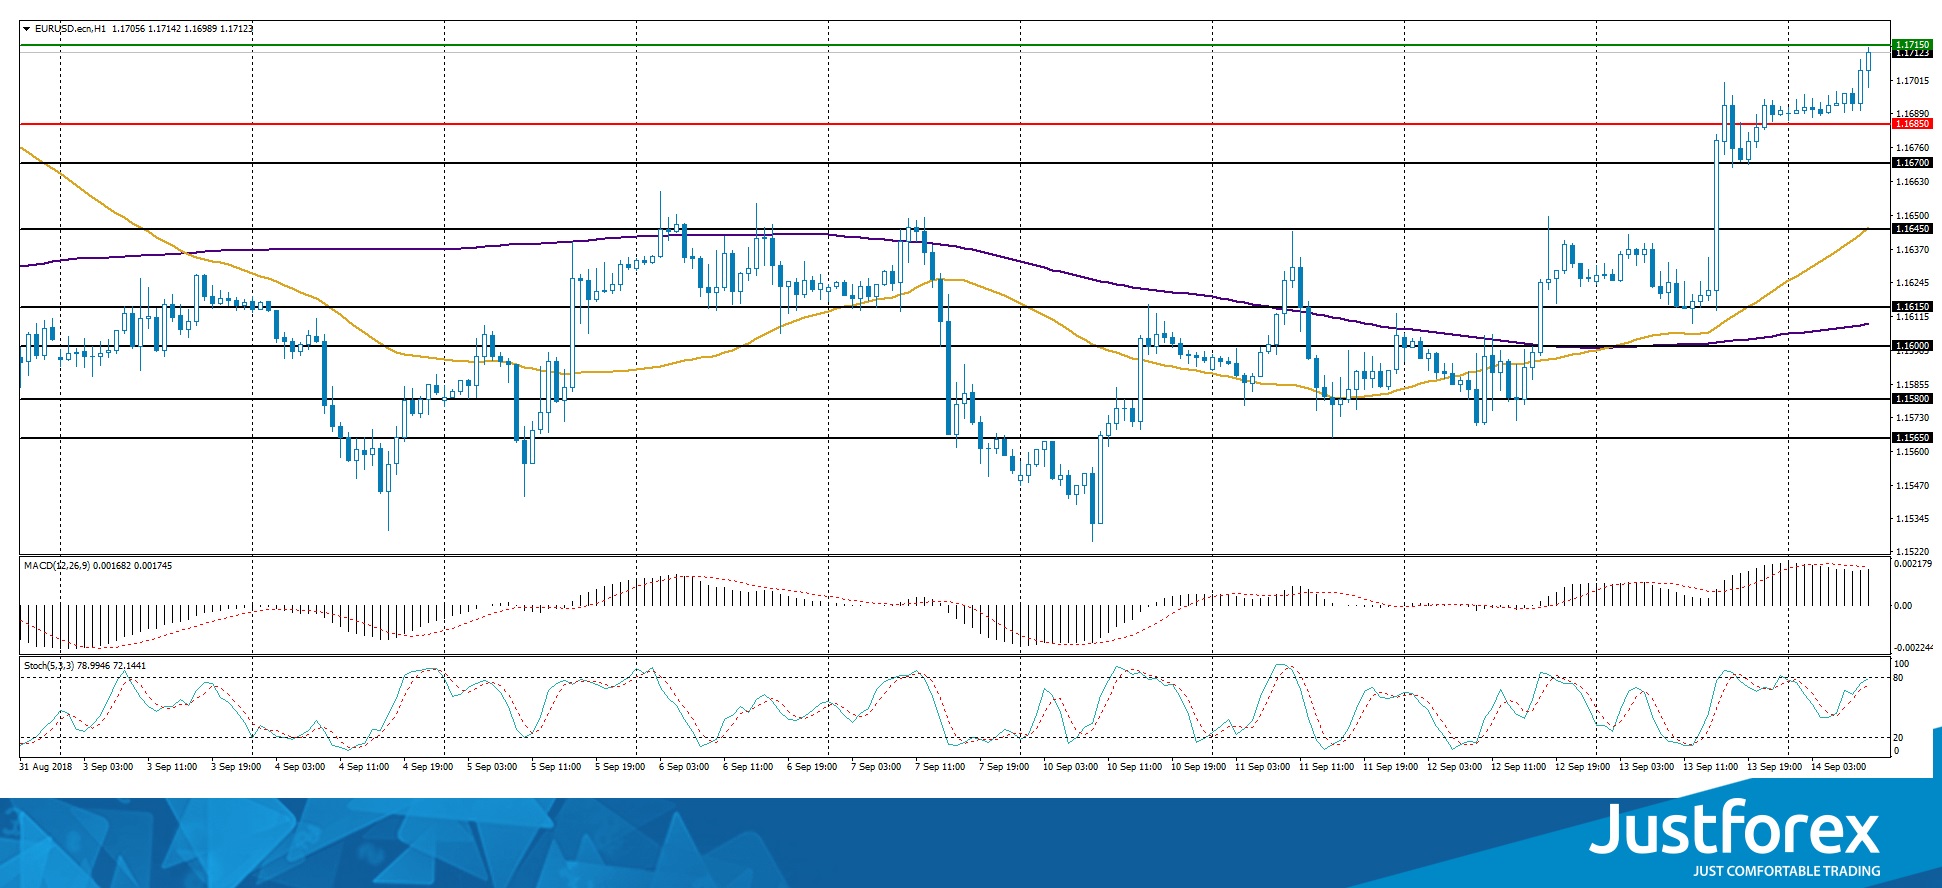
Indicators point to the power of buyers: the price has fixed above 50 MA and 200 MA.
The MACD histogram is in the positive zone and continues to rise, which indicates the bullish sentiment.
Stochastic Oscillator is located near the overbought zone, the %K line is above the %D line, which gives a weak signal to buy EUR/USD.
Trading recommendations
Support levels: 1.16850, 1.16450, 1.16150
Resistance levels: 1.17150, 1.17500
If the price fixes above the resistance level of 1.17150, further growth of the EUR/USD quotes is expected. The movement is tending to 1.17500-1.17750.
An alternative may be the decrease of the EUR/USD currency pair to 1.16850-1.16700.
The GBP/USD currency pair
Technical indicators of the currency pair:
Prev Open: 1.30379
Open: 1.31061
% chg. over the last day: +0.48
Day's range: 1.31021 – 1.31313
52 wk range: 1.2361 – 1.4345
The GBP/USD currency pair shows positive dynamics. Yesterday, the growth of quotes exceeded 75 points. The Bank of England, as expected, kept the range of the key interest rate at the previous level of 0.75%. At the moment, the key support and resistance levels are: 1.30850 and 1.31350, respectively. The trading instrument has the potential for further growth. Positions should be opened from the key levels.
At 13:00 (GMT+3:00) the speech by the Bank of England governor Carney will take place.
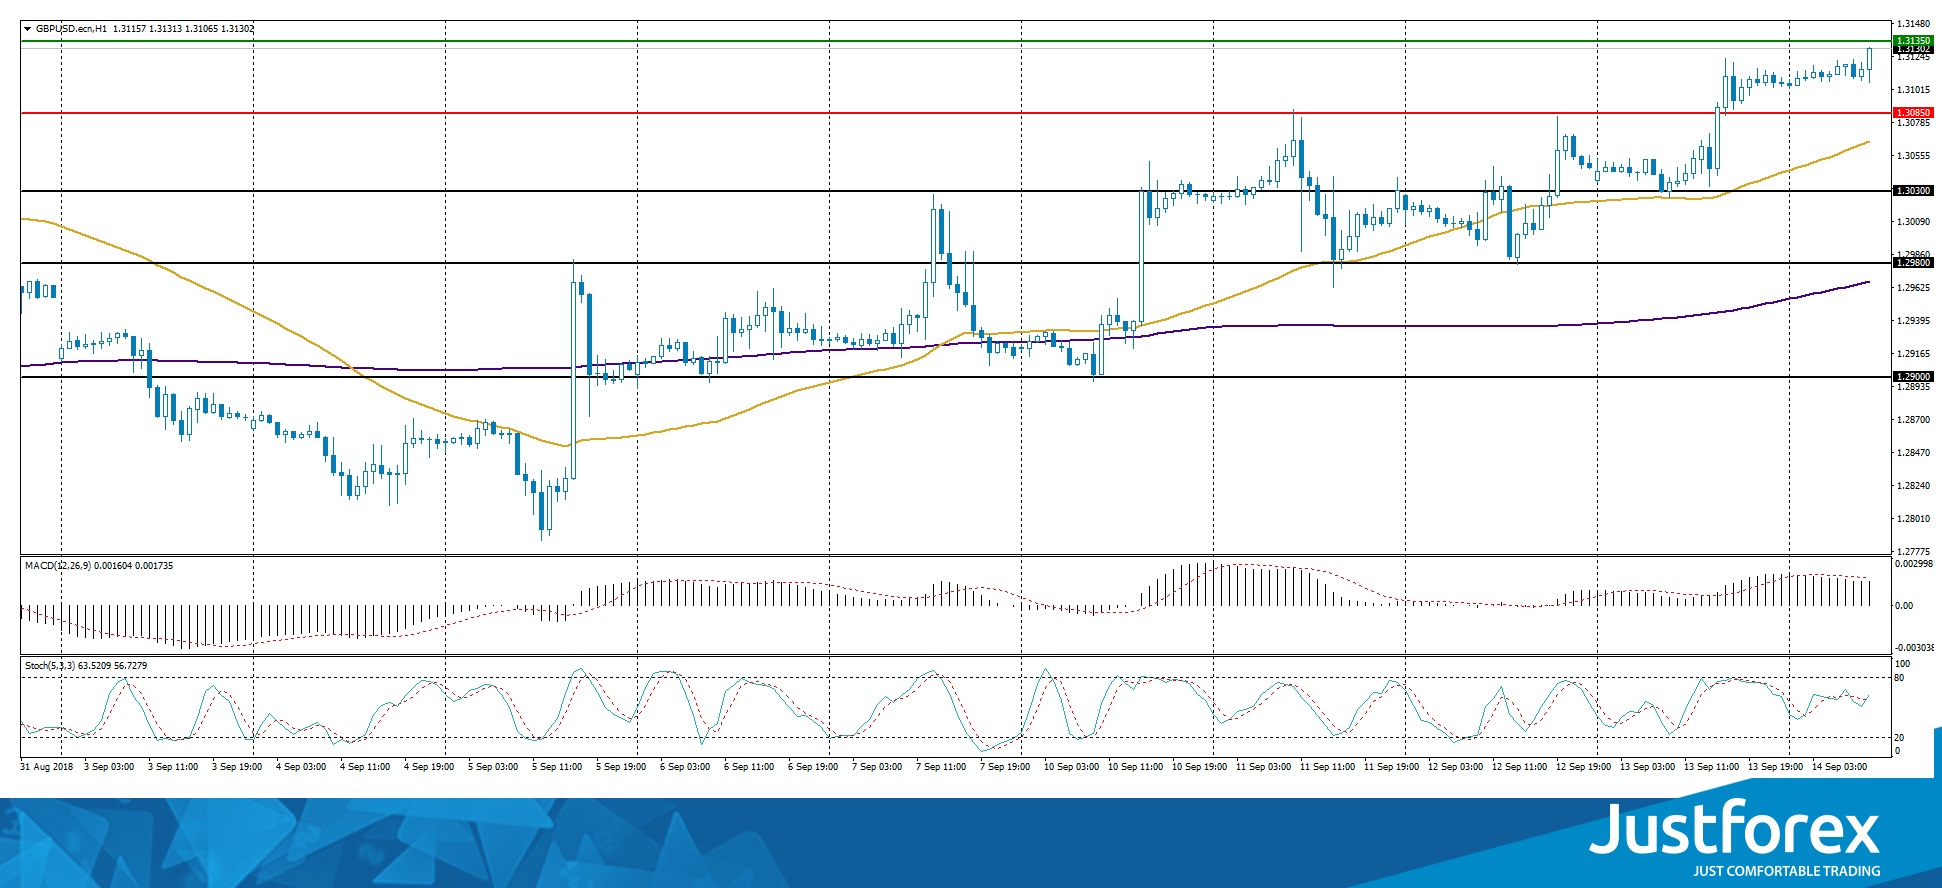
The price has fixed above 50 MA and 200 MA, which signals the power of buyers.
The MACD histogram is located in the positive zone, but below the signal line, which gives a weak signal to buy GBP/USD.
Stochastic Oscillator is in the neutral zone, the %K line has crossed the %D line. There are no signals at the moment.
Trading recommendations
Support levels: 1.30850, 1.30300, 1.29800
Resistance levels: 1.31350, 1.31600
If the price fixes above the resistance level of 1.31350, further growth of the GBP/USD quotes is expected. The movement is tending to 1.31600-1.31750.
An alternative may be the decrease of the GBP/USD currency pair to 1.30850-1.30750.
The USD/CAD currency pair
Technical indicators of the currency pair:
Prev Open: 1.29927
Open: 1.29937
% chg. over the last day: +0.07
Day's range: 1.29827 – 1.30075
52 wk range: 1.2059 – 1.3795
At the moment, the USD/CAD currency pair is consolidating. A unidirectional trend is not observed. Financial market participants expect additional drivers. The trading instrument is testing local support and resistance levels: 1.29850 and 1.30200, respectively. The USD/CAD quotes have the potential for further decline. We recommend monitoring the current information regarding NAFTA negotiations.
The news feed on the economy of Canada is calm.
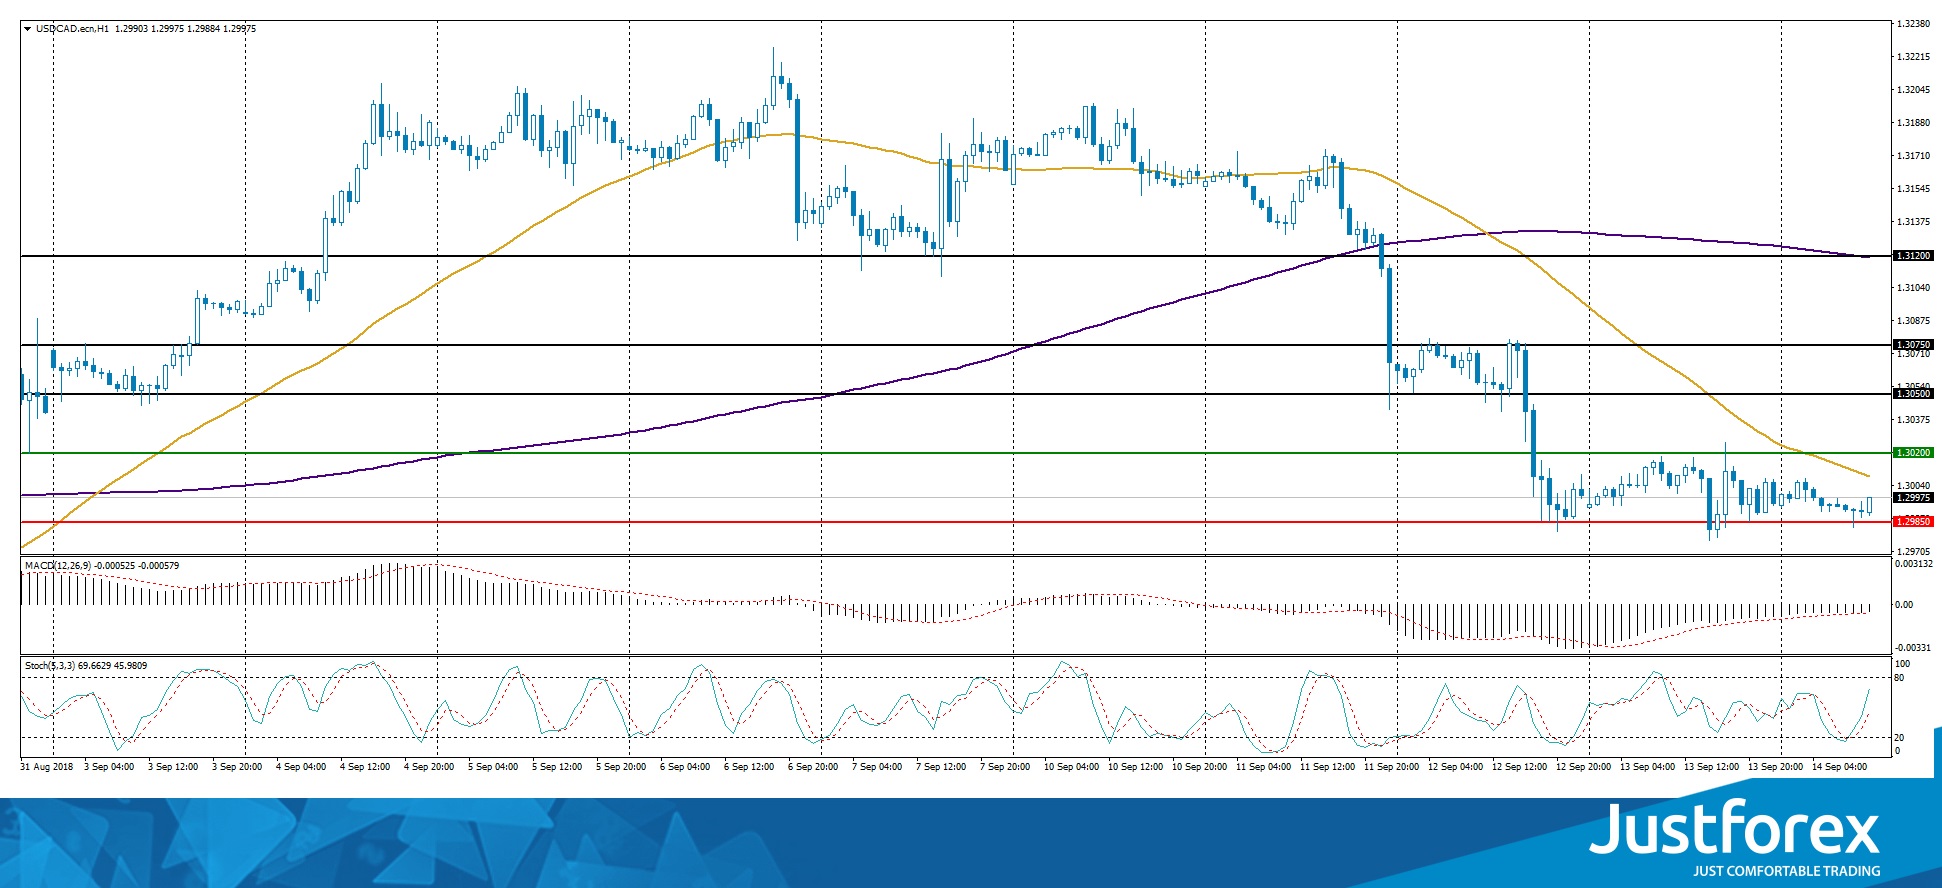
The price has fixed below 50 MA and 200 MA, which indicates the power of sellers.
The MACD histogram is in the negative zone, but above the signal line, which gives a weak signal to sell USD/CAD.
Stochastic Oscillator is in the neutral zone, the %K line is above the %D line, which indicates the bullish sentiment.
Trading recommendations
Support levels: 1.29850, 1.29500, 1.29200
Resistance levels: 1.30200, 1.30500, 1.30750
If the price fixes below the local support of 1.29850, the USD/CAD quotes are expected to fall. The movement is tending to 1.29500-1.29200.
Alternative option. If the price fixes above the 1.30200 mark, it is necessary to look for entry points to the market to open long positions. The target movement level is 1.30500-1.30750.
The USD/JPY currency pair
Technical indicators of the currency pair:
Prev Open: 111.259
Open: 111.921
% chg. over the last day: +0.68
Day's range: 111.786 – 112.077
52 wk range: 104.56 – 114.74
Yesterday, aggressive purchases of USD/JPY were observed. The growth of quotes exceeded 70 points. At the moment, the trading instrument is moving in flat. Local support and resistance levels are 111.800 and 112.100, respectively. The positions should be opened from these marks. We recommend paying attention to the news feed on the US economy.
The publication of important economic reports from Japan is not planned.
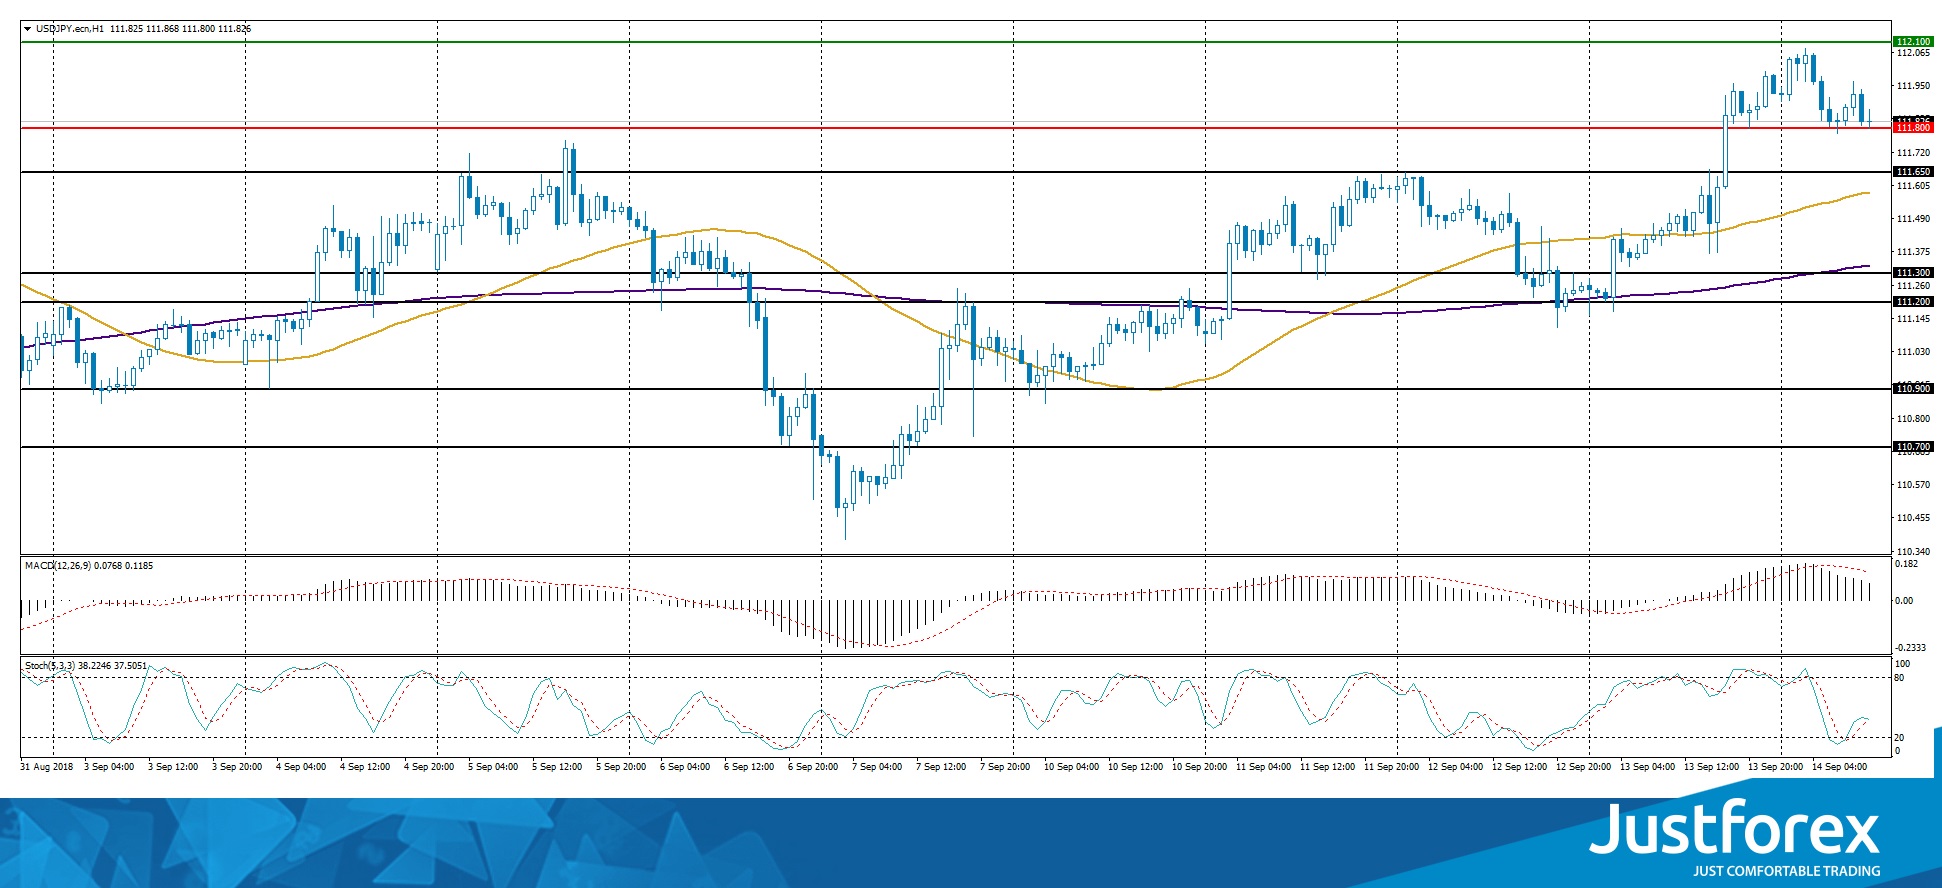
The price has fixed above 50 MA and 200 MA, which signals the power of buyers.
The MACD histogram is located in the positive zone, but below the signal line, which gives a weak signal to buy USD/JPY.
Stochastic Oscillator is in the neutral zone, the %K line is crossing the %D line. There are no signals at the moment.
Trading recommendations
Support levels: 111.800, 111.650, 111.300
Resistance levels: 112.100, 112.500
If the price fixes above the resistance level of 112.100, further growth of the USD/JPY quotes is expected. The movement is tending to 112.500-112.750.
Alternative option. If the price fixes below the level of 111.800, we recommend looking for entry points to the market to open short positions. The target movement level is 111.500-111.300.
EURAUD Eases Slightly After Printing 3-Year High
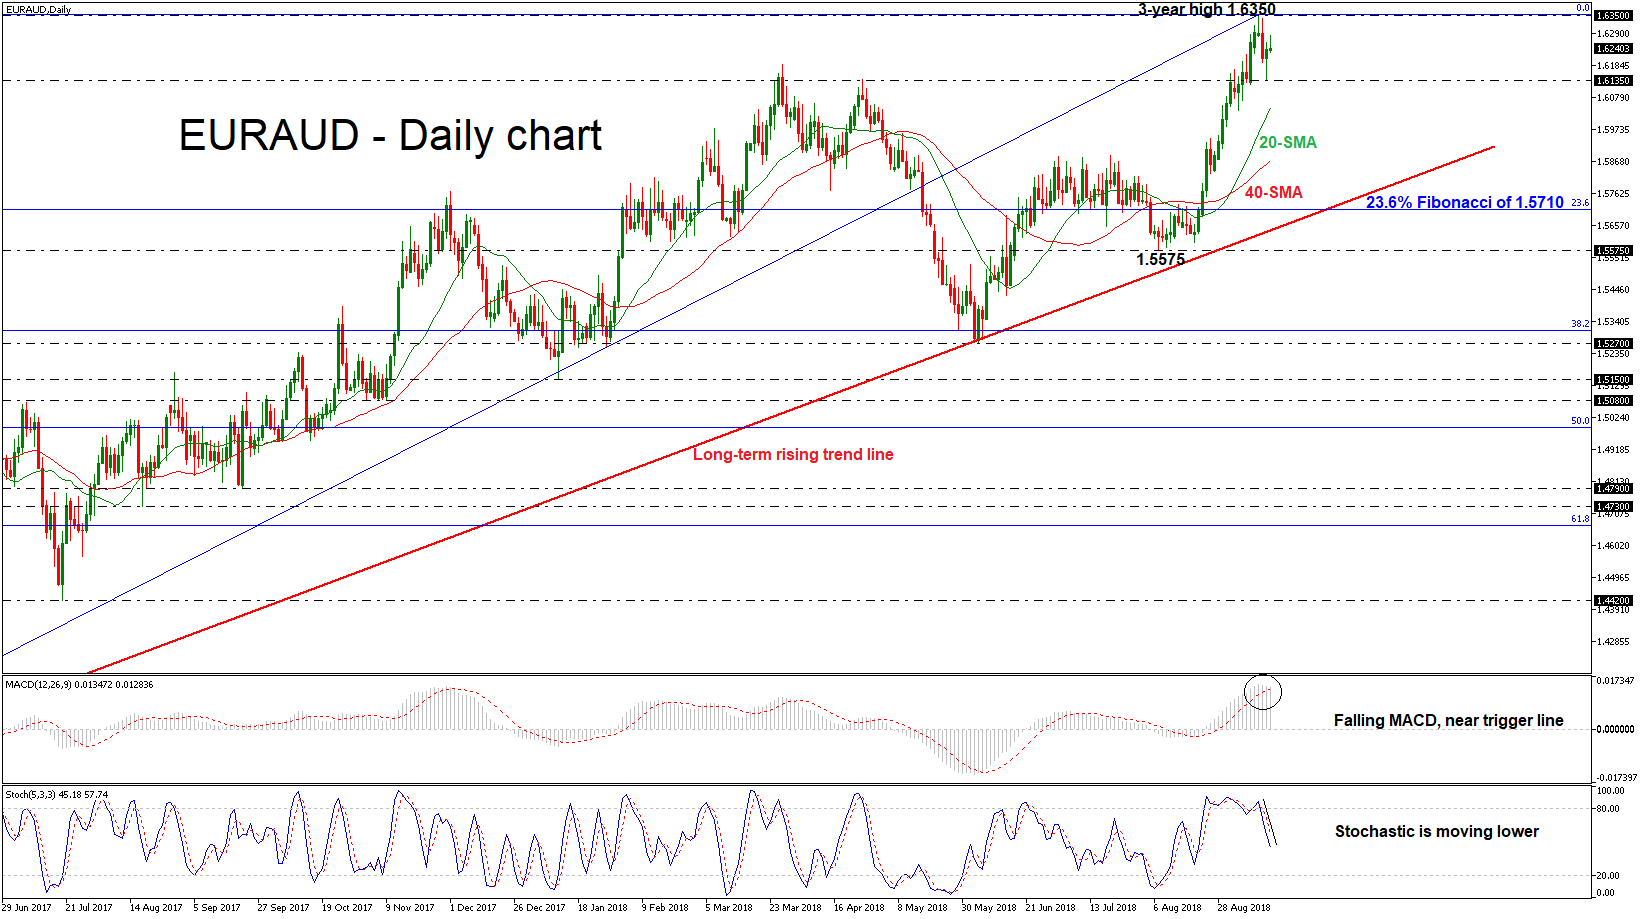
EURAUD recorded a stunning rally over the last five weeks, while on Tuesday it completed a fresh three-year high of 1.6350. This week, though, the pair is on the backfoot and the technical indicators suggest that the market could ease a little bit in the short-term.
The MACD is currently increasing negative momentum as it falls towards its trigger line, hinting that the next move in prices could be on the downside rather than on the upside. The bearish signals are even stronger from the stochastic oscillator as the blue % K line has finally formed a bearish cross with the red %D line and both are heading lower.
Should prices decline, immediate support could be found around the 1.6135, yesterday’s low. A close below this level could endorse the scenario for negative pressure and could challenge the 20- and then the 40-simple moving average (SMA) at 1.6046 and 1.5871 respectively in the daily chart. If there is a drop below these levels, the next stop could be at the 23.6% Fibonacci retracement level of the upleg from 1.3625 to 1.6350, near 1.5710.
However, if the pair continues the previous weeks’ aggressive bullish rally, immediate resistance could be met at the 1.6350 high. Above this level, the next barrier for investors to have in mind is the 1.6590, identified by the top on August 2015.
In the medium term, the bullish outlook remains intact, with the moving averages all pointing upwards. However, should prices decline towards the SMAs, this would risk shifting the short-term picture to bearish.
Will The Fed Slow Interest Hikes?
USD in the doldrums as inflationary pressures fade away
Even though central banks’ meetings took centre stage yesterday, investors were also keeping an eye on key economic data from the US. The August inflation report was released yesterday and came in slightly below market expectations. Headline inflation eased to 2.7%y/y versus forecast of 2.8% and 2.9% in the previous month. The surprise came from the core measure as inflation excluding food and energy components printed at 2.2%y/y versus 2.4% expected (and previous month read).
The market reaction was quite strong; especially as investors didn’t pay much attention to economic data lately and rather focus on the US-China trade conflict. EUR/USD jumped 0.75% to 1.17, the highest level since August 27, and continued to grind higher on Friday morning. Similarly, the dollar index fell further as it returned to 94.40, down more than 1% on the week.
Another batch of key data is due today. August’s retail sales are expected to have risen 0.4%m/m (versus 0.5% in July), while the core measure, which excludes auto sales, should come in at 0.5%m/m, down from 0.6% in the previous. Finally, industrial production is forecast to have risen 0.3%m/m, compared to 0.1% a month earlier. Overall, we believe that the risk is biased to the downside for the greenback as a downside surprise could force the Fed to take a break in monetary tightening. With the ECB expected to phase out easy money, it could only push EUR/USD to the upside. Nevertheless, given the uncertainty generated by Turkey, the new Italian government and the Brexit negotiations, it may take longer for the single currency to benefit from this major change.
ECB and BoE maintain key rates unchanged while CBRT surprises the market
Yesterday central banks' schedule was quite packed. Starting with the Turkish central bank decision to raise interest rates to 24%, a rise of 625 bps, while investors were expecting that the CBTR would target 21%. Unsurprisingly, both the BoE and the ECB maintained their benchmark interest rates unchanged at 0.75% and -0.40%, respectively. The tone did not fundamentally changed for both.
Indeed, BoE Governor Mark Carney confirmed his readiness to support the Sterling at all costs using rate hikes in the case of a no-deal scenario related to EU – UK Brexit talks, a major impediment for UK central bankers. However, although UK economic growth remains above average, would it be enough for the UK economy to support the burden of higher interest rates on the real economy? A recent survey of UK-based companies confirms that 40% of the companies are expecting a sharp drop in exports after Brexit deal – so the consequences of higher interest rates, engendering a higher British pound would most probably not be supportive, which should ultimately not weigh in favor of a stronger GBP for now.
The ECB, took the surprising decision to maintain its QE program after December 2018, reducing by half the volume of monthly bond purchases starting in October to EUR 15 billion. The general outlook remains in line – with a slightly lower growth and inflation outlook (2018: 2% and 1.70% respectively), while risks of protectionism and EM markets collapse is growing. Key interest rates are not expected to change by Summer 2019.
The Turkish central bank confirmed its willingness to defend its currency and it actually worked for now. The USD/TRY pair returned back below 6.25 – for one day at least. The currency trend is reversing back, as investors seem to have doubts about the CBRT independence from its President Erdogan. Short-term we expect a rise in USD/TRY, heading along 6.25.