Sample Category Title
AUD/USD Weekly Outlook
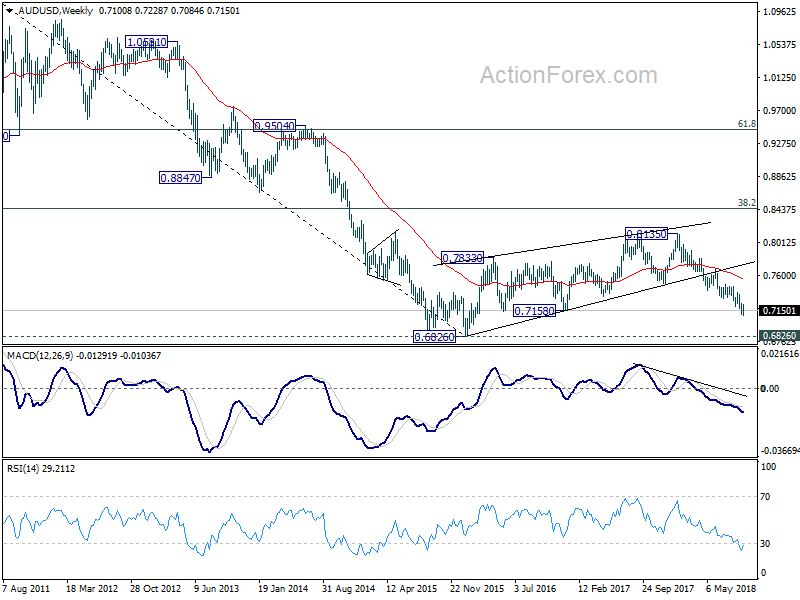
AUD/USD edged lower to 0.7084 last week but formed a short term bottom there and rebounded. With a temporary top in place at 0.7228, initial bias is neutral this week first. Another rise could be seen as the correction from 0.7084 extends. But upside should be limited well below 0.7361 resistance to bring down trend resumption. On the downside, break of 0.7084 will resume the fall from 0.8135 for key support level at 0.6826. However, sustained break of 0.7361 will carry larger bullish implication.
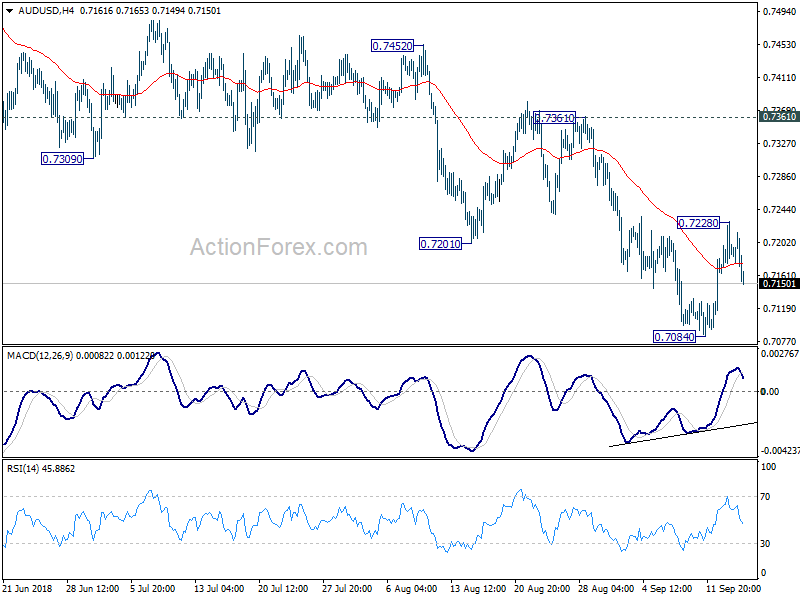
In the bigger picture, rebound from 0.6826 (2016 low) is seen as a corrective move that should be completed at 0.8135. Fall from there would extend to have a test on 0.6826. There is prospect of resuming long term down trend from 1.1079 (2011 high). Current downside momentum as seen in daily and weekly MACD support this bearish case. Firm break of 0.6826 will target 0.6008 key support next (2008 low). On the upside, break of 0.7361 resistance, however, argues that a medium term bottom is possibly in place, and stronger rebound could follow. We'll assess the medium term outlook later if this happens.
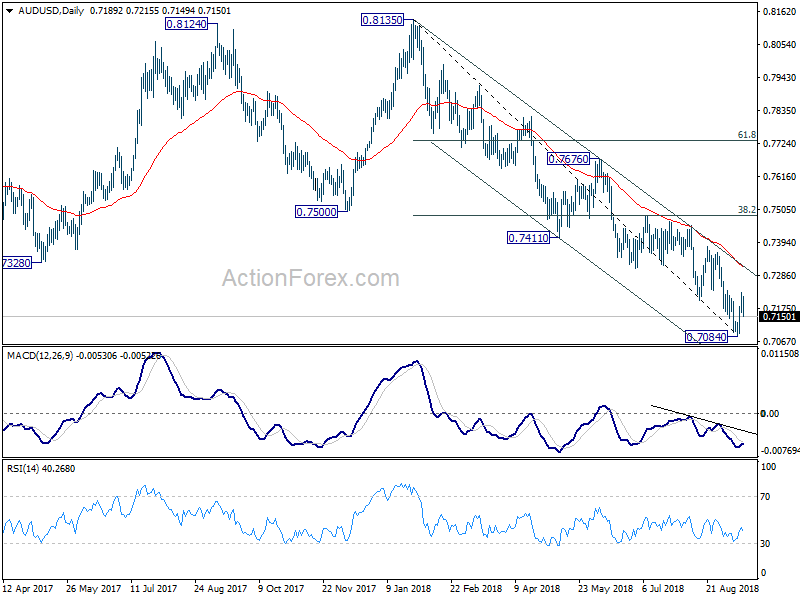
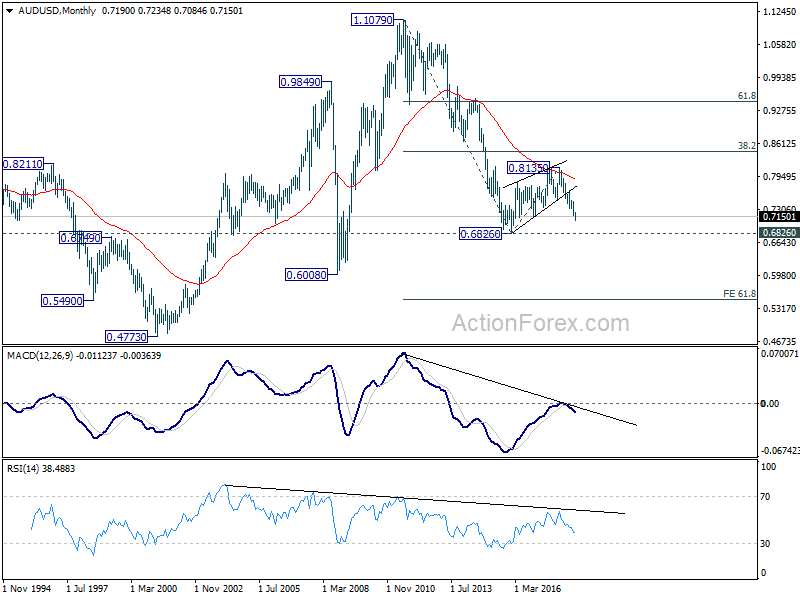
In the longer term picture, the corrective structure of rebound from 0.6826 (2016 low) to 0.8135, and the failure to break 38.2% retracement of 1.1079 (2011 high) to 0.6826 at 0.8451, carry bearish implications. AUD/USD was also rejected by 55 month EMA. Now, the down trend from 1.1079 is in favor to extend. On break of 0.6826, next target will be 61.8% projection of 1.1079 to 0.6826 from 0.8135 at 0.5507.
USD/CAD Weekly Outlook
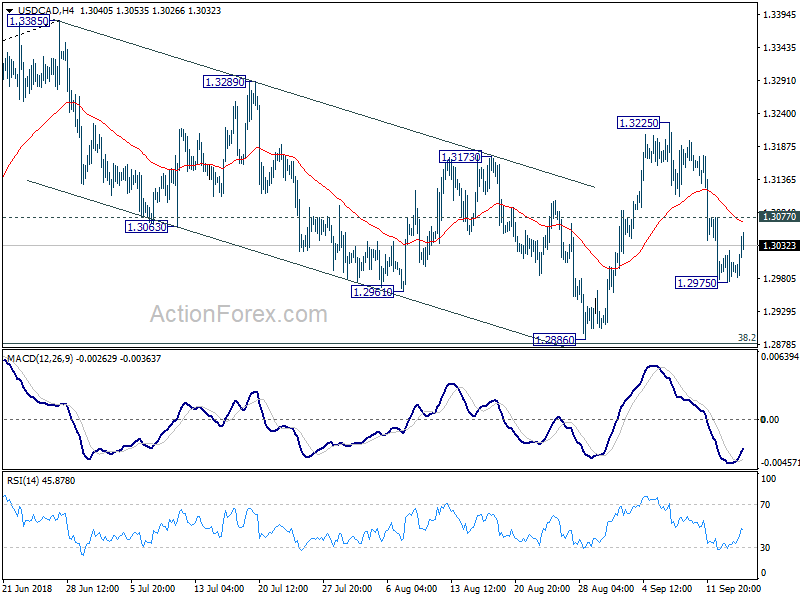
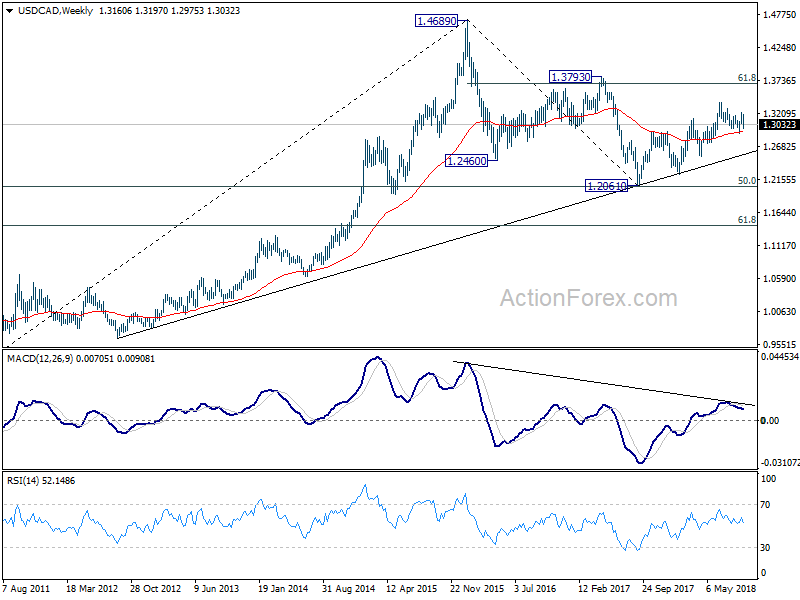
USD/CAD's pull back from 1.3225 dropped to as low as 1.2975 last week but formed a temporary low there. Initial bias is neutral this week first. We're holding on to the view that corrective fall from 1.3385 has completed at 1.2886 already. Hence, in case of another decline, downside should be contained above 1.2886 to bring rebound. On the upside, above 1.3077 minor resistance will turn bias back to the upside for 1.3225 resistance first. Break will reaffirm our bullish view and target 1.3385 high.
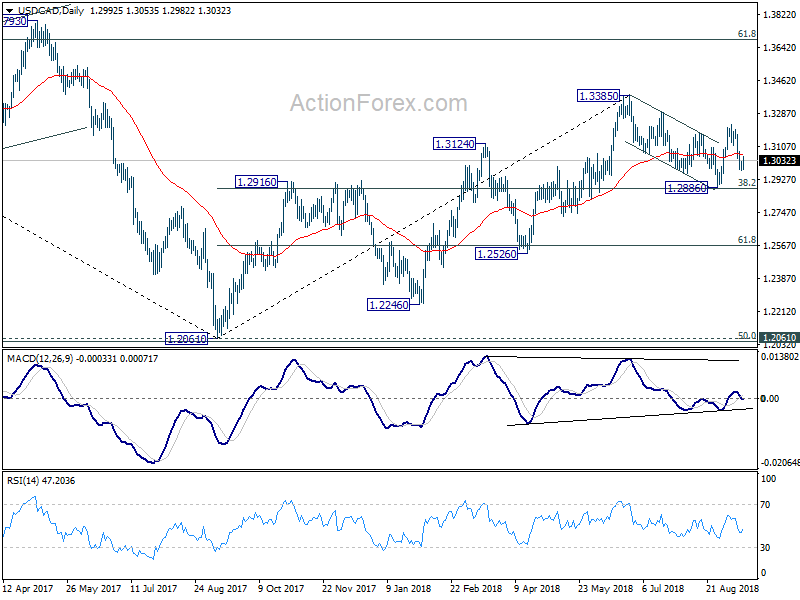
In the bigger picture, strong rebound ahead of 38.2% retracement of 1.2061 to 1.3385 at 1.2879 key fibonacci level retains medium term bullishness. That is, rise from 2017 low at 1.2061 is still in progress. Break of 1.3384 should target 61.8% retracement of 1.4689 (2015 high) to 1.2061 (2017 low) at 1.3685. On the downside, as long as 1.2886 support holds, outlook will now remain bullish.
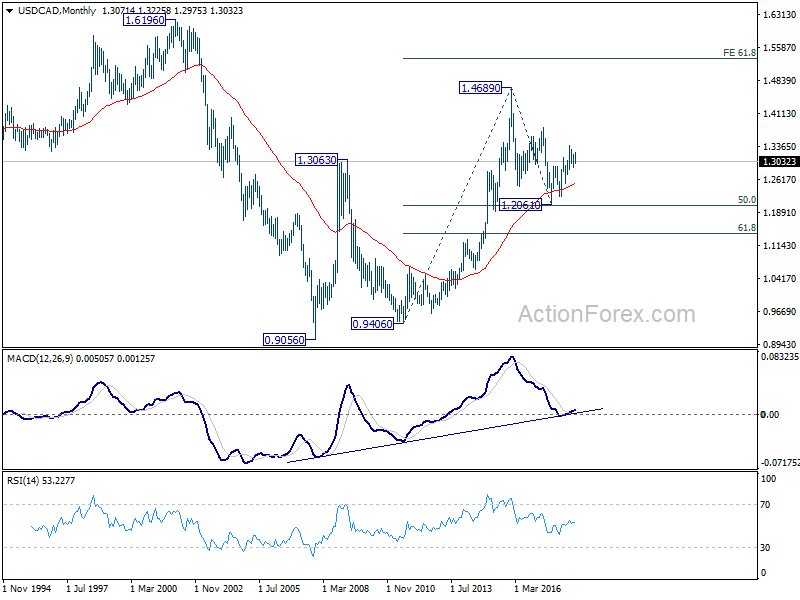
In the longer term picture, corrective fall from 1.4689 (2015 high) should have completed with three waves down to 1.2061, just ahead of 50% retracement of 0.9406 (2011 low) to 1.4689 (2015 high) at 1.2048. The development keeps long term up trend from 0.9406 and that from 0.9056 (2007 low) intact. For now, there is prospect of extending the long term up trend to 61.8% projection of 0.9406 to 1.4689 from 1.2061 at 1.5326 in medium to long term.
GBP/JPY Weekly Outlook
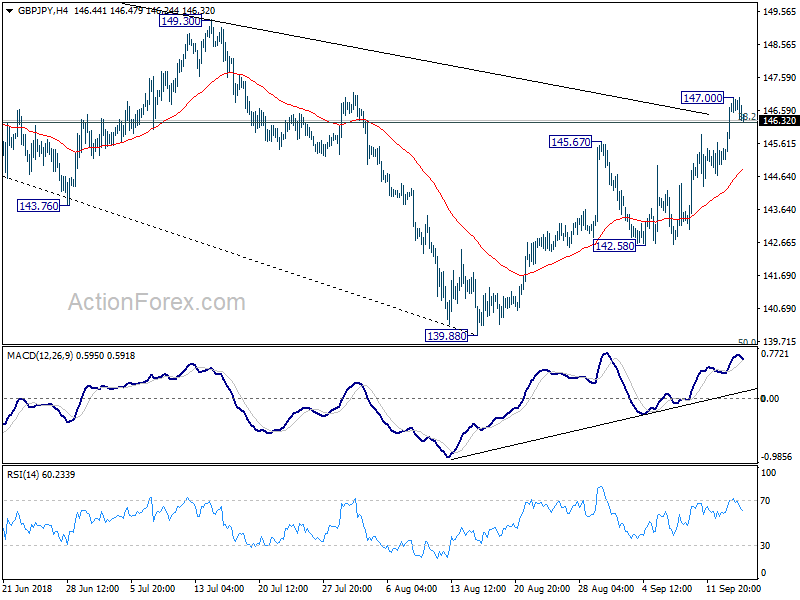
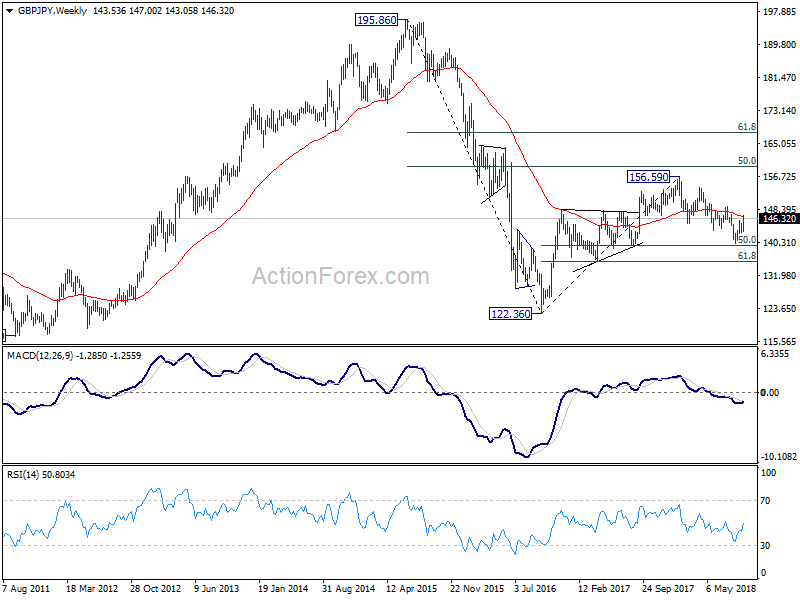
GBP?JPY rose further to as high as 147.00 last week before forming a temporary top there and retreated. Initial bias is neutral this week for some consolidations first. The break of 38.2% retracement of 156.59 to 139.88 at 146.26 and medium term falling trend line argues that whole decline from 156.59 has completed at 139.88, just ahead of 139.29/47 key support zone. Downside of retreat should be contained above 142.58 support to bring another rally. Above 147.00 will target 149.30 key resistance for confirming our bullish view.
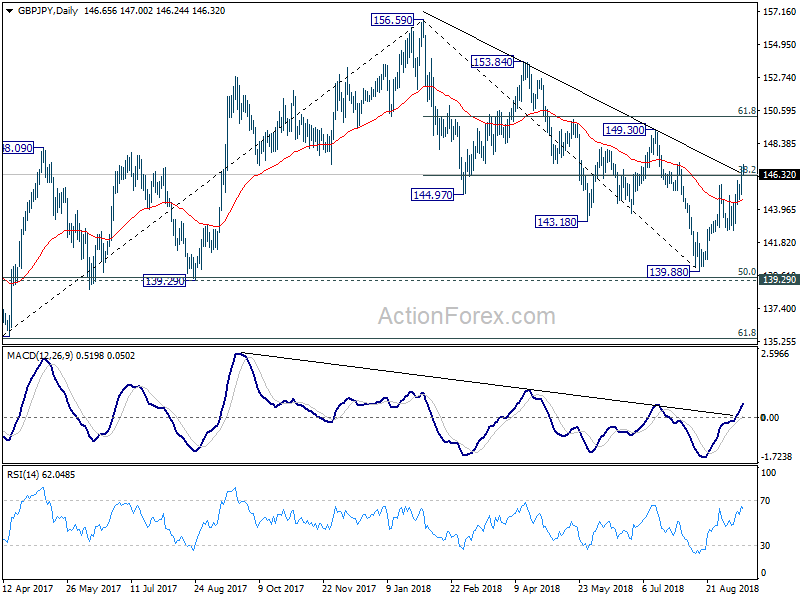
In the bigger picture, as long as 139.29 cluster support (50% retracement of 122.36 to 156.59 at 139.47) holds, the decline from 156.69 is seen as corrective move. That is, rise from 122.36 (2016 low), is still expected to extend higher through 156.69. However, sustained break of 139.29/47 should confirm medium term reversal and turn outlook bearish.
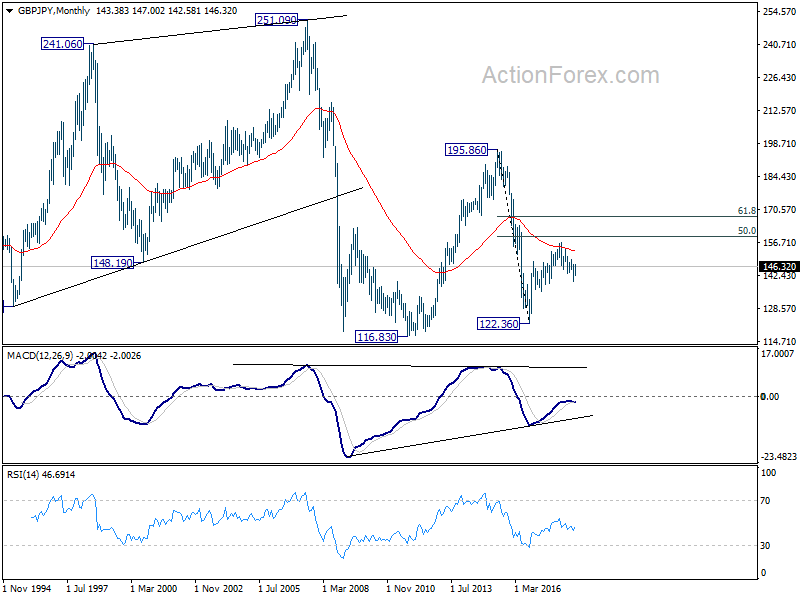
In the longer term picture, the failure to sustain above 55 month EMA (now at 152.74) is mixing up the outlook. Nonetheless, as long as 139.29 holds, rise from 122.36 is in favor to extend to 50% retracement of 195.86 (2015 high) to 122.36 (2016 low) at 159.11, and possibly further to 61.8% retracement at 167.78 before completion. However, firm break of 139.29 will turn focus back to 116.83/122.36 support zone instead.
EUR/JPY Weekly Outlook
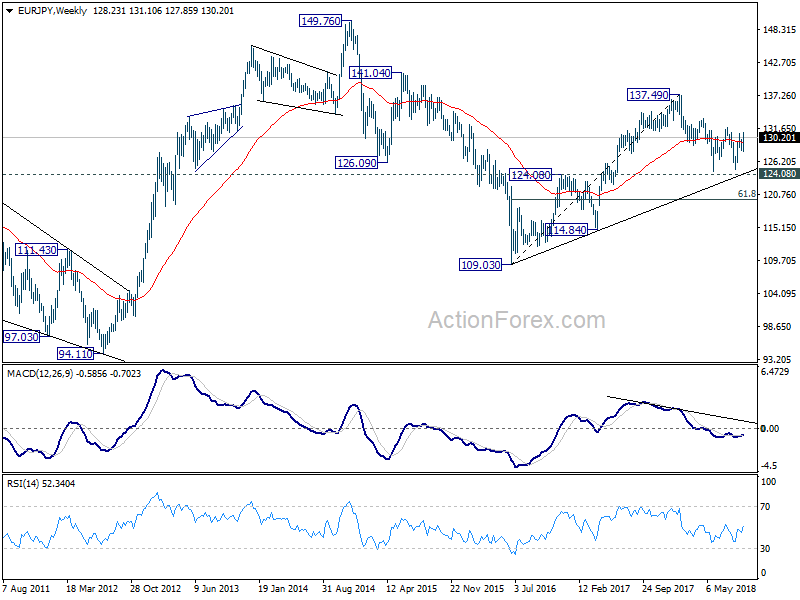
EUR/JPY edged higher to 131.10 last week but formed a temporary top there and retreated. Initial bias is neutral this week first. As 130.86 resistance was breached, rise from 124.89 should have resumed. Above 131.10 will target 131.97 resistance and then key fibonacci resistance at 132.56. On the downside, break of 129.43 is needed to be the first signal of short term topping. Otherwise, outlook will now remain cautiously bullish even in case of retreat.
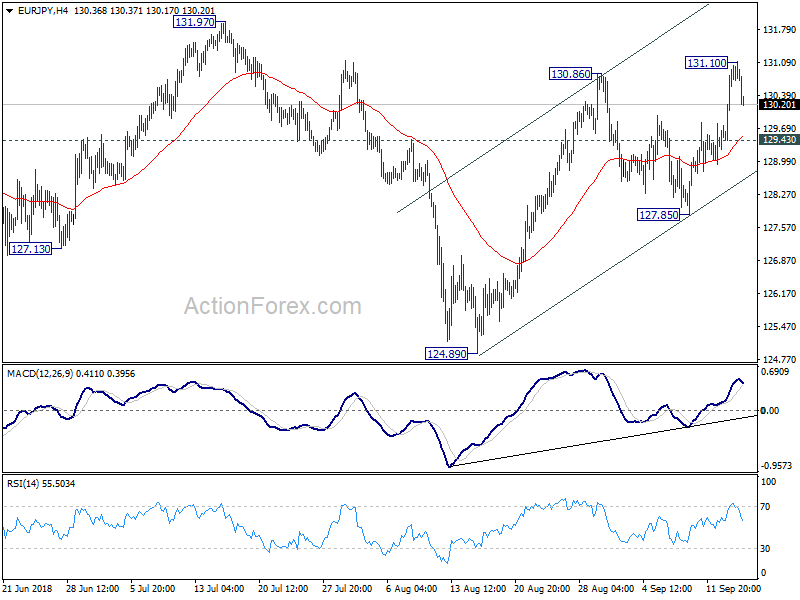
In the bigger picture, as long as 124.08 key resistance turned support, larger up trend from 109.03 (2016 low) remains in favor to continue. Decisive break of 61.8% retracement of 137.49 to 124.61 at 132.56 will pave the way to retest 137.49 high. However, firm break of 124.08 will argue that whole rise from 109.03 (2016 low) has completed at 137.49. Deeper decline would be seen to 61.8% retracement of 109.03 to 137.49 at 119.90 next.
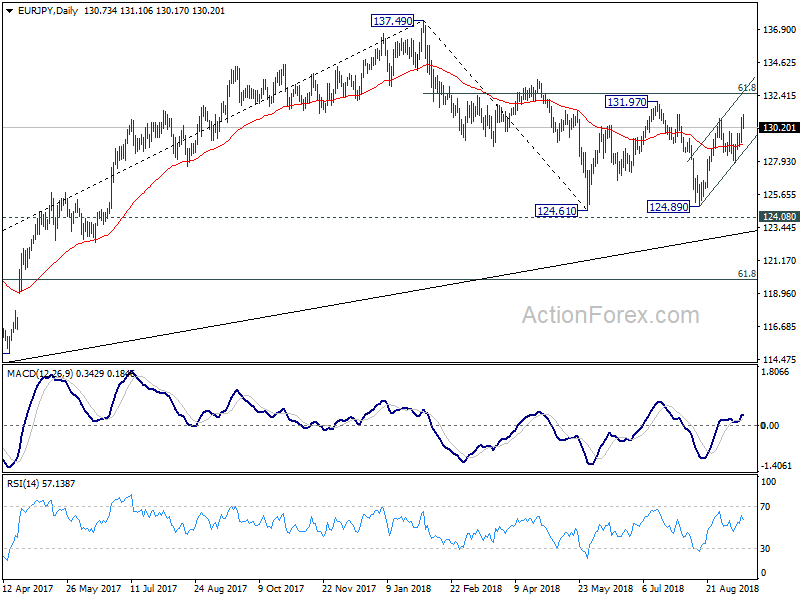
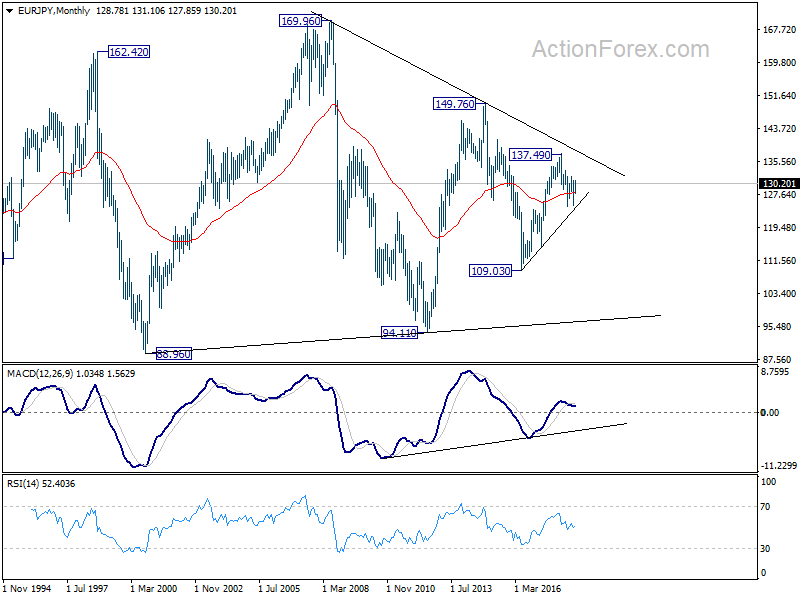
In the long term picture, at this point, EUR/JPY is staying in long term sideway pattern, established since 2000. Rise from 109.03 is seen as a leg inside the pattern. As long as 124.08 support holds, further rally is in favor in medium to long term through 149.76 high. However, break of 124.08 could extend the fall through 109.03 low instead.
EUR/GBP Weekly Outlook
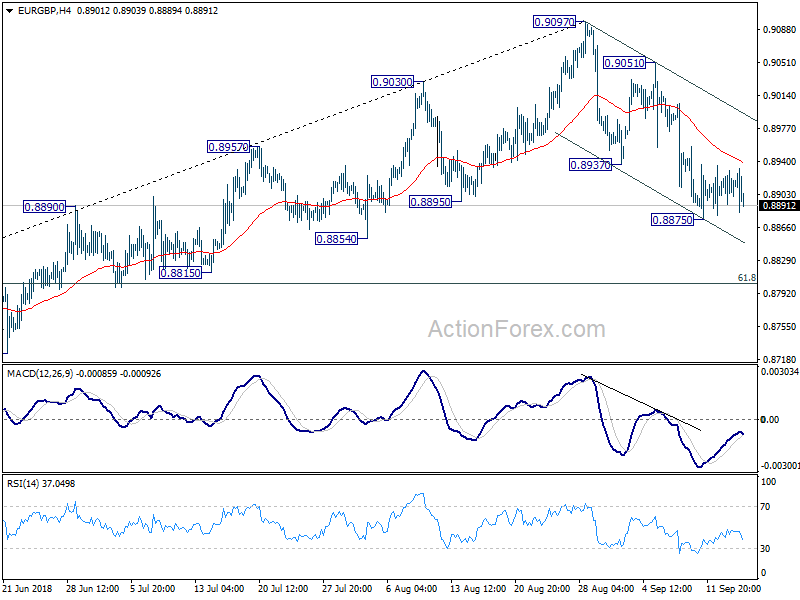
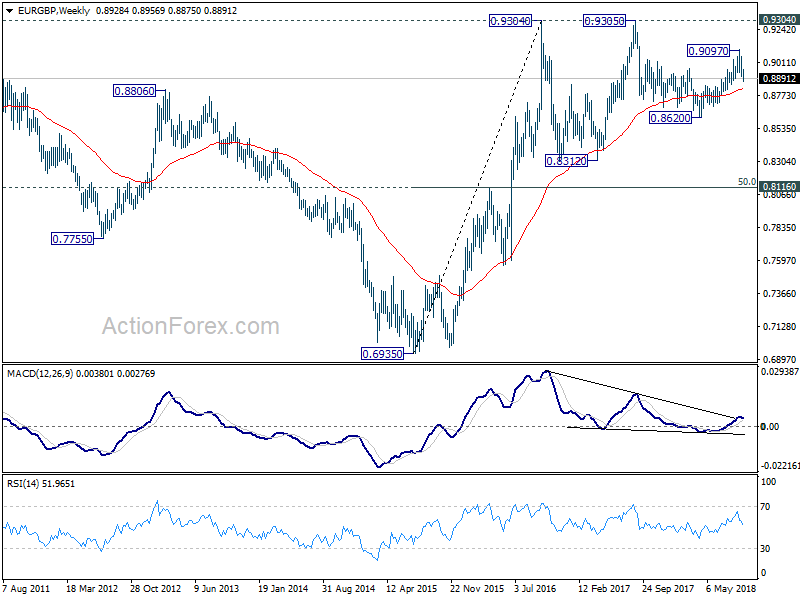
EUR/GBP dropped further to as low as 0.8875 last week but formed a temporary low there and turned sideway. Initial bias is neutral this week for consolidation first. In case of stronger recovery, upside should be limited well below 0.9051 resistance to bring another decline. As noted before, whole corrective rise from 0.8620 could have finished at 0.9097 already. Break of 0.8875 will target 61.8% retracement of 0.8620 to 0.9097 at 0.8802 and below.
In the bigger picture, EUR/GBP is staying in long term range pattern from 0.9304 (2016 high). At this point, there is no clear sign of range break out yet. And more corrective trading would continue. On the upside, in case of another rise, we'd stay cautious on strong resistance from 0.9304/5 to limit upside in case of further rally. Meanwhile, if there is another medium term decline, strong support will likely be seen from 0.8303 to contain downside.
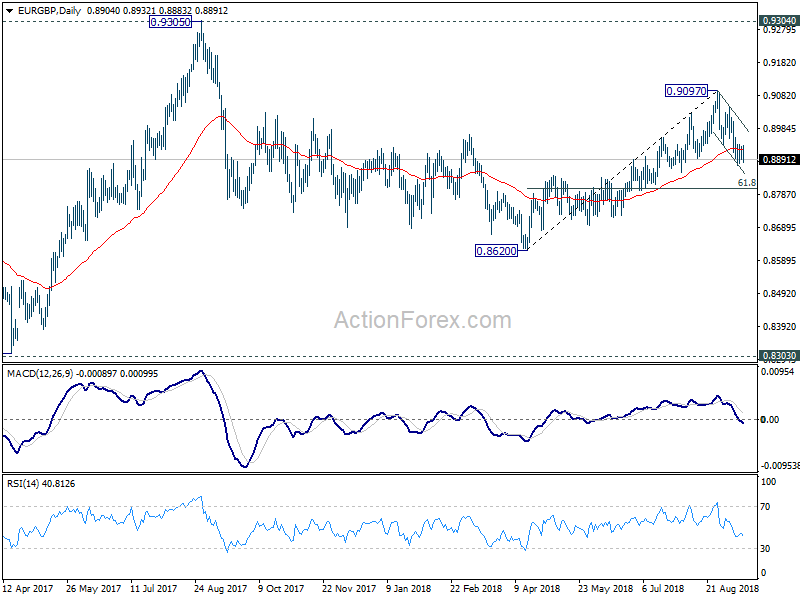
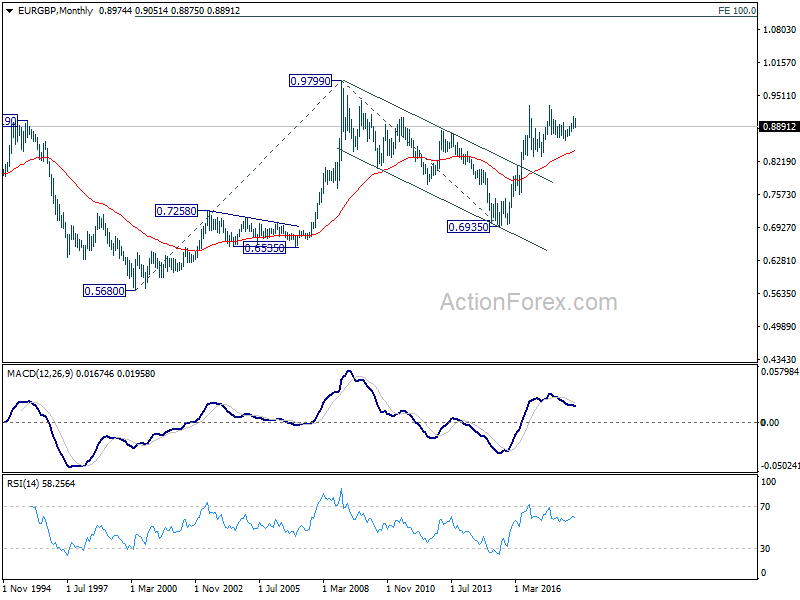
In the long term picture, we're holding on to the view that rise from 0.6935 (2015 low) is resuming the up trend from 0.5680 (2000 low). Hence, after the consolidation from 0.9304 completes, we'd expect another medium term up trend through 0.9799 to 100% projection of 0.5680 to 0.9799 from 0.6935 at 1.1054.
EUR/AUD Weekly Outlook
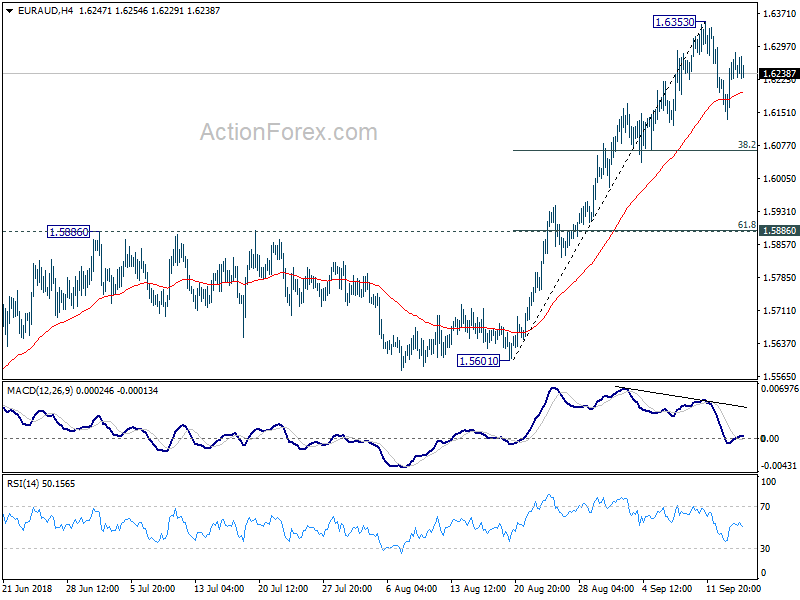
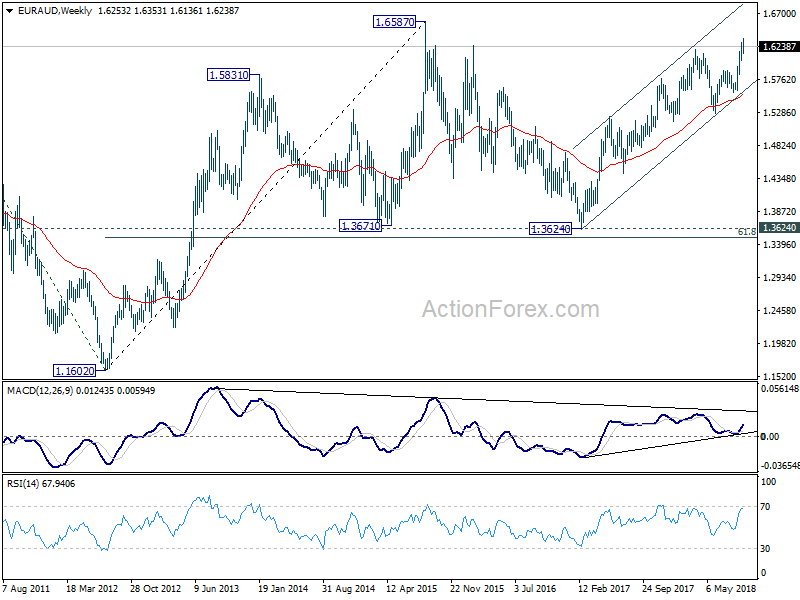
EUR/AUD edged higher to 1.6353 last week but formed a short term top there and retreated. Initial bias stays neutral this week for more consolidation first. Deeper pull back could be seen to 38.2% retracement of 1.5601 to 1.6353 at 1.6066. But downside should be contained well above 1.5886 cluster support (61.8% retracement at 1.5888) to bring rise resumption. On the upside, break of 1.6353 will resume larger up trend to 1.6587 key resistance level.
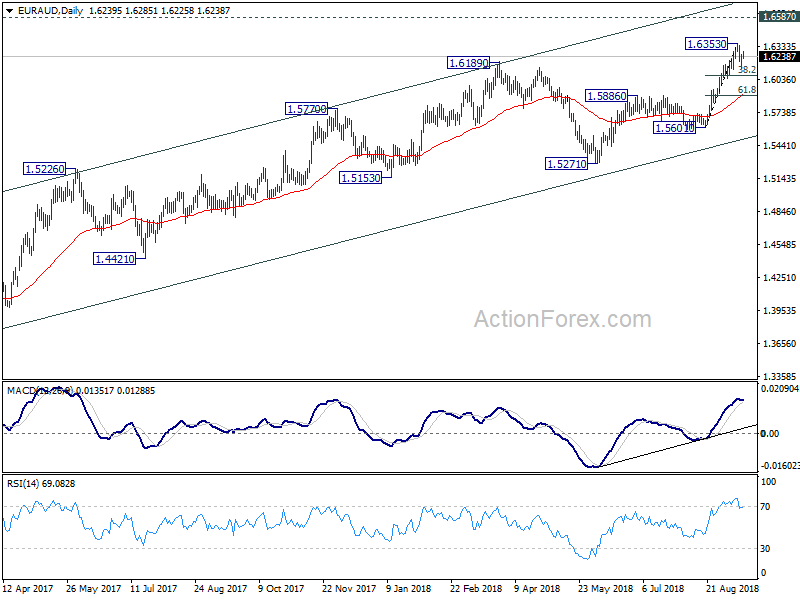
In the bigger picture, up trend from 1.3624 (2017 low) is still in progress. Further rise should be seen to retest 1.6587 (2015 high). Decisive break there will resume the long term rally and target 1.7488 fibonacci level. On the downside, break of 1.5601 support is need to be the first sign of medium term reversal. Otherwise, outlook will remain bullish in case of deep pull back.
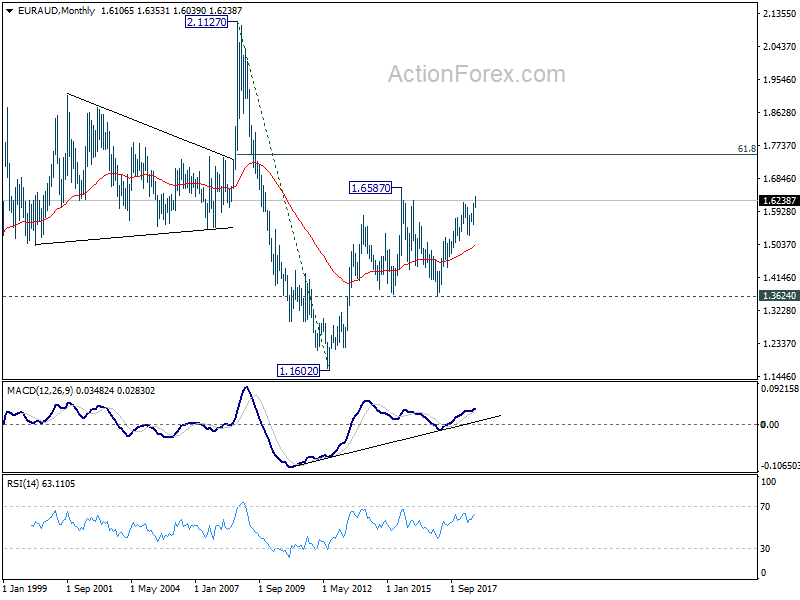
In the longer term picture, the rise from 1.1602 long term bottom (2012 low) isn't over yet. We'll keep monitoring the development but there is prospect of extending the rise to 61.8% retracement of 2.1127 to 1.1602 at 1.7488 and above. However, sustained trading below 1.3624 key support should indicate long term reversal and target 1.1602 long term bottom again.
EUR/CHF Weekly Outlook
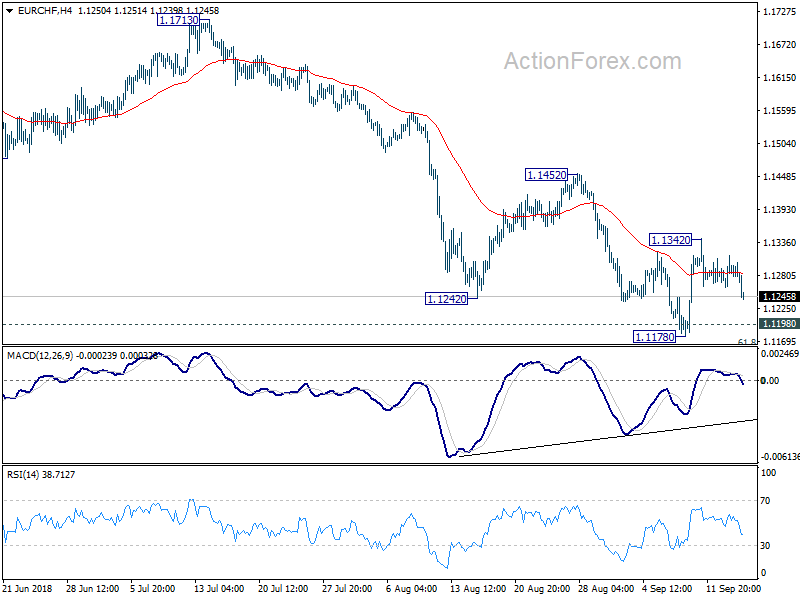
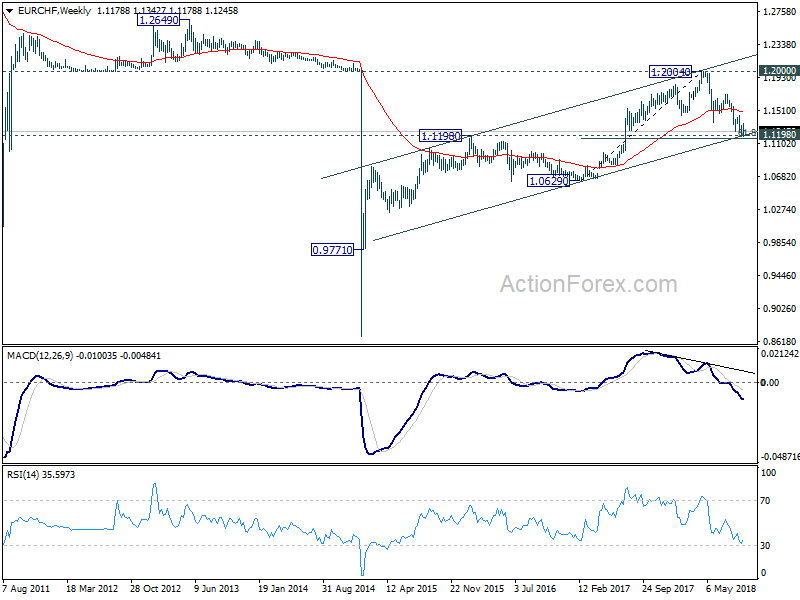
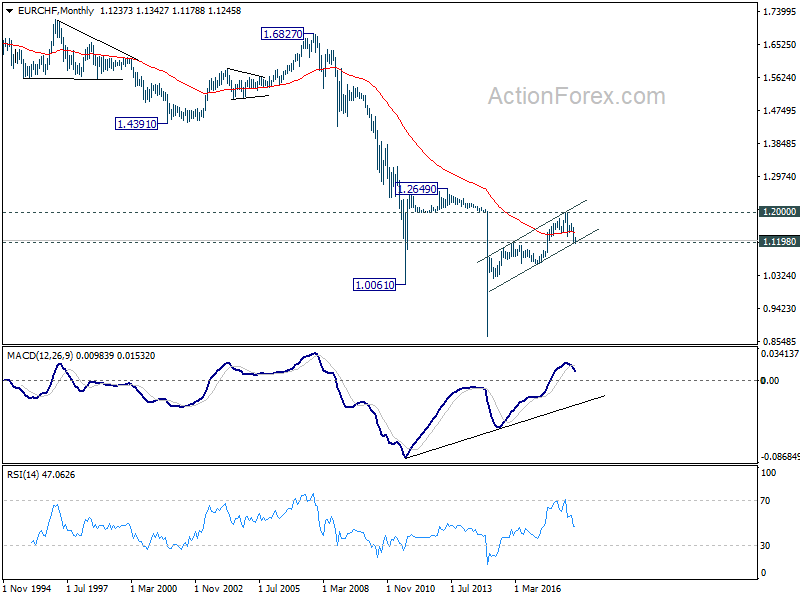
EUR/CHF rebounded to 1.1342 last week but retreated notably since then. Initial bias stays neutral this week first. In case of deeper fall, we'd continue to expect strong support from key support zone of 1.1154/98 to bring reversal. On the upside, above 1.1342 will target 1.1452 resistance first. Break should confirm that whole decline from 1.2004 has completed a target 1.1713 resistance next. However, sustained break of 1.1154/98 will carry larger bearish implications.
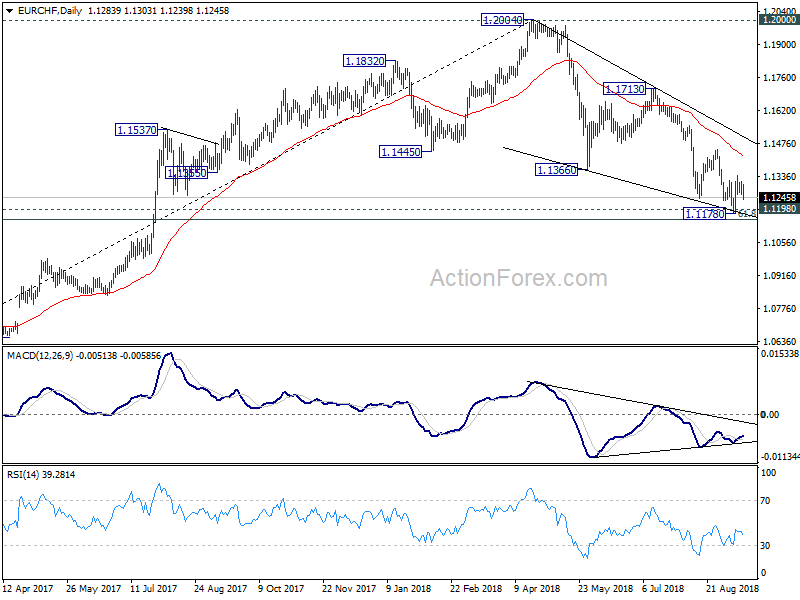
In the bigger picture, for now, the price actions from 1.2004 medium term top is seen as a correction only. Downside should be contained by support zone of 1.1198 (2016 high) and 61.8% retracement of 1.0629 to 1.2004 at 1.1154 to complete it and bring rebound. This cluster level is in proximity to long term channel support (now at 1.1207) too. A break of 1.2 key resistance is still expected in the medium term long term. However, sustained break of the mentioned support zone will mark reversal of the long term trend. In that case, 1.0629 key support will be back into focus.
Sterling Strongest as Brexit Deal Looks Relatively More Certain in a Chained Erratic World
It was another typical week with market moving headlines flying around. Being two highly anticipated non-events, BoE and ECB didn't disappoint investors by giving nothing new. On the other hand, there was a deep sense of nervousness ahead of Turkish central bank rate decision. The CBRT brought investors back from over-the-top rhetorics of Turkish President and delivered the much needed rate hike. There was news that US and China were going to restart which hammered Dollar and Yen and boosted stocks and Aussie. CPI and PPI misses added more misery to the greenback. But Dollar found "savior" in Trump who fired a tweet to re-escalate the tension. And it's reported that Trump will ignore all the outcries from American businesses and continue with new round of tariffs on China, in parallel with the trade negotiations.
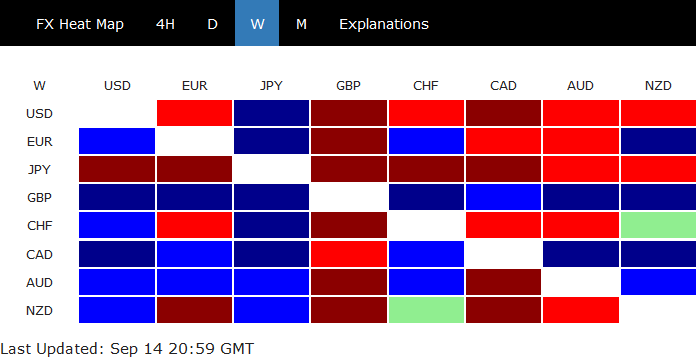
Sterling ended the week as the strongest one. The highly uncertain Brexit negotiation now looks relatively much more certain than other developments in the world, like Turkish president Erdogan and Trump's trade war policy. At least, Brexit negotiations are handled by two sides of rational people who want to make a deal. There may be jitters, may still be "substantial" differences, but both sides are optimistic for solutions. Canada ended as the second strongest one, partly supported by WTI oil which breached 70 handle briefly. Australian Dollar was the strongest as it was once boosted by US-China trade optimism and its own employment data. On the other hand, Yen was the weakest one, followed by Dollar and then Swiss Franc.
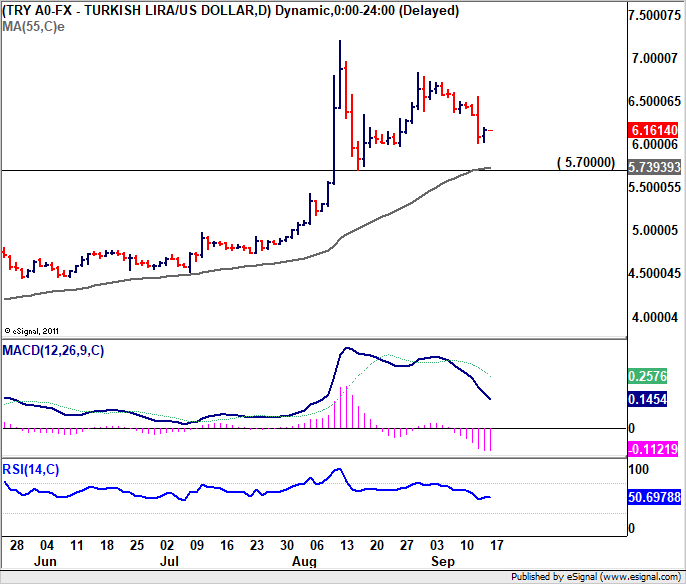
The global financial markets are deeply interconnected and the correlations are complexly entangled. For example, Turkish central bank CBRT delivered the much needed rate hike last week, raised policy rate (one week repo auction rate) from 17.75% to 24%. USD/TRY was shot down from day high of 6.5514 to as low as 6.0169 before closing the week at 6.1614.
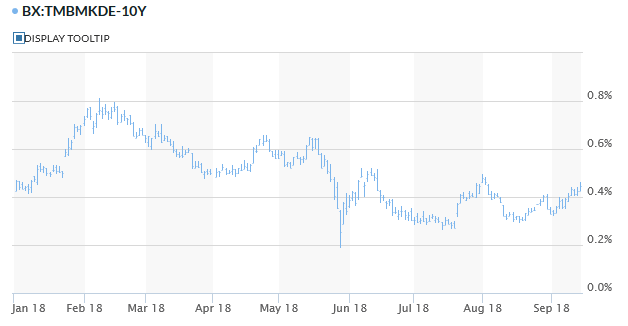
Easing worry of another immediate Turkish Lira crisis reduced safe haven demand and helped lift 10 year German bund yield to close at 0.447. It was at 0.320 at the beginning of the month, before Italy pledged fiscal discipline. And it's now heading back to prior range bottom at around 0.5.
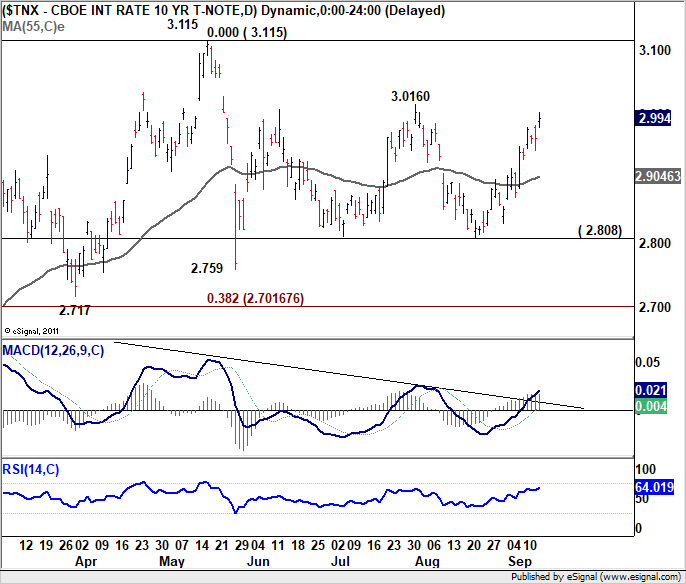
Higher German yield also spread across the Atlantic to the US, and helped lift 10 year yield to as high as 3.003 before closing at 2.994. 3.016 resistance is now within touching distance too, even though key level at 3.115 is still a bit far.
Japanese 10 year yield stayed steadily firm last week at around 0.11 and closed at 0.112. But apparently, yield spread with US and Germany widened again. Together with easing risk aversion, Yen was under much pressure and ended the week as the worst performing one. Nikkei out-performed other major Asian indices because of Yen weakness and finally broke 23050.39 resistance to close at 23094.67. Sustained trading above 23050.39, if it could really do, will pave the way to 24129.34 high.
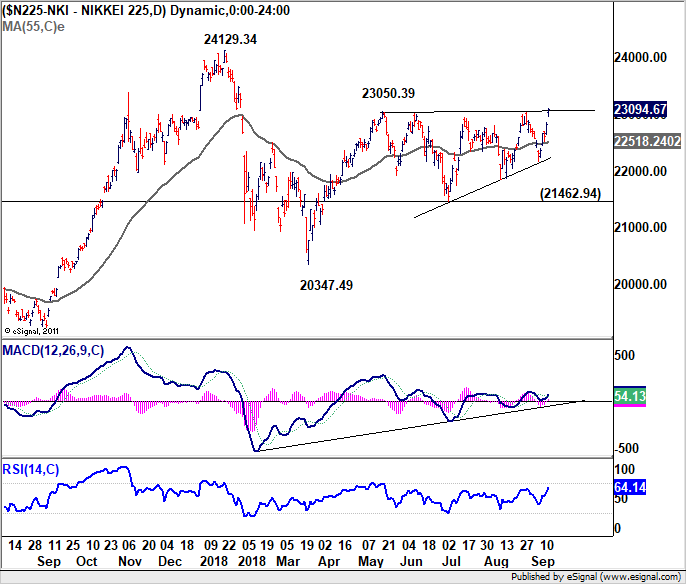
We have doubt on the sustainablilty of Nikkei's momentum mainly because of the uncertainty on US-China trade war. It's also another rather complicated topic. It seems that Treasury Secretary Steven Mnuchin is the only one pushing for the trade talks, possibly due to pressures from businesses. White House Economic Advisor Larry Kudlow sounded like he didn't mind the talks. Trump sounded like he couldn't care less. Dollar and Yen have staged notable rebound on Friday on news (based on unnamed sources) that Trump is going to start the 25% tariffs on USD 200B in Chinese imports no matter what, and soon.
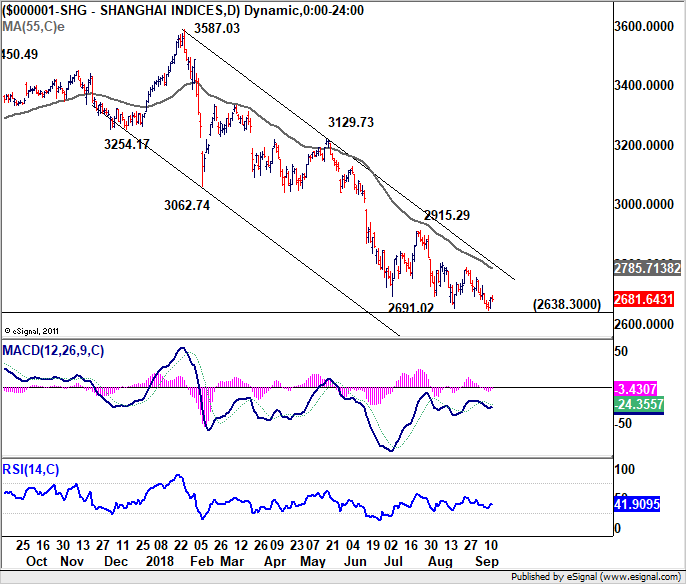
In this regard, the Chinese investors looked rather smart. The Shanghai SSE just had a half-hearted rebound last week. Key support level of 2638.38 (2016 low) still looks very vulnerable. And should the new round of tariffs take effect, this 2638.30 will also certainly be taken out rather firmly. And, that should spread to other markets (non-US).
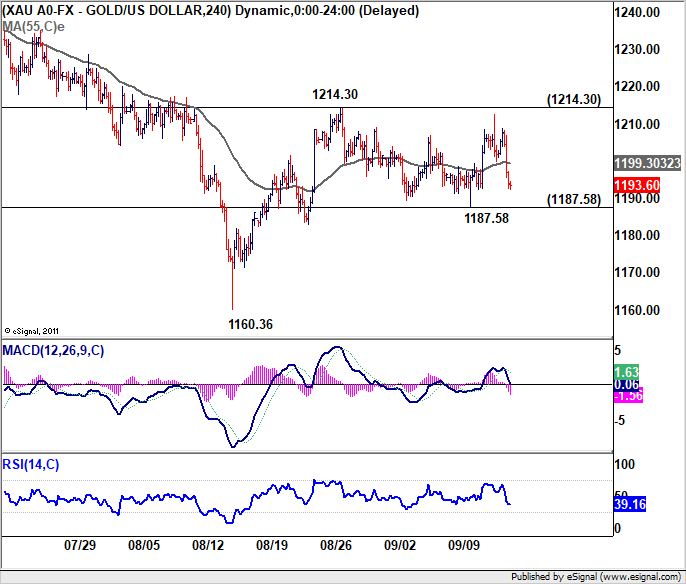
Gold traders also deserve some compliments too. Gold was on track to take out 1214.30 on Dollar weakness. But it immediately reversed after Trump's tweet on Thursday that China is the one who's under pressure to make a deal. And "we will soon be taking in Billions in Tariffs & making products at home". As long as 1187.58 minor support holds, we'd expect further rise ahead through 1214.30. But break will argue that whole rebound from 1160.36 has completed and bring retest of this low.
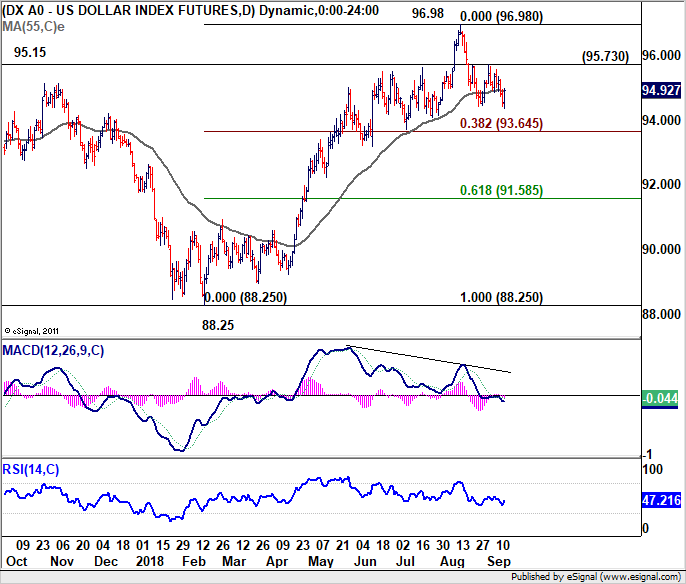
Now back to Dollar. Friday's outside bar suggests that a short term bottom if formed. But there is no confirmation of near term reversal yet. As long as 95.73 resistance holds, deeper decline is in favor. But downside should be contained by 38.2% retracement of 88.25 to 96.98 at 93.64 to bring rebound. Break of 95.73 could bring retest on 96.98 high. But for now, we'd expect the medium term consolidation pattern from there to extend for a while before an eventual upside breakout.
Position trade strategy
Our AUD/JPY short was stopped out at 80.25 last week. We've given some analysis on how it went against us here.
In considering new strategy, the confusion that Trump and his administration created on trade relationship with China is puzzling. Do they have a consensus on escalation or de-escalation? Or, will they ever have consensus on the issue? There is no way for us to predict whether the new rounds of tariffs will start or not, or when would it happen. Thus, Dollar, Yen and Aussie pairs are something that we'd prefer to avoid for a week at least. NAFTA negotiations look like never-ending but they could suddenly pop up with a deal. Thus, we'd also like to avoid Canadian Dollar pairs.
Well, it sounds like there's nothing to trade. But hold on, we still believe in the end, "common sense prevails". That is, as noted above, Brexit negotiation is on track because it's handled by rational people, on both sides. If there is any problem, it would more likely arise from within the UK Leave Camp. But we'd doubt if the Brexiteers dare to outturn the deal and push the country into disorderly Brexit. So, any negative news from the UK side will likely have temporary impact on the Pound against Euro. EU has enough problems to handle, including Italy and Turkey, and not to mention US auto tariffs. If there could be a deal with the UK, they'll do it. Both BoE and ECB have laid down their policy path rather clearly and there is practically no chance to change course for the near term. So fundamentally, Sterling is in upper hand against Euro as the Brexit talks gradually progress towards a deal.
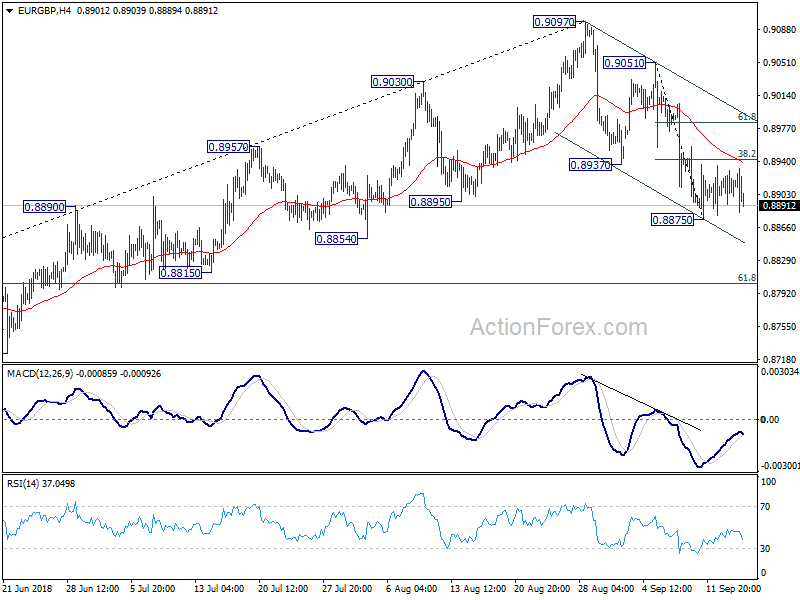
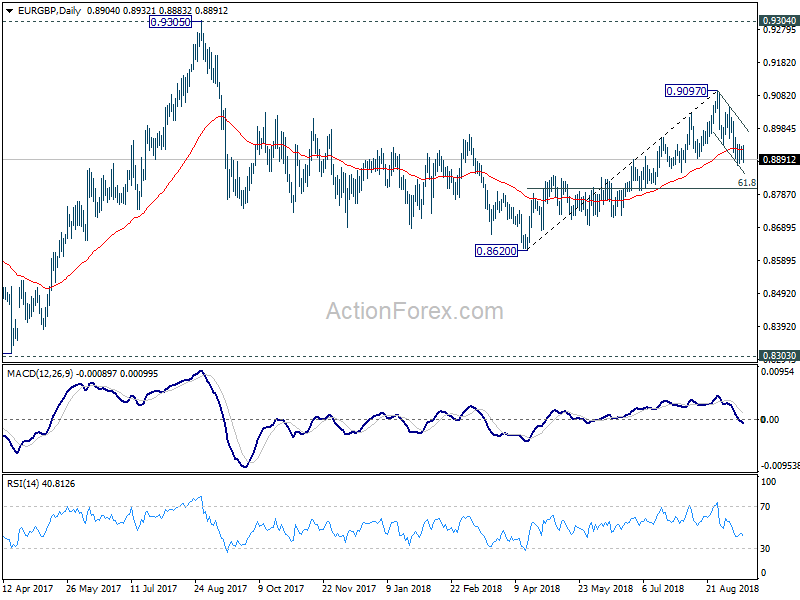
Technically, EUR/GBP's choppy rise from 0.8620 should have completed at 0.9097. And it's seen as a corrective move. Deeper fall is expected to 61.8% retracement of 0.8620 to 0.9097 at 0.8802 and below. But it's hard to say if 0.8620 will be taken out. To trade this, we'll try to capture a rebound on Brexit negative news, like some fake news that someone says the talks break down. We'll sell at 0.8950, slightly above 38.2% retracement of 0.9051 to 0.8875 at 0.8942. Stop is put at 0.8990, above 61.8% retracement at 0.8984. Target is at 0.8800, slightly below 0.8802 fib level. Risk/reward is at 1:3.75. This is a short term trade. And if 0.8875 is taken out before our entry, we'll cancel the order.
GBP/JPY Weekly Outlook
GBP?JPY rose further to as high as 147.00 last week before forming a temporary top there and retreated. Initial bias is neutral this week for some consolidations first. The break of 38.2% retracement of 156.59 to 139.88 at 146.26 and medium term falling trend line argues that whole decline from 156.59 has completed at 139.88, just ahead of 139.29/47 key support zone. Downside of retreat should be contained above 142.58 support to bring another rally. Above 147.00 will target 149.30 key resistance for confirming our bullish view.
In the bigger picture, as long as 139.29 cluster support (50% retracement of 122.36 to 156.59 at 139.47) holds, the decline from 156.69 is seen as corrective move. That is, rise from 122.36 (2016 low), is still expected to extend higher through 156.69. However, sustained break of 139.29/47 should confirm medium term reversal and turn outlook bearish.
In the longer term picture, the failure to sustain above 55 month EMA (now at 152.74) is mixing up the outlook. Nonetheless, as long as 139.29 holds, rise from 122.36 is in favor to extend to 50% retracement of 195.86 (2015 high) to 122.36 (2016 low) at 159.11, and possibly further to 61.8% retracement at 167.78 before completion. However, firm break of 139.29 will turn focus back to 116.83/122.36 support zone instead.
Summary 9/17 – 9/21
Monday, Sep 17, 2018
[php_everywhere instance="1"]
Tuesday, Sep 18, 2018
[php_everywhere instance="2"]
Wednesday, Sep 19 2018
[php_everywhere instance="3"]
Thursday, Sep 20, 2018
[php_everywhere instance="4"]
Friday, Sep 21, 2018
[php_everywhere instance="5"]
Weekly Economic and Financial Commentary: US Growth Remains on Track
U.S. Review
Growth Remains On Pace With Little Sign of Overheating
- The inflation data took center stage this week. The CPI and PPI both came in slightly below expectations and inflation expectations remain well anchored. Import prices also fell more than expected during the month.
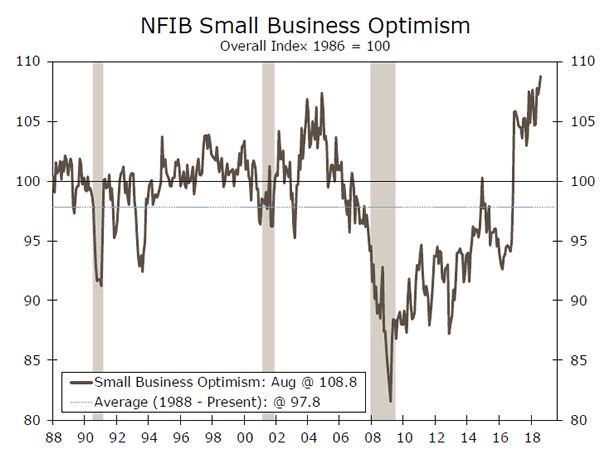
- The NFIB Small Business Optimism Index rose to an all-time high in August, climbing 0.9 points to 108.8.
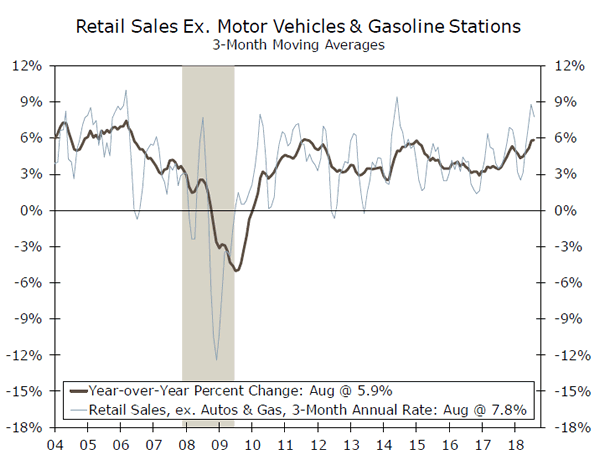
- Retail sales rose less than expected in August, rising just 0.1% overall. The prior month's data were revised higher, however, and consumer spending remains solidly on pace with our forecast for the third quarter.
US Growth Remains on Track
This past week's economic reports largely came in close to expectations and suggest third quarter real GDP growth will rise close to our expectations of a solid 3.1% annual rate. Most of the key economic data came at the end of the week. Retail sales data came in a bit light, rising just 0.1%, but data for the prior month were revised higher and the core measure of retail sales remains up at a brisk 7.8% pace over the past 3 months (top chart).
Keep an eye on clothing and department store sales, which tumbled 1.7% and 1.0%, respectively in August. Back-to-school sales have historically been a good predictor of holiday season sales and the weakness here is somewhat surprising. These categories are notoriously volatile, however, and calendar effects can cause wide month-to-month swings. Much of the most recent drop appears to have been due to discounting. Apparel prices tumbled 1.6% in August, their largest monthly drop since January 1949.
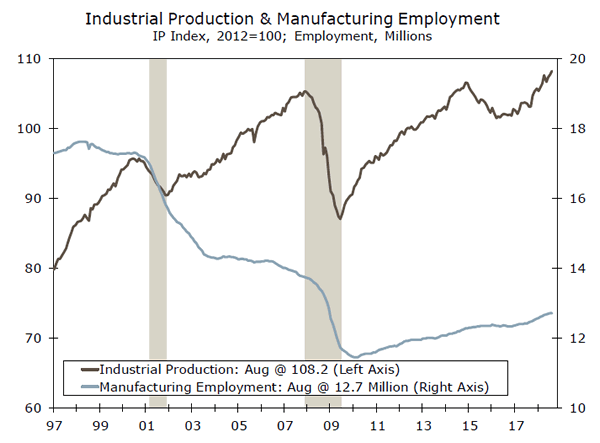
Industrial production rose 0.4% in August, which was slightly better than expected. A rebound in motor vehicle assemblies and utilities output accounted for most of the increase. Motor vehicle output jumped 4.0% in August following a 1.4% drop the prior month. Excluding motor vehicles and parts, manufacturing output was unchanged in August, following a 0.5% rise the prior month. Utility output jumped 1.2% in August, with electric utilities logging all the increase, reflecting warmer temperatures and increased use of air conditioning.
The inflation data largely came in below expectations. The headline PPI fell 0.1% in August after remaining unchanged in July. The year-to-year change in the final demand series fell on both an overall and core basis, slipping to 2.8% and 2.3% respectively. While it is hard to draw too many conclusions from the PPI data, it appears that inflationary pressures are cresting or possibly even backtracking a bit, likely due to some slowing in global economic conditions. Price increases have also eased at the intermediate level and the old method of measuring the PPI, which is much more closely tied to industrial demand, shows both headline and core inflation pressures easing.
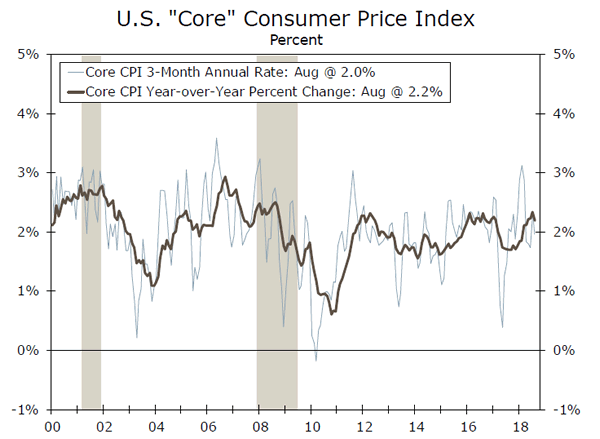
Both the headline and core CPI measures came below expectations, rising 0.2% and 0.1% respectively in August. The year-to-year measures in both eased slightly, with the overall CPI moderating to 2.7% from 2.9% percent a month earlier and core sliding back to 2.2% year-over-year from 2.4% in July. The smaller rise in the core CPI was largely due to the previously mentioned plunge in apparel prices. Given the lack of recent precedence for such a plunge, this looks more structural than cyclical and its moderating impact on the headline and core CPI data is unlikely to impact the Fed's timetable for raising interest rates.
The National Federation of Independent Business (NFIB) Small Business Optimism index rose to a new all-time high in August (bottom chart). Business owners continue to express a great deal of optimism about the economy and their business, which adds a little upside risks to forecasts for business fixed investment and employment.
U.S. Outlook
Housing Starts • Wednesday
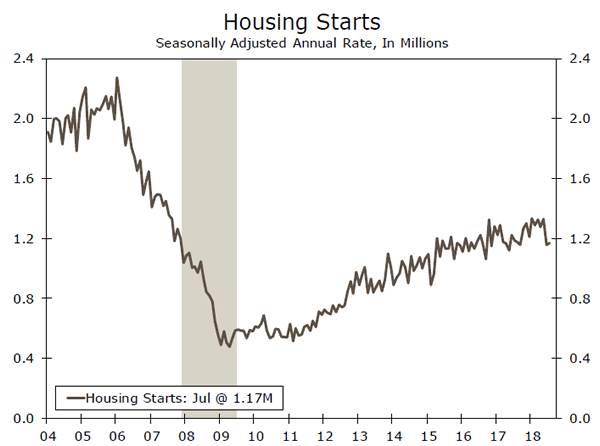
Housing starts increased slightly in July. The number of new units started during the month rose 0.9% to a 1.168-million unit pace, an unspectacular, yet solid gain. Both single family and multifamily starts edged higher, growing 0.9% and 0.7%, respectively. While July's reading came in under expectations, total starts are now running 6.2% ahead of last year on a year-to-date basis.
Despite new starts falling somewhat short of expectations, builders continue to report strong buyer demand. Rising labor and material costs have been a major headwind to homebuilding this year, causing projects to be delayed or cancelled entirely as they no longer pencil out. However, material prices tend to be lower in the second half of the year, which should allow some of the stalled projects to restart. Our expectations for new residential building have been scaled back recently due to these mounting cost pressures, but we still anticipate new housing starts to trend higher in coming months.
Previous: 1,168K Wells Fargo: 1,221K Consensus: 1,231K (SAAR)
Existing Home Sales • Thursday
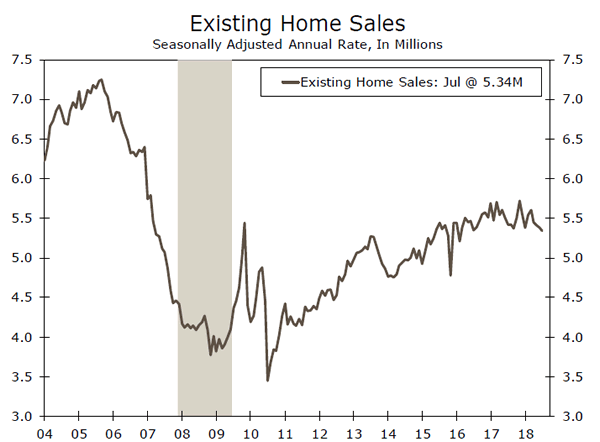
Existing home sales fell in July. Resales of single family homes and condo and co-ops dropped 0.7% to a 5.34-million unit pace during the month, and are now 1.5% below year-ago levels. Excluding condo resales, existing single family homes fared slightly better and only registered a 0.2% decline. The lack of inventory is keeping home prices elevated and restraining sales. Total inventory declined 0.5% during the month, while the month's supply of homes on the market held constant at 4.3 months.
Existing home sales remain stuck in low gear, and affordability is an increasing concern. Mortgage rates have ticked higher the past year, and continued low levels of inventory on the market have translated to home prices rising well ahead of income growth. Still, signs continue to point to economic growth remaining solid headed into the fall, which should allow existing home sales to pick up from their current pace.
Previous: 5.34M Wells Fargo: 5.39M Consensus: 5.38M (SAAR)
Leading Index • Thursday
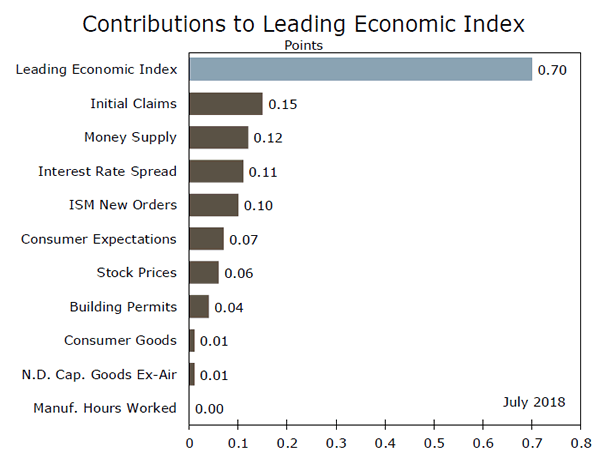
The Leading Economic Index (LEI) increased 0.6% in the July, further evidence that economic growth should remain solid in the second half of 2018. The monthly gain follows a 0.5% rise in June and has now climbed 5.5% on a six-month annualized basis. July's improvement was also comprehensive, as each of the underlying components contributed to the 0.7 point increase in the headline index. The largest contributor was initial jobless claims, which added 0.15 points. Meanwhile, manufacturing hours worked had the smallest impact and remained neutral to the overall index.
Several components of the index continued be solid in August. Initial jobless claims fell to new lows, while ISM new orders showed a substantial gain. We expect the LEI to continue to advance and point to the economy maintaining strong momentum throughout the second half of the year.
Previous: 0.6% Wells Fargo: 0.5% Consensus: 0.5% (Month-over-Month)
Global Review
ECB Leaves Rates Unchanged, EM Remains in Focus
- Several central bank announcements were slated for release this week, including the European Central Bank (ECB), which left policy unchanged. We look for the ECB to maintain a slowand- steady approach to removing policy accommodation, as inflationary pressures remain muted.
- Economic data released in China this week showed steady retail and firmer industrial activity growth, as that country's central bank pauses along its deleveraging path.
- Turkey's central bank notably raised interest rates 625 bps to 24%, higher than consensus estimates, in an attempt to curb rampant inflation and rapid depreciation of the Turkish lira.
ECB Leaves Rates Unchanged, EM Remains in Focus
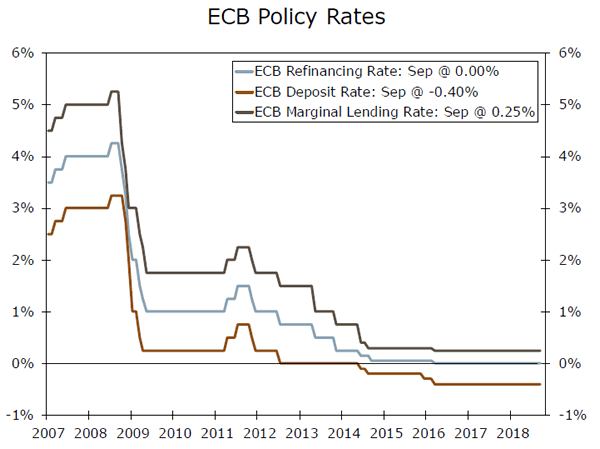
It was a busy week across the international arena, with several central bank announcements and data releases of note. In the Eurozone, the European Central Bank (ECB) left policy unchanged (see chart on first page), and confirmed its plan to taper asset purchases to €15 billion per month in October before wrapping up its bond-buying program at the end of 2018. However, it also reinforced that this timeline remains conditional on incoming data in the months ahead.
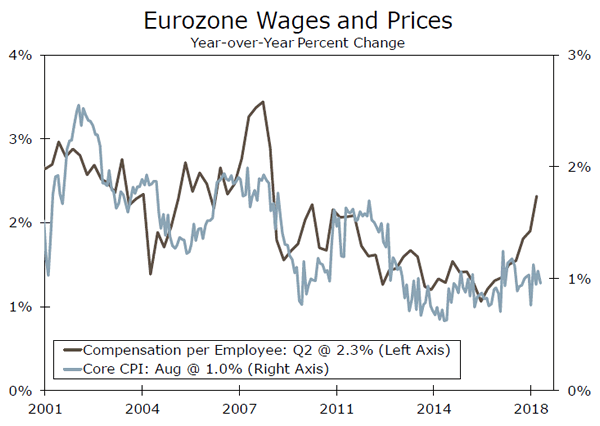
This week's decision largely reinforces our view that the ECB will adopt a slow-and-steady approach to winding down policy accommodation. The ECB has signaled that it must first end asset purchases before raising interest rates, and we do not see its first rate hike occurring until fall 2019. In the accompanying press conference, ECB President Draghi noted that while inflation currently remains muted, underlying inflationary pressures have picked up. Indeed, data released this week showed that wage growth reached 2.2% year-over-year in Q2, up from 2.1% in Q1 (top chart). While core inflation remains stuck around 1%, the Q2 pickup in compensation is a positive sign for rising price pressures going forward as wage growth picks up.
That said, the ECB also downgraded its economic forecasts slightly for 2018 and 2019, with President Draghi citing a somewhat weaker contribution to GDP growth from external demand. While the economic expansion generally remains solid, trade tensions remain on the forefront. President Draghi cited rising protectionism as a risk to its outlook, a factor that that could also weigh on export growth in coming quarters.
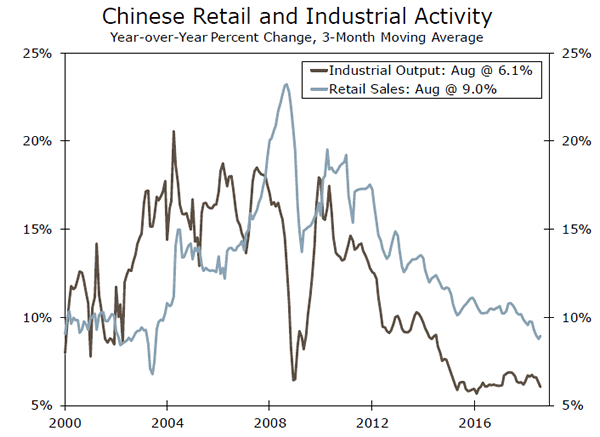
Shifting to emerging markets (EM), Chinese data released this week showed that economic conditions generally remained solid in August. Growth in retail sales firmed to 9% year-over-year and industrial production growth was also stronger (middle chart). The People's Bank of China (PBoC) has paused its deleveraging process in recent months, cutting its reserve requirement ratio for commercial banks in an attempt to inject more liquidity into the market. Even with slightly softer year-to-date fixed investment spending, there are some promising signs of stronger growth prospects for the economy. Ongoing trade tensions remain an area to watch, as the Trump administration continues to discuss imposing additional tariffs on a variety of Chinese goods in coming weeks.
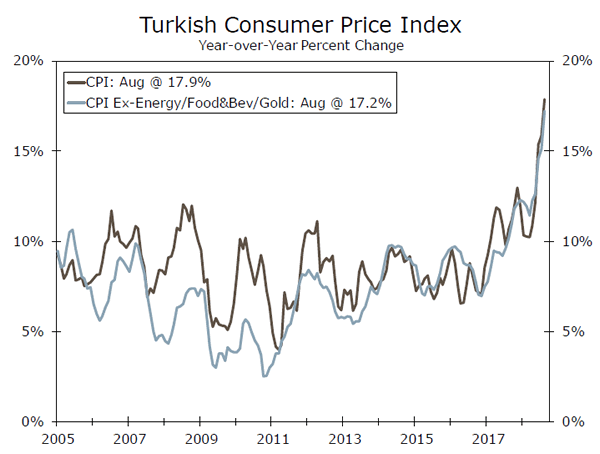
Elsewhere in EM, Turkey remained in focus, with its central bank raising interest rates 625 bps to 24%, higher than market estimates. Turkey has captured headlines recently amid fears of financial market contagion, as the Turkish lira has slid almost 40% against the dollar so far this year. Market participants remain concerned about Turkey's high current account deficit, while inflation has also skyrocketed to nearly 18% in August (bottom chart). Although the lira remains under pressure, it recovered around 4% against the dollar after the central bank announcement. Given rampant inflation and the lira's downward spiral, the central bank could raise rates further in coming months.
Global Outlook
U.K. CPI • Wednesday
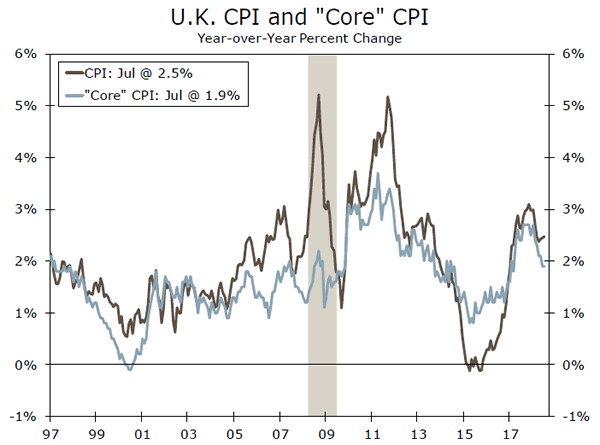
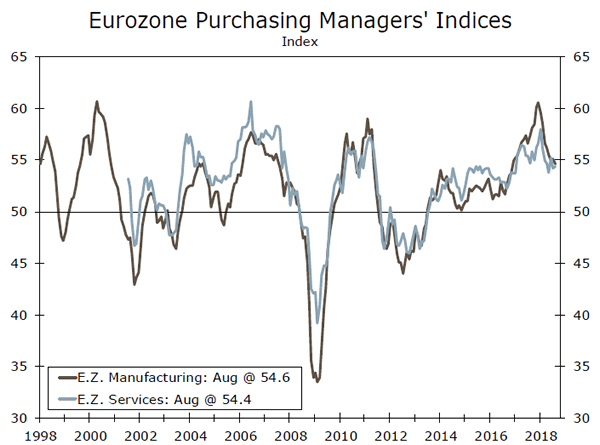
Inflation in the United Kingdom has been on a downward trend after surpassing 3% in the wake of the Brexit Referendum in 2016, as a sharp drop in sterling caused price pressures to surge. Headline CPI rose 2.5% in August year over year, and core CPI remained below 2%. Retail sales data for the U.K. will also be released next week and should give further detail on the outlook for the consumer sector. Growth in retail sales has picked up in recent months as price pressures have eased, after sales slowed through the end of 2017.
While inflation has started to come back down to earth and retail sales have firmed, economic growth in the U.K. has remained sluggish, with real GDP rising 1.5% annualized in Q2. Given slower economic growth and ongoing Brexit negotiations, we look for the Bank of England (BoE) to remain on hold in coming quarters until these concerns subside.
Previous: 2.5% Wells Fargo: 2.4% Consensus: 2.4% (Month-over-Month)
Bank of Japan Decision • Wednesday
At its July meeting, the Bank of Japan (BoJ) adjusted policy slightly by widening its 10-year government bond yield tolerance band and changing some commercial bank deposit requirements. Despite these minor policy adjustments, the BoJ remains firmly in accommodative territory. The BoJ also introduced dovish forward guidance at its last meeting, stating that interest rates will remain low for an extended period of time.
Data released since July showed that GDP growth in Japan rebounded in Q2 after slipping into negative territory in Q1, however inflation remains below 1%. Given subdued inflation data and the policy changes already introduced at its July meeting, we look for the BoJ to remain on hold next week. In other central bank announcements slated for release, the Swiss National Bank is expected hold policy steady, while the consensus looks for the Central Bank of Norway to raise its deposit rate to 0.75%.
Previous: -0.10% Wells Fargo: -0.10%
Eurozone PMIs • Friday
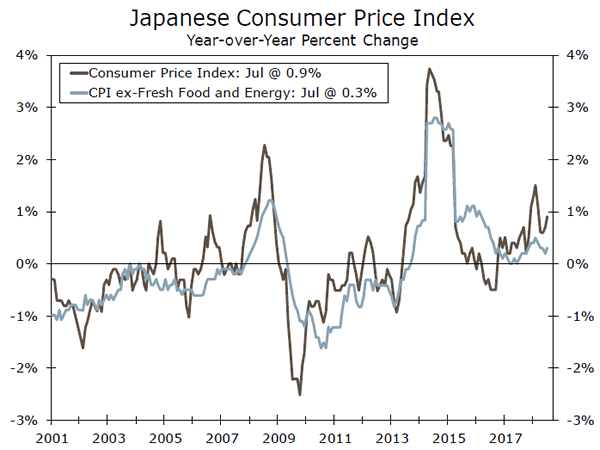
After displaying mixed results in August, markets will be closely watching the preliminary September release of the Eurozone Purchasing Managers' Indices (PMI) next week. In August, the manufacturing PMI missed consensus expectations and slipped slightly to 54.6 percent, while the services PMI rose to 54.4. Services represent a large share of the Eurozone economy, so the uptick last month could be a positive signal for strengthening overall economic growth if the trend continues in coming months.
For now, subdued GDP growth in the Eurozone this year has supported the ECB's continued accommodative monetary policy stance. The ECB has signaled that it must first wrap up its bondbuying program at the end of this year before hiking rates, and we do not look for it to start raising interest rates until fall 2019. In the meantime, policymakers will likely be watching next week's PMI releases closely for signs of a possible pickup in economic growth.
Previous: 54.6 (Manufacturing), 54.4 (Services) Consensus: 54.4 (Manufacturing), 54.4 (Services)
Point of View
Interest Rate Watch
Bostic: Tariff Concerns and Capex
On Thursday, Federal Reserve Bank of Atlanta President Raphel Bostic presented to the Mississippi Council on assessing the impact of international trade on firms' investment plans. His address serves as another example of the ongoing tariff debate continuing to capture the attention of policymakers and markets alike.
With roughly 28% of U.S. GDP linked to the international trade of goods and services, Bostic argues that foreign trade linkages are complex and not readily transparent. As firms' continue to rely on the global supply chain, the challenge of interpreting the broad implication of tariffs on the U.S. economy only intensifies when trying to account for the expectations of firms.
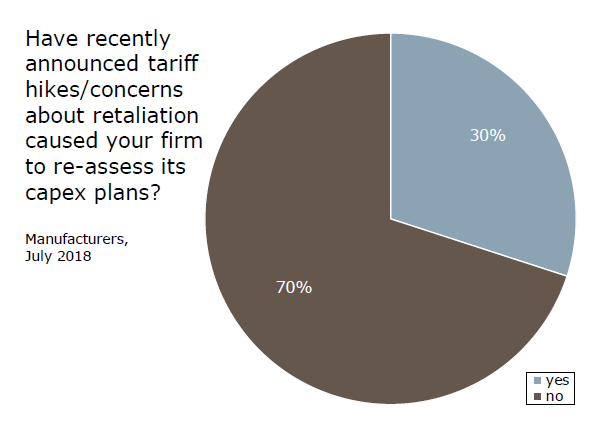
Bostic points to the Survey of Business Uncertainty, which attempts to gauge firm's expectations regarding their capex, sales, employment and costs. One-fifth of firms surveyed said they are reassessing their capex plans in July due to tariff related concerns, while only 6% reported actually cutting spending.
However, as Bostic highlights, "there are reasons for concern…30% of manufacturing firms report they are reassessing their capital expenditure plans because of tariff worries, and manufacturing is highly capital intensive," (top chart) while, "12% of the firms report they have placed previously planned capital expenditures under review". With trade tensions only escalating, there is scope for continued uncertainty in capex spending.
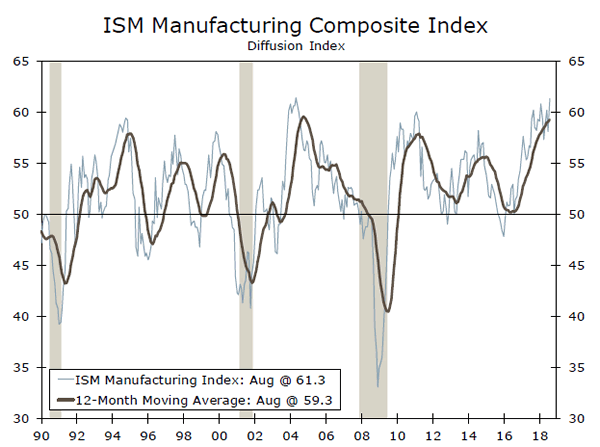
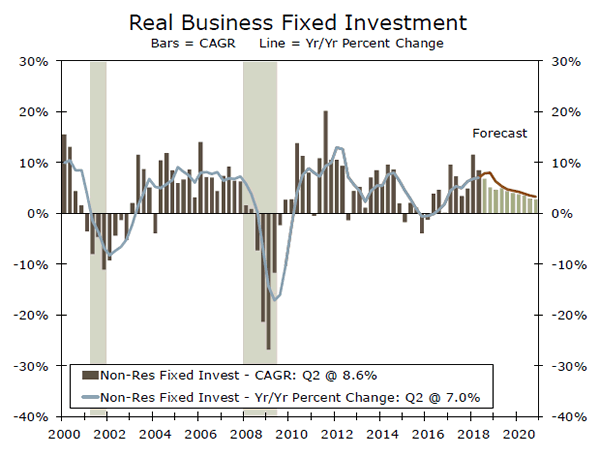
Looking toward the latest ISM report, however, may suggest otherwise. Contacts made numerous mentions of tariffs in the August ISM report, but with the overall index strengthening to its highest reading in 14 years, trade has not appeared to faze activity (middle chart). Despite the ISM current production index posting a solid gain in August, investment plans say more about a firms expectations than they do about current conditions. While trade tensions have yet to show up in the hard data, we expect investment spending to moderate in Q3 from the robust pace of spending seen in the first half of the year (bottom chart).
Credit Market Insights
Credit Markets and the Real Economy
With tomorrow marking the tenth anniversary of the Lehman Brothers Chapter 11 bankruptcy filing, there has been renewed reflection on the causes and consequences of the Great Recession. Former Fed Chair Ben Bernanke added his voice to the conversation this week, with a paper exploring the mechanisms by which financial distress led to such a severe economic contraction. He discusses two major frameworks of understanding the path of the recession—one in which the collapse in housing prices led to a major pullback in household spending, and another in which the massive losses in securitized product markets set off a broader financial panic and "credit crunch".
Bernanke argues that the factors associated with a "credit crunch" are better able to explain such a broad economic contraction than the factors associated with household deleveraging and a consumer spending collapse. However, he explicitly recognizes that these two explanations are not mutually exclusive; clearly, household financial health and the strength of credit markets are intricately related. A conclusion about the relative importance of these two explanations is beyond the scope of this column, but Bernanke makes another, arguably more important conclusion—the need for greater attention to credit market dynamics in macroeconomics. Indeed, as this expansion approaches the longest on record and some imbalances begin to build, it is essential to monitor credit markets for insights into the real economy.
Topic of the Week
Value in Virtue: Impact Investing & the Economy
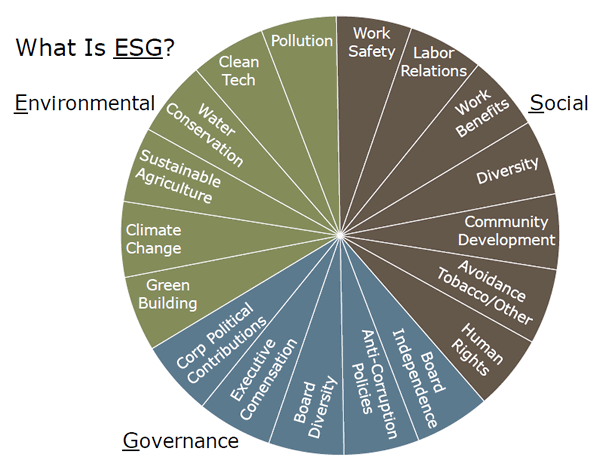
While the purpose of investing is to maximize returns, the allocation of capital also shapes corporate behavior, and that has implications for the economy. Capital that is deployed with consideration to factors beyond just financial returns, like contributing to a positive difference in the world, is known as impact investing. This type of investment has also come to be recognized as socially responsible investing (SRI) or ESG investing, which specifically refers to firms that exhibit a commitment to Environment, Social and Governance values (top chart).
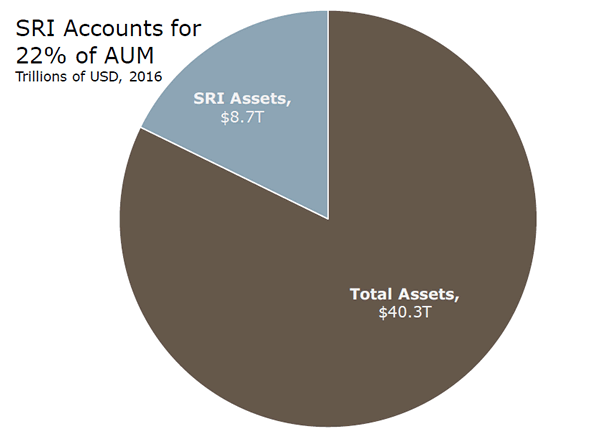
While it is true that not every investor will be willing to place value on non-financial returns on investment, even financially motivated market participants will not want to overlook the fact that this fast-growing category of investment captures roughly 20 cents of every dollar invested (bottom chart). The fact that this category is gaining traction and capturing asset flows suggests that it will influence corporate decisions, and that translates into implications for the economy.
The current economic landscape offers a compelling backdrop for the impact part of impact investing to be manifested. Our recent report looks into how ESG values could shape corporate behavior, and what that means for three areas of the economy: the labor market, consumer spending and prices.
The labor market is as tight as it has been in decades and wage pressures are building, which affords businesses the opportunity to better align their priorities with what today's workers value to attract the best–and increasingly scare–talent. Meanwhile, consumers' growing preference for values-based purchases has businesses changing up what is on-offer. Organic and fair-trade options at the grocery store are growing substantially faster than conventional food, while corporations who are prioritizing more than just profits are gaining market share. Not only are these companies differentiating themselves, but profits need not suffer; consumers are increasingly willing to pay up for goods and services from companies that are more committed to environmental, social and governance principles.