Sample Category Title
USD/CAD Weekly Outlook
USD/CAD's strong rebound last week argues that corrective fall from 1.3385 has completed at 1.2886 already. And, 1.2879 fibonacci level was defended. the development also revived the bullish case that rise from 1.2061 isn't completed. With a temporary top formed at 1.3225, initial bias is neutral this week first. Downside of retreat should be contained well above 1.2886 to bring rally resumption. On the upside, above 1.3225 will target a test on 1.3385 high.
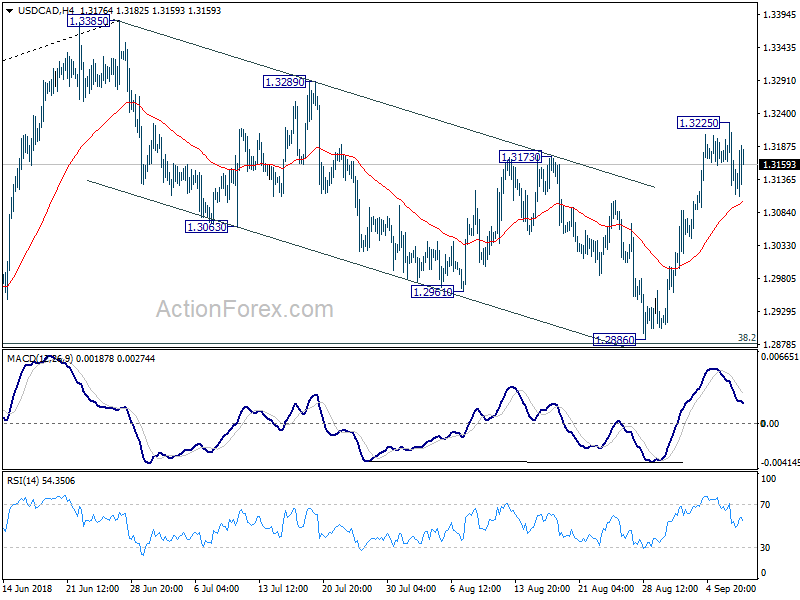
In the bigger picture, strong rebound ahead of 38.2% retracement of 1.2061 to 1.3385 at 1.2879 key fibonacci level retains medium term bullishness. That is, rise from 2017 low at 1.2061 is still in progress. Break of 1.3384 should target 61.8% retracement of 1.4689 (2015 high) to 1.2061 (2017 low) at 1.3685. On the downside, as long as 1.2886 support holds, outlook will now remain bullish.
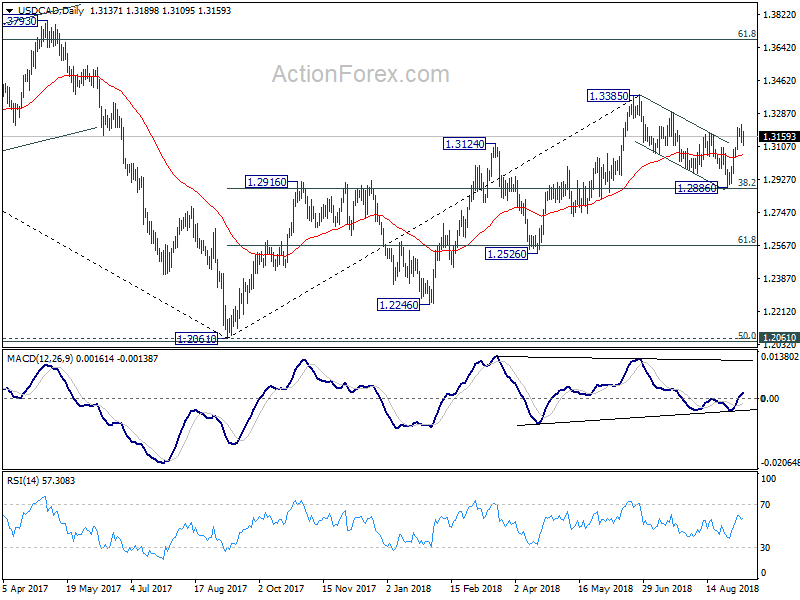
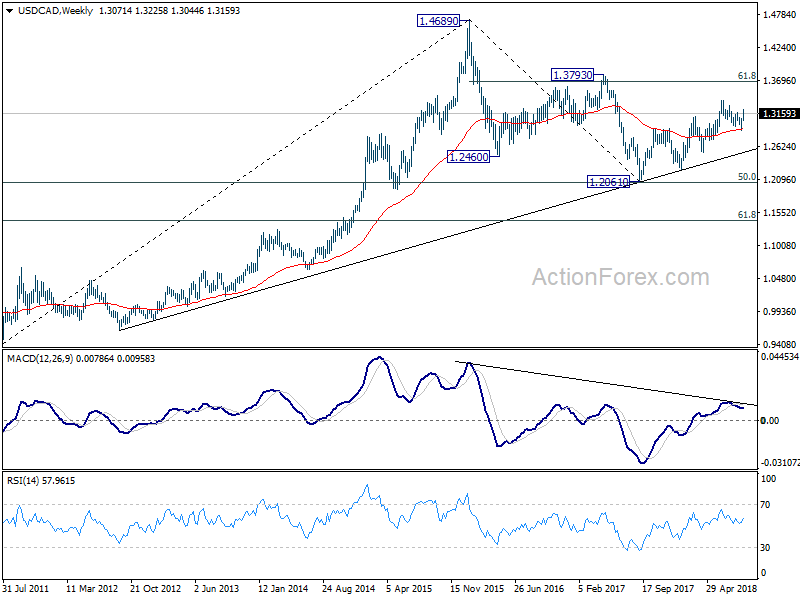
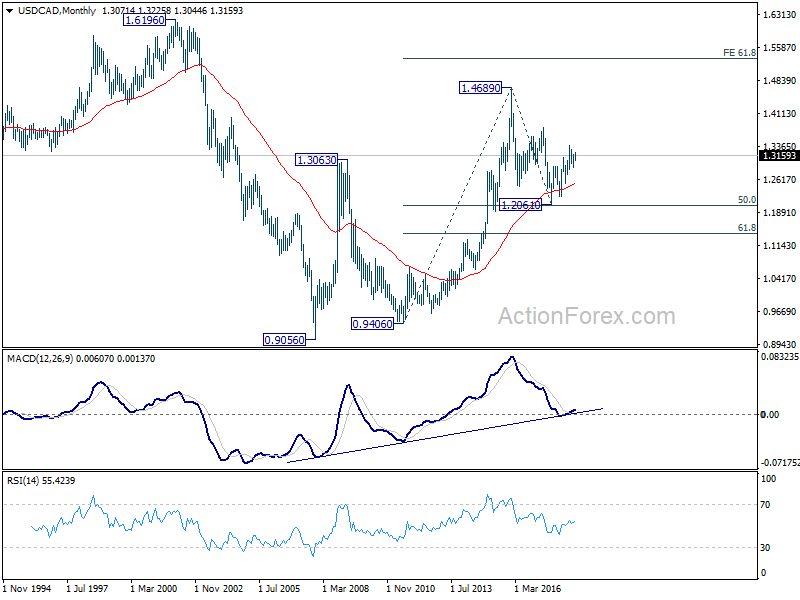
In the longer term picture, corrective fall from 1.4689 (2015 high) should have completed with three waves down to 1.2061, just ahead of 50% retracement of 0.9406 (2011 low) to 1.4689 (2015 high) at 1.2048. The development keeps long term up trend from 0.9406 and that from 0.9056 (2007 low) intact. For now, there is prospect of extending the long term up trend to 61.8% projection of 0.9406 to 1.4689 from 1.2061 at 1.5326 in medium to long term.
GBP/JPY Weekly Outlook
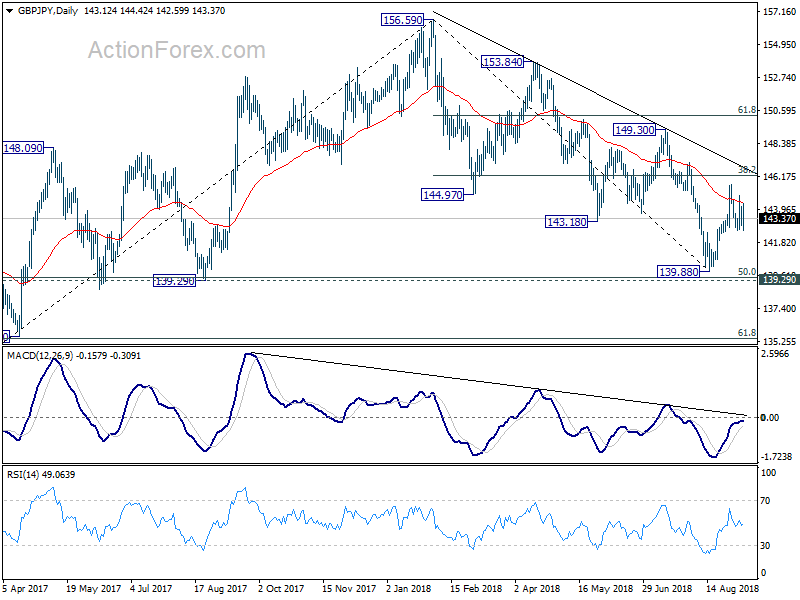
GBP/JPY stayed in range of 142.58/145.67 last week and outlook is unchanged. Initial bias remains neutral this week first. On the upside, break of 145.67 will target 38.2% retracement of 156.59 to 139.88 at 146.26. Decisive break there will be a strong signal that fall from 156.59 has completed at 139.88, ahead of 139.29/47 key support zone. Further rally should then be seen to 149.30 resistance for confirmation. On the downside, though, break of 142.58 will turn bias back to the downside for retesting 139.88 low instead.
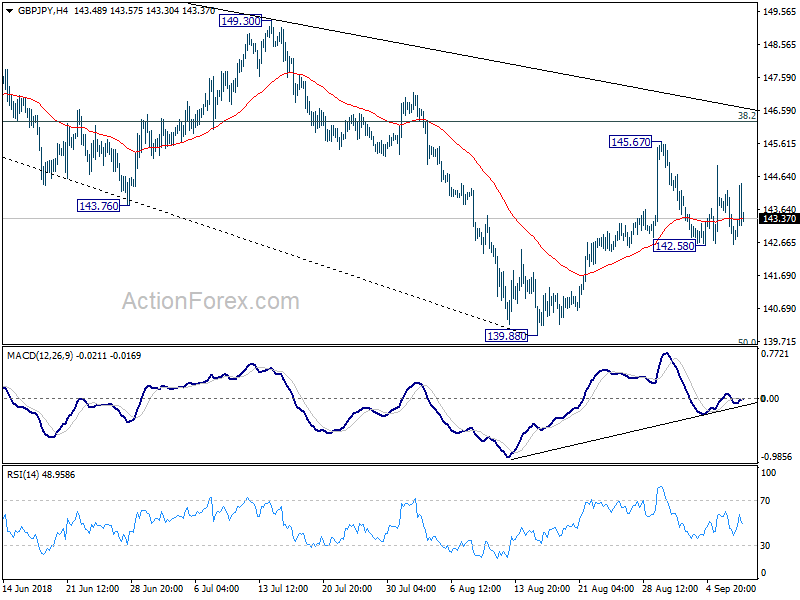
In the bigger picture, at this point decline from 156.59 is still seen as a corrective move. Focus remains on 139.29 cluster support (50% retracement of 122.36 to 156.59 at 139.47). Strong rebound from there will re-affirm the bullish case that rise from 122.36 is still to extend through 156.59 high. However, sustained break of 139.29/47 should confirm medium term reversal. GBP/JPY would then target a retest on 122.26 (2016 low).
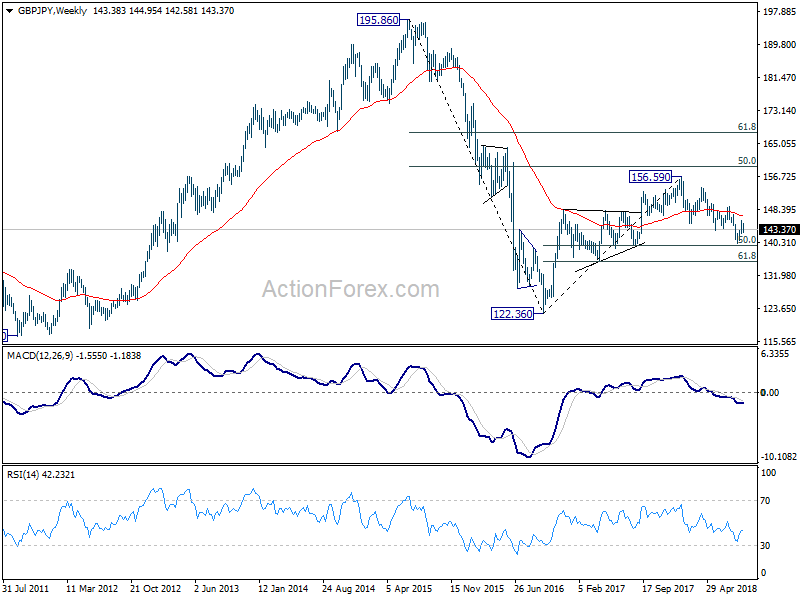
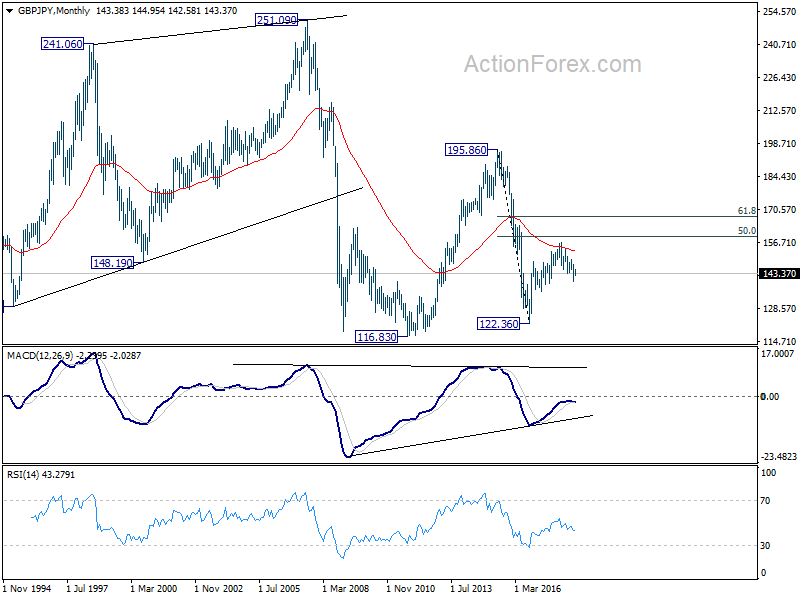
In the longer term picture, the failure to sustain above 55 month EMA (now at 152.97) is mixing up the outlook. Nonetheless, as long as 139.29 holds, rise from 122.36 is in favor to extend to 50% retracement of 195.86 (2015high) to 122.36 (2016 low) at 159.11, and possibly further to 61.8% retracement at 167.78 before completion. However, firm break of 139.29 will turn focus back to 116.83/122.36 support zone instead.
EUR/JPY Weekly Outlook
EUR/JPY's decline from 130.86 extended last week and the development suggests that rebound form 124.89 might be completed. Initial bias stays mildly on the downside this week for 61.8% retracement of 124.89 to 130.86 at 127.17. Break will target a test on key support zone at 124.61/89. On the upside, though, break of 129.97 resistance will likely resume the rebound from 124,89 through 130.86.
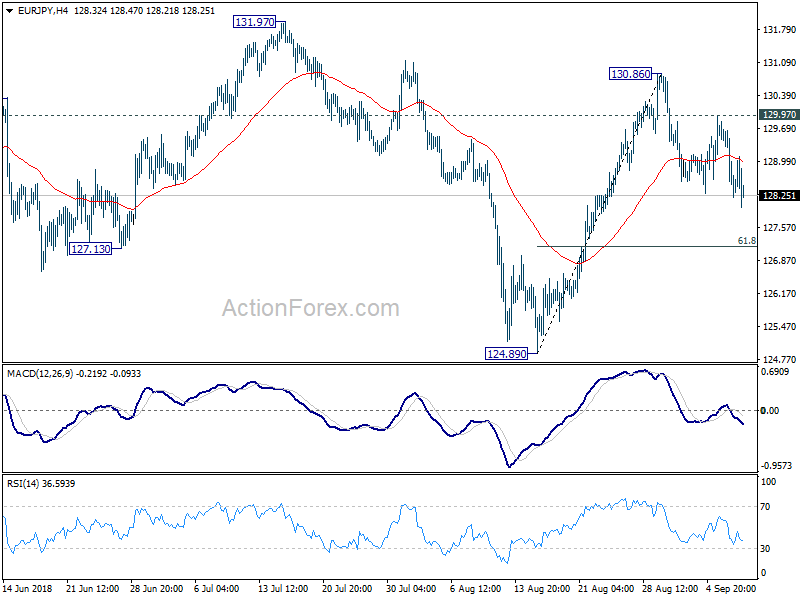
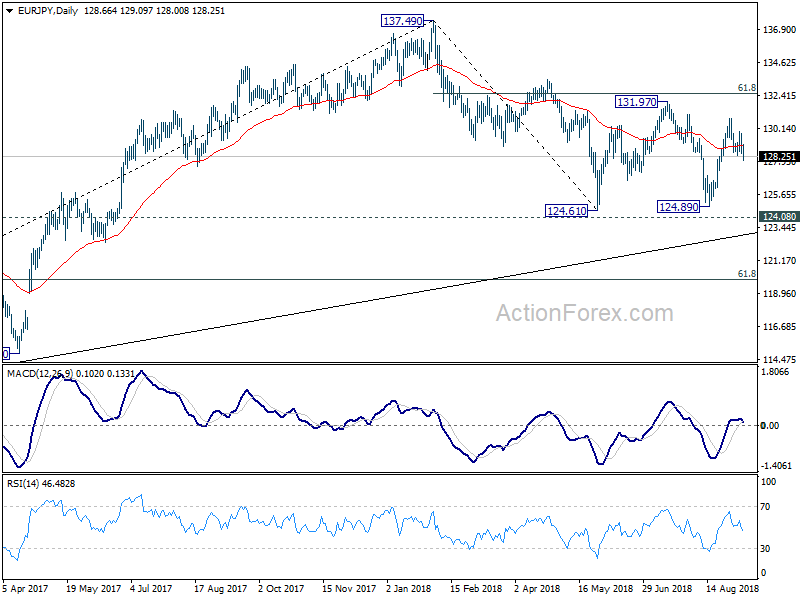
In the bigger picture, as long as 124.08 key resistance turned support, larger up trend from 109.03 (2016 low) remains in favor to continue. Decisive break of 61.8% retracement of 137.49 to 124.61 at 132.56 will pave the way to retest 137.49 high. However, firm break of 124.08 will argue that whole rise from 109.03 (2016 low) has completed at 137.49. Deeper decline would be seen to 61.8% retracement of 109.03 to 137.49 at 119.90 next.
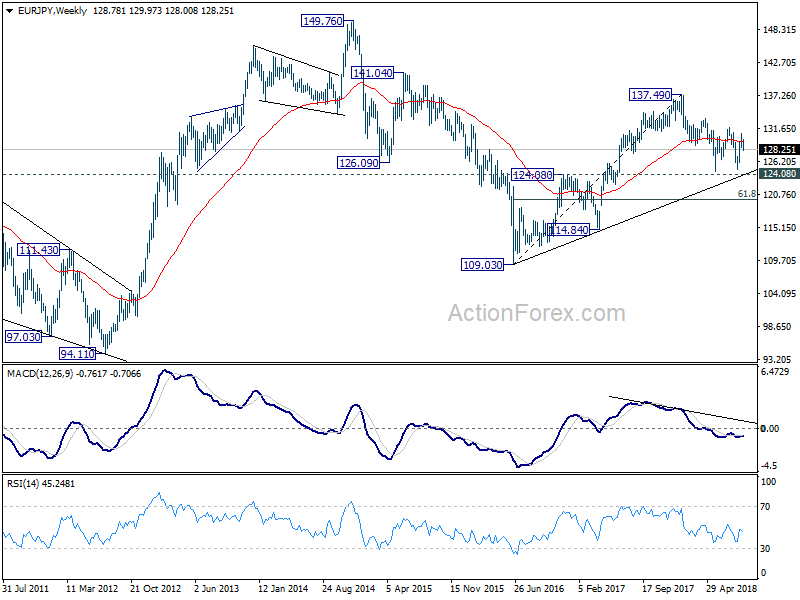
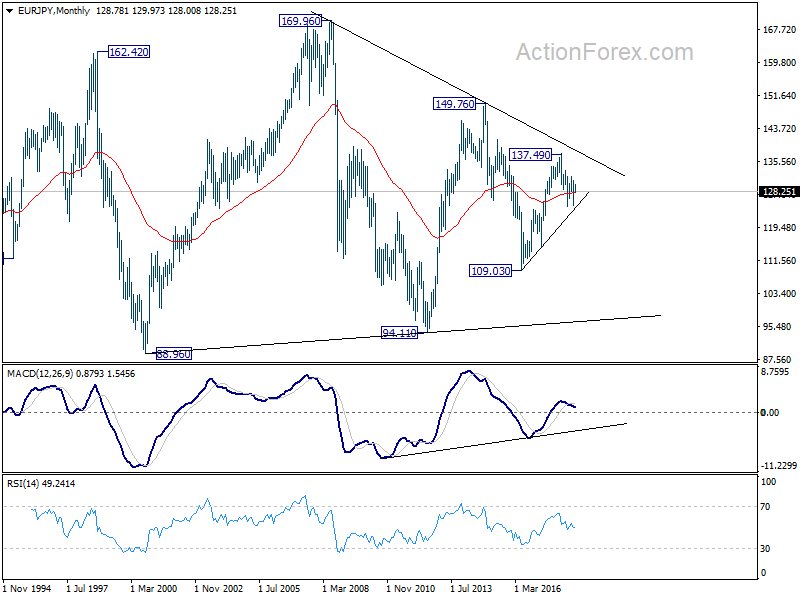
In the long term picture, at this point, EUR/JPY is staying in long term sideway pattern, established since 2000. Rise from 109.03 is seen as a leg inside the pattern. As long as 124.08 support holds, further rally is in favor in medium to long term through 149.76 high. However, break of 124.08 could extend the fall through 109.03 low instead.
EUR/GBP Weekly Outlook
EUR/GBP's strong break of near term channel support last week suggests short term topping at 0.9097. More importantly, the choppy corrective structure of the rise from 0.8620 argues that it's a correction that's completed. Initial bias remains on the downside this week with focus on 38.2% retracement of 0.8620 to 0.9097 at 0.8915. Firm break there will affirm our bearish view and target 61.8% retracement at 0.8802 and below. On the upside, though, above 0.9005 minor resistance will turn focus back to 0.9097 high instead.
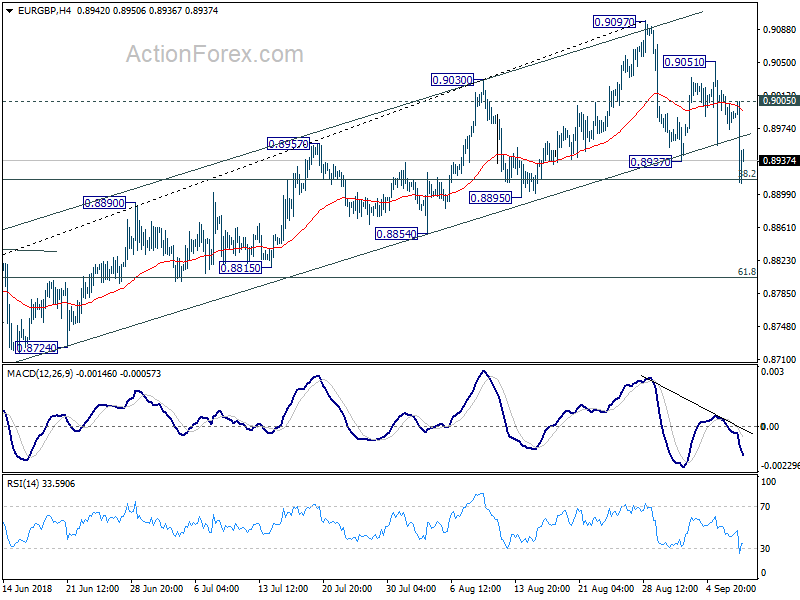
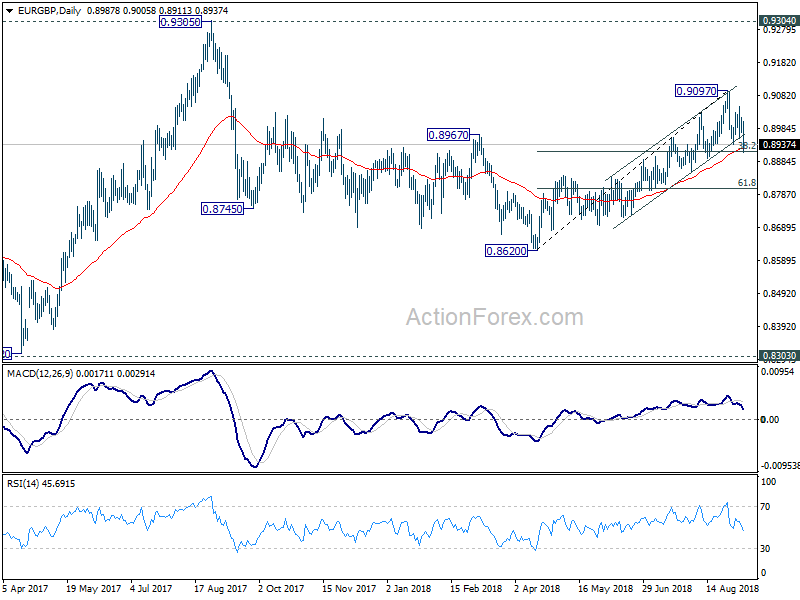
In the bigger picture, EUR/GBP is staying in long term range pattern from 0.9304 (2016 high). At this point, there is no clear sign of range break out yet. And more corrective trading would continue. On the upside, in case of another rise, we'd stay cautious on strong resistance from 0.9304/5 to limit upside in case of further rally. Meanwhile, if there is another medium term decline, strong support will likely be seen from 0.8303 to contain downside.
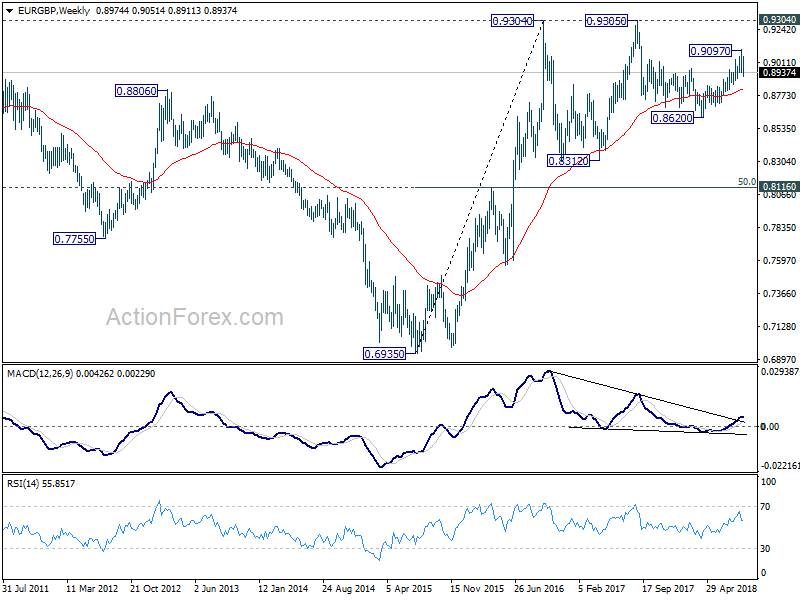
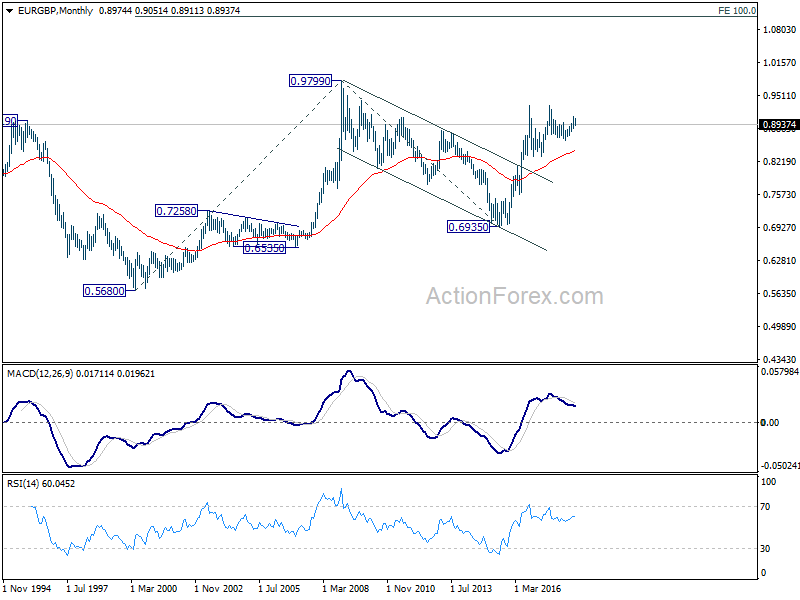
In the long term picture, we're holding on to the view that rise from 0.6935 (2015 low) is resuming the up trend from 0.5680 (2000 low). Hence, after the consolidation from 0.9304 completes, we'd expect another medium term up trend through 0.9799 to 100% projection of 0.5680 to 0.9799 from 0.6935 at 1.1054.
EUR/AUD Weekly Outlook
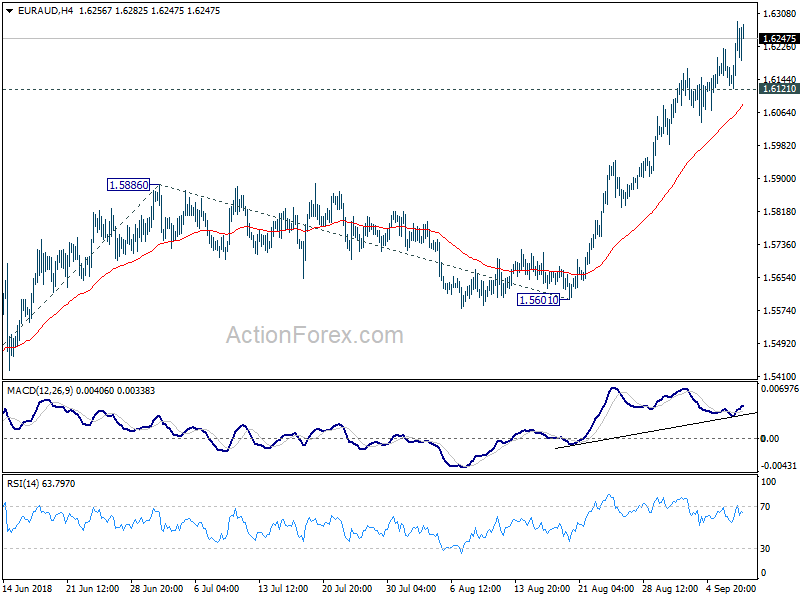
EUR/AUD's rise extend last week and reached as high as 1.6288. The break of 1.6189 confirmed resumption of the up trend from 1.3624. Initial bias remains on the upside this week. Current rally would target 161.8% projection of 1.5271 to 1.5886 from 1.5601 at 1.6596, which is close to another key resistance level at 1.6587. On the downside, below 1.6121 minor support will turn intraday bias neutral and bring consolidation first, before staging another rally.
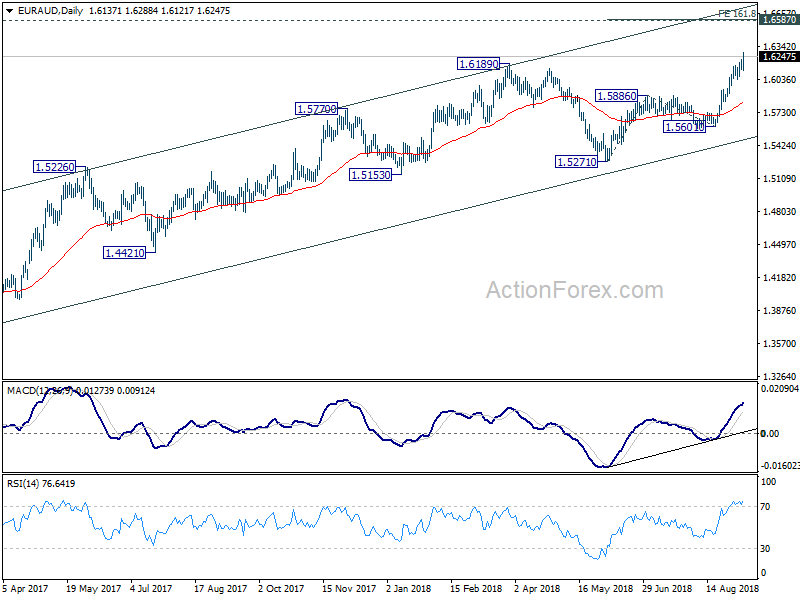
In the bigger picture, up trend from 1.3624 (2017 low) has just resumed. Further rise should be seen to retest 1.6587 (2015 high). Decisive break there will resume the long term rally and target 1.7488 fibonacci level. On the downside, break of 1.5601 support is need to be the first sign of medium term reversal. Otherwise, outlook will remain bullish in case of deep pull back.
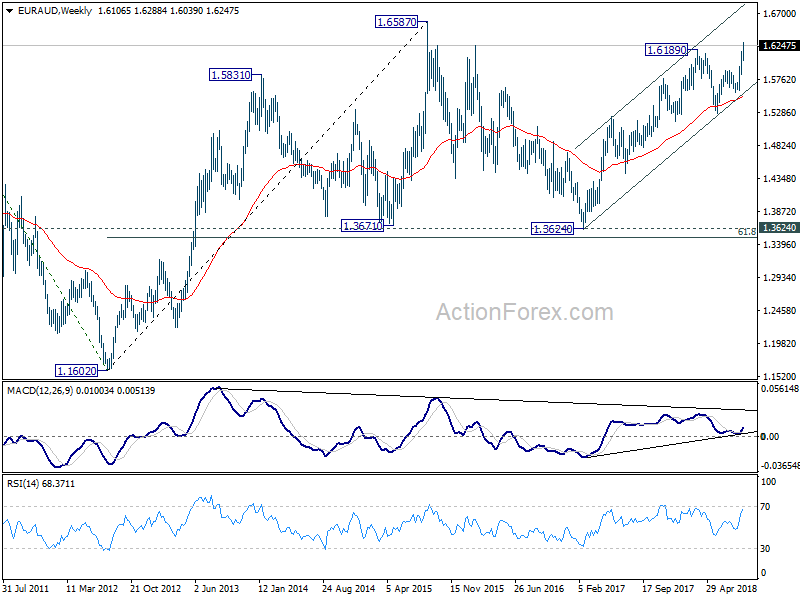
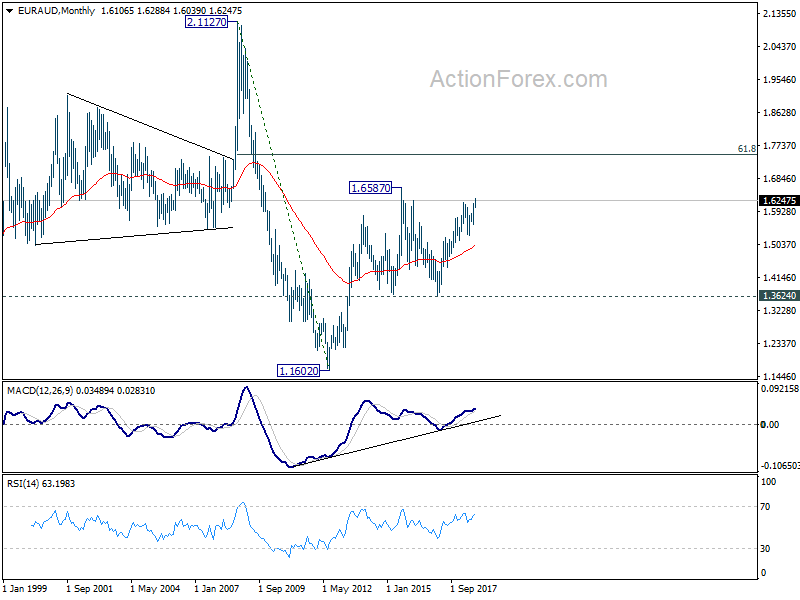
In the longer term picture, the rise from 1.1602 long term bottom (2012 low) isn't over yet. We'll keep monitoring the development but there is prospect of extending the rise to 61.8% retracement of 2.1127 to 1.1602 at 1.7488 and above. However, sustained trading below 1.3624 key support should indicate long term reversal and target 1.1602 long term bottom again.
EUR/CHF Weekly Outlook
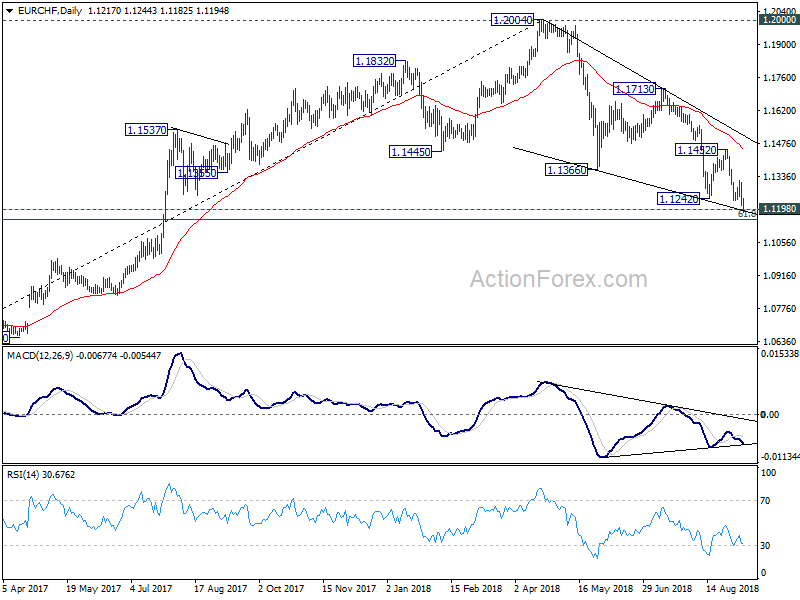
EUR/CHF's decline extended last week and reached as low as 1.1185. The cross is now in key support zone of 1.1154/98. We're still expect strong support from the current level to contain downside and bring rebound. And break of 1.1319 resistance will indicate short term bottoming. In such case, intraday bias will be turned back to the upside for 1.1452 resistance next. However, sustained break of 1.1154/98 will carry larger bearish implications.
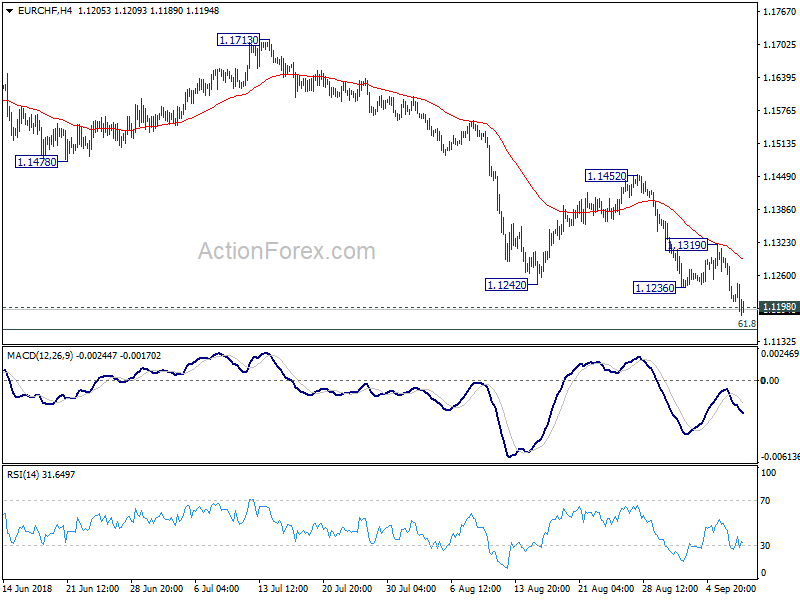
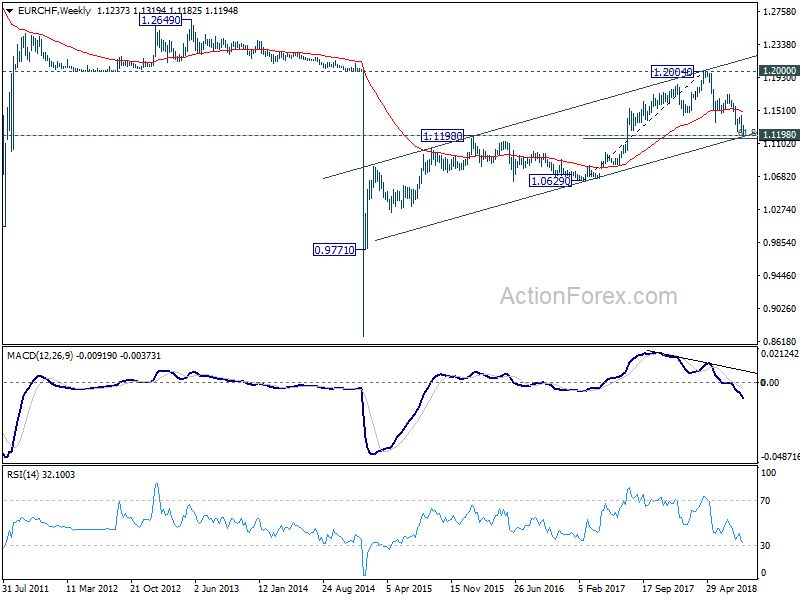
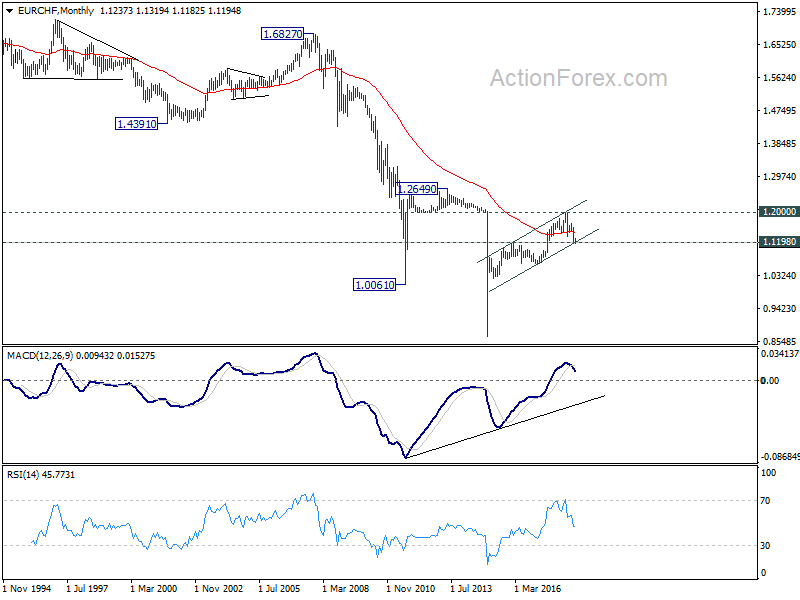
In the bigger picture, for now, the price actions from 1.2004 medium term top is seen as a correction only. Downside should be contained by support zone of 1.1198 (2016 high) and 61.8% retracement of 1.0629 to 1.2004 at 1.1154 to complete it and bring rebound. This cluster level is in proximity to long term channel support (now at 1.1196) too. A break of 1.2 key resistance is still expected in the medium term long term. However, sustained break of the mentioned support zone will mark reversal of the long term trend. In that case, 1.0629 key support will be back into focus.
Trump’s trade policy failed again in August, China bought more from others, but US stayed the same
It's still early to tell. But trade data from China showed that Trump's trade policy failed for another month.
It's clear that China increased imports from other regions in August like EU (10.6% yoy) and AU (34.0% yoy). Import from US slowed drastically to 2.7% yoy. On the other hand, exports to the US still grew steadily at 13.2% yoy comparing to EU (8.3% yoy) and AU (23.3% yoy). In the end, trade surplus with the US grew 18.4% yoy. And, trade surplus with EU just rose 4.0% yoy. Trade deficit with AU has indeed jumped 45.7% yoy.
For year-to-August, exports to USD rose 13.0% yoy while imports rose 10.3% yoy. Trade surplus rose 14.6% yoy. At the same time, imports from EU rose 14.9% yoy, from AU rose 14.6% yoy. Trade surplus with EU just rose 2.6% yoy. And trade deficit with AU rose 12.2%.
In the end, it's not the size of trade that matters, but how elastic the demand and supply that matter. For now, it seems like the US is maintaining the pace of growth in Chinese imports. But China is quickly turning to other countries for goods.
Below are some more details.
In CNY terms in August, China's total trade rose 12.7% yoy to CNY 2.71T. Exports rose 7.9% yoy to CNY 1.44T. Imports rose 18.8% yoy to CNY 1.26T. Trade surplus came in at CNY 180B, wider than July's CNY 177B.
Year-to-August, total trade rose 9.1% yoy to CNY 19.4. Exports rose 5.4% yoy to CNY 10.3T. Imports rose 13.7% yoy to CNY 9.1T. Trade surplus came in at CNY 1246B.
In USD terms in August, total trade rose 14.3% yoy to USD 407B. Exports rose 9.8% yoy to USD 217B. Imports rose 20.0% yoy to 190B. Trade surplus came in at USD 27.9B, narrowed from July's USD 28.1B.
Year-to-August, total trade rose 16.1% yoy to USD 3.02T. Exports rose 12.2% yoy to USD 1.60T. Imports rose 20.9% to USD 1.41T. Trade surplus came in at USD 193.6B.
Looking at some details, for the month of August:
- Exports to EU rose 8.3% yoy to USD 37.0B, imports from EU rose 10.6% yoy to USD 24.9B, trade surplus rose 4.0% to USD 12.1B
- Exports to US rose 13.2% yoy to USD 44.4B, imports from US rose 2.7% yoy to USD 13.3B, trade surplus rose 18.4% to USD 31.1B
- Exports to AU rose 23.3% yoy to USD 4.3B, imports from AU rose 34.0% yoy to USD 9.0B, trade deficit rose 45.7% to USD -4.7B
For year-to-August
- Exports to EU rose 10.7% yoy to USD 265.6B, imports from EU rose 14.9% yoy to USD 180.4B, trade surplus rose 2.6% yoy to USD 84.2B
- Exports to US rose 13.0% yoy to USD 303.4B, imports from US rose 10.3% yoy to USD 110.8B, trade surplus rose 14.6% to USD 192.6B
- Exports to AU rose 18.1% yoy to USD 30.1B, imports from AU rose 14.6% yoy to USD 71.2B, trade deficit rose 12.2% yoy to USD -41.2B.
Summary 9/10 – 9/14
Monday, Sep 10, 2018
[php_everywhere instance="1"]
Tuesday, Sep 11, 2018
[php_everywhere instance="2"]
Wednesday, Sep 12 2018
[php_everywhere instance="3"]
Thursday, Sep 13, 2018
[php_everywhere instance="4"]
Friday, Sep 14, 2018
[php_everywhere instance="5"]
Weekly Economic and Financial Commentary: Economy Appears Solid Despite Trade Tensions
U.S. Review
Economy Appears Solid Despite Trade Tensions
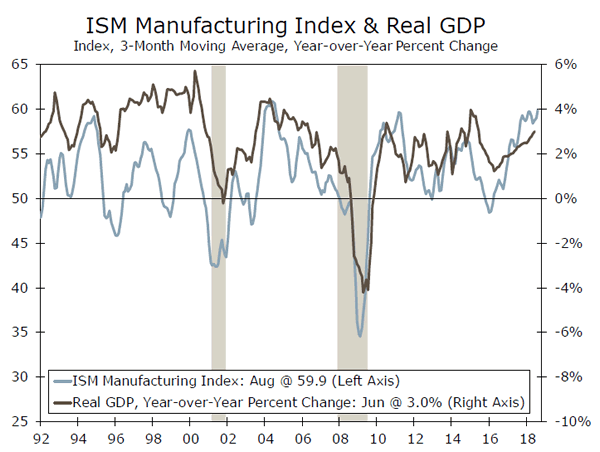
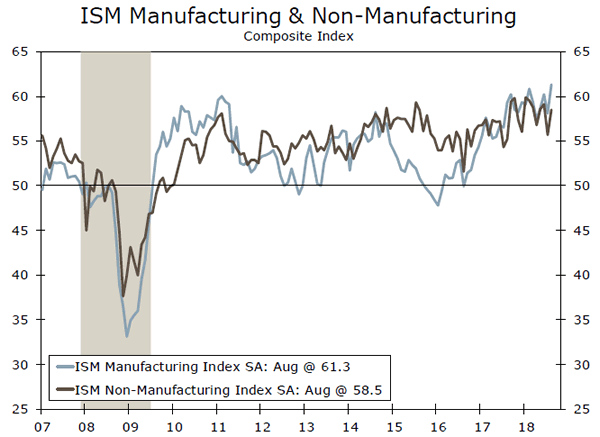
- Despite ongoing concerns surrounding trade policy, business activity reportedly picked up in August. The ISM manufacturing and non-manufacturing indices both advanced, increasing to 61.3 and 58.5, respectively.
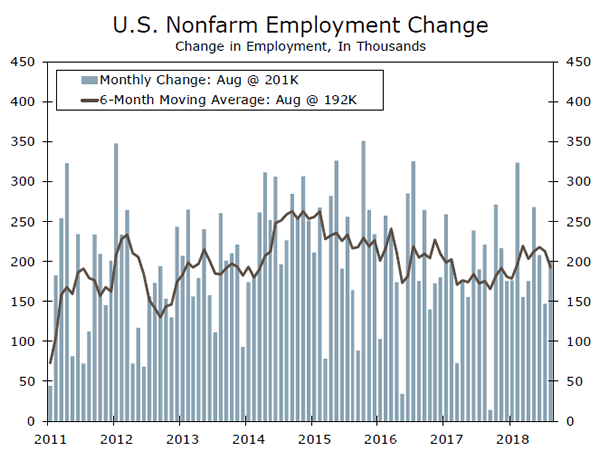
- Employers added 201,000 new jobs in August. The unemployment rate was unchanged at 3.9%. Average hourly earnings are now up 2.9% year-over-year, a new cycle high.
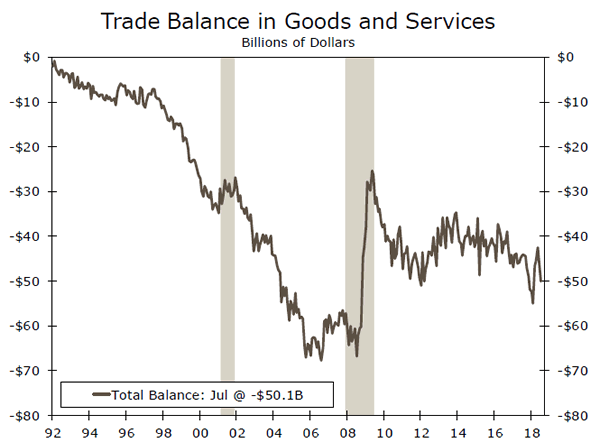
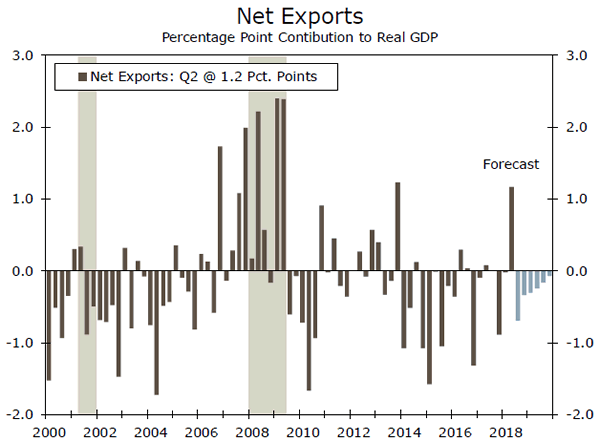
- The trade deficit rose to $50.1 billion in July as exports dropped 1.0%. In contrast to the substantial contribution in Q2, we expect trade to weigh on GDP growth in coming quarters.
Economy Appears Solid Despite Trade Tensions
Evidence continued to mount this week that economic growth is poised to remain solid in the third quarter. Trade tensions continue to escalate, and consecutive drops in exports in June and July will likely lead to a reversal of trade's second quarter boost to overall GDP growth. However, overall business activity reportedly remains strong, as both the ISM manufacturing and nonmanufacturing indices advanced higher in August. The labor market also continued to improve and employers continue to add jobs across a wide array of industries.
Employers added 201,000 new jobs in August. The prior two months of additions were revised down 50,000, bringing the three-month average to 185,000. Gains in August were broadbased, with most industries adding jobs over the month, notably the transportation and warehousing & construction sectors. Manufacturing jobs fell slightly during the month. The unemployment rate was unchanged at 3.9%; however, the labor force participation rate dropped to 62.7%. Meanwhile, wage growth continues to trend higher. Average hourly earnings increased 0.4% for the month and 2.9% on a year-over-year basis, a new cycle high.
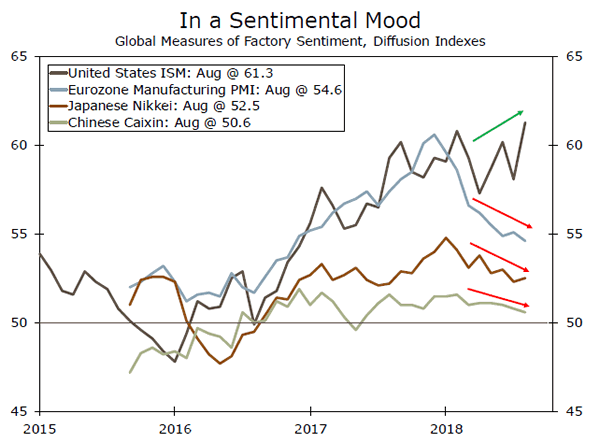
Manufacturing activity appeared unscathed by trade tensions in August. The ISM manufacturing index hit 61.3, the highest reading in 14 years. Both the current production and new orders indices posted large increases during the month. The prices paid component eased somewhat, but remained elevated at a still-high 72.1. Tariffs were mentioned by several respondents who noted suppliers were able to pass on tariff-related price increases. Meanwhile, capacity constraints tightened as supplier delivery times and order backlogs increased.
Outside of the factory sector, firms also reported a positive assessment. The ISM non-manufacturing index topped expectations and jumped 2.8 points to a 58.5 reading in August. The current activity, new orders and backlog sub-indices each edged higher during the month, indicating that the pick-up in activity was broad-based. The prices paid index eased, but remained high at 62.8.
Meanwhile, the surge in exports in the second quarter as some businesses rushed to get merchandise out the door ahead of retaliatory tariffs will likely be reversed in the third quarter. Total exports fell 1.0% in July, bringing the trade deficit to $50.1 billion. The dip in exports follows a 0.7% drop in June. The consumer goods, capital goods and food & beverage categories also saw significant gains in May only to be followed by back-to-back declines in June and July. Meanwhile, strong consumer spending and business investment continued to support demand for imports, which increased 0.9% in July. Gains were broad-based with imports increasing in five out of six major categories. Net exports are poised to be a drag on overall GDP growth in the third quarter, and even if the tariff fight were to be settled, trade is not expected to be a significant driver of growth in coming years.
U.S. Outlook
CPI • Thursday
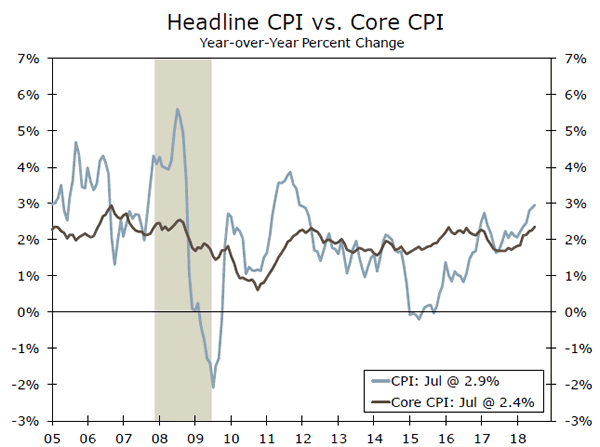
The headline CPI rose 0.2% in July, putting the year-over-year increase at 2.9% for the fastest pace in six years. While a drop in energy prices caused a smaller rise in overall inflation, core inflation rose 2.4% year-over-year to reach a new cycle high. The July surge in core inflation was led by a continued increase in services prices, along with a pickup in airfares and prices for new and used autos. Although rising energy prices have been a key factor behind rising inflation in recent months, we look for energy prices to moderate going forward. While higher inflation has restrained real wage growth over the past year, lower energy prices should give consumers some relief in the coming months, and a continued tight labor market should also support wage growth. Given the steady rise in core CPI that has kept track with the pace of PCE inflation, it looks to be full steam ahead for the FOMC to raise rates twice more this year, and we look for core inflation to continue to firm into 2019.
Previous: 2.9% Wells Fargo: 2.7% Consensus: 2.8% (Year-over-Year)
Retail Sales • Friday
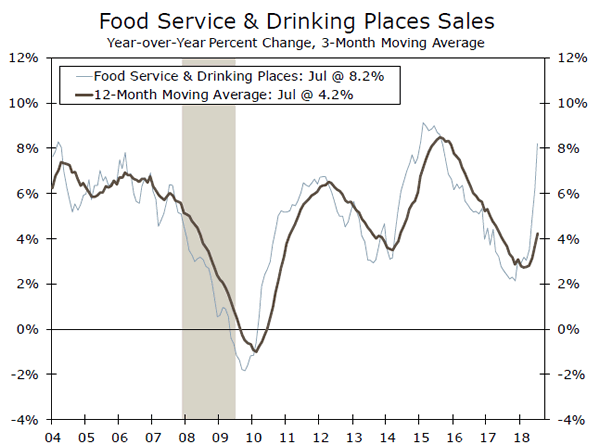
Retail sales rose a solid 0.5% in July, supported by broad-based strength in multiple sectors. Both non-store retailers and traditional retailers posted steady increases in the month. Non-store retail sales has been one of the fastest-growing categories over the past year, with the 8.7% year-over-year gain second only to gas station sales. Consumers also continued the trend of eating out in July, with food service and drinking places sales rising 1.3%, more than twice the increase for traditional grocery and liquor store sales. Auto sales also rose in July, possibly due to preemptive purchases in response to threatened auto tariffs that could push up prices if put into effect.
While the Q2 GDP revision released last week showed that consumer spending rose a strong 3.8% annualized in Q2, rising consumer price inflation could restrain the more rapid pace of real consumer spending seen in recent months. In the near term, we look for retail sales to rise 0.5% in August.
Previous: 0.5% Wells Fargo: 0.5% Consensus: 0.5% (Month-over-Month)
Industrial Production • Friday
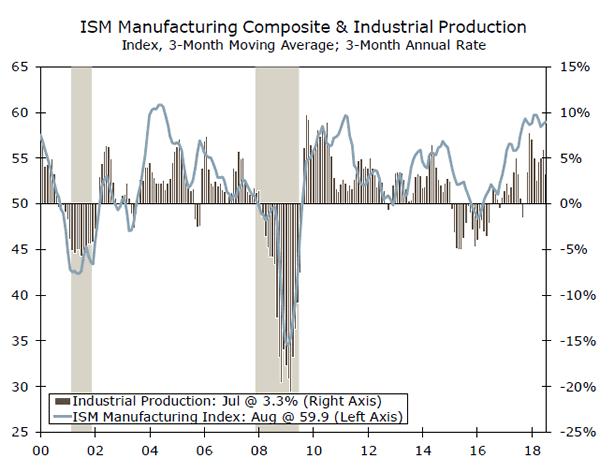
Industrial production rose a lower-than-expected 0.1% in July, as the utilities and mining sectors each posted declines. Manufacturing production increased a stronger 0.3%, supported by rising auto and machinery output. There is also some evidence that the steel and aluminum tariffs implemented earlier this year are affecting output in those industries, with iron and steel production up over 7% from a year ago. Overall capacity utilization also continued to rise in July, and signals rising price pressures in the manufacturing sector. The ISM report released earlier this week also offers clues into the state of the manufacturing sector in August. The overall ISM index reached a 14-year high of 61.3, suggesting that manufacturing activity held strong even amid trade concerns. However, the prices paid component remained above 70 for the eighth consecutive month, and we look for tighter capacity and higher prices to restrain production growth in coming months.
Previous: 0.1% Wells Fargo: 0.3% Consensus: 0.3% (Month-over-Month)
Global Review
Emerging Market Concerns Ease
- Fears around emerging market contagion eased this week, allowing the focus to shift back to global central bank developments and economic data releases.
- The Bank of Canada held policy steady this week but signaled a possible acceleration in the pace of rate hikes, although Canada's jobs report was disappointing.
- On the policy front, Brexit negotiations showed tentative signs of making progress, although a preliminary deal remains elusive for now. Meanwhile, markets remain on edge around global trade tensions, with concerns Japan may be the next target for U.S. tariffs.
Emerging Market Concerns Ease
Sentiment around the global economic outlook started off the week on a sour note, with concerns around emerging markets carrying over from the week prior. While Argentina was a source of concern last week, focus shifted to South Africa this week as data showed that country's economy unexpectedly slipped into recession in Q2 as real GDP declined 0.7% on a sequential annualized basis. That said, those emerging market concerns dissipated as the week went on, and focus eventually shifted back to central banks and data releases in developed markets.
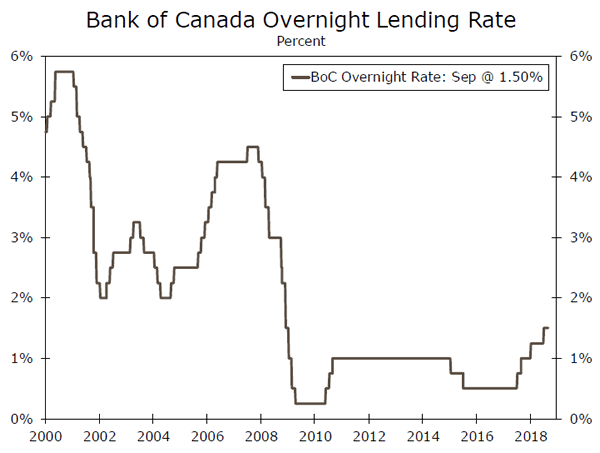
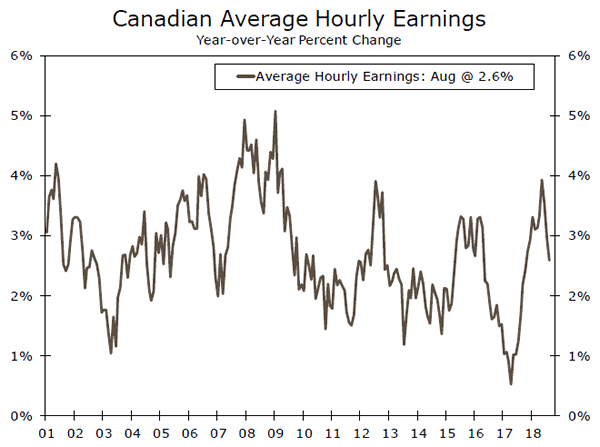
First, the Bank of Canada (BoC) held its overnight rate at 1.50% as expected, but said it was watching NAFTA progress closely. In later comments, BoC Deputy Governor Wilkins suggested the central bank debated whether to accelerate the pace of rate increases. That guidance is a reminder that Canada's central bank is among the most active major central banks in normalizing monetary policy, having already raised rates 100 bps since mid-2017. However, data released this week showed Canadian employment unexpectedly fell 51,600 in August, while wage growth slowed to 2.6% year-overyear. Elsewhere, Sweden's central bank also met this week and made no change to policy but provided more dovish signals, as it suggested it could raise interest rates in either December or February. Previously, the central bank had said it would raise rates sometime later this year, with the latest guidance suggesting a more cautious approach.
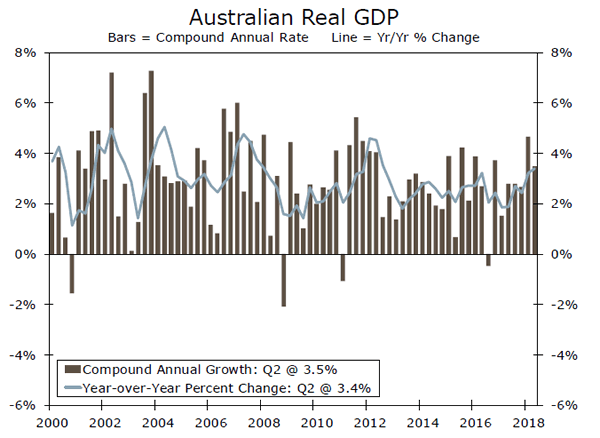
Australia's central bank also met this week, and while it held policy steady and suggested rate increases were unlikely for quite some time, it also acknowledged the recent strengthening in Australian economic growth. Indeed, data released earlier this week showed real GDP rose 3.4% year-over-year in Q2. That represents the quickest annual growth rate since 2012, but with inflation stuck near the bottom of the central bank's target range, there seems to be no urgency to raise interest rates anytime soon.
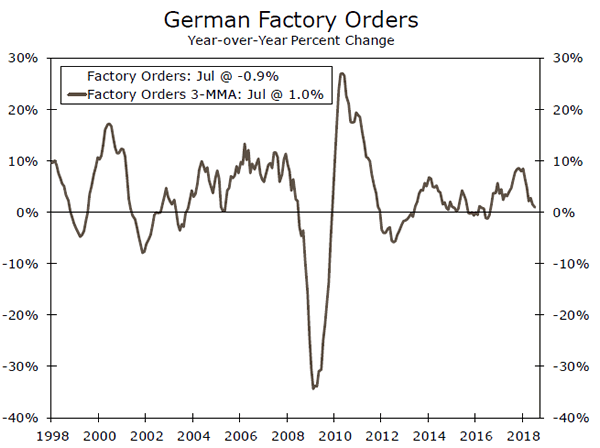
The European region also drew some market attention this week. Eurozone data for July were generally subdued, as German factory orders unexpectedly declined 0.9% and Eurozone retail sales fell 0.2% over the month. Meanwhile, in the United Kingdom, sentiment data were mixed as the manufacturing PMI softened to 52.8 in August but the services PMI was stronger than expected, rising to 54.3. Separately, comments from E.U. and U.K. negotiators suggested tentative, albeit gradual, progress toward reaching a preliminary Brexit deal ahead of the March 2019 deadline.
Elsewhere on the policy front, concerns continued to linger around the ongoing global trade tensions. After the public comment period ended this week for the U.S. proposed tariffs on $200 billion of Chinese goods, there appear to be concerns that the U.S. administration may move forward with at least a portion of those proposed tariffs before long. Meanwhile, U.S. President Trump hinted that Japan could become a focus for new trade measures, a sign that global trade tensions could not only persist but also become more broadly based.
Global Outlook
U.K. Labor Market Report • Tuesday
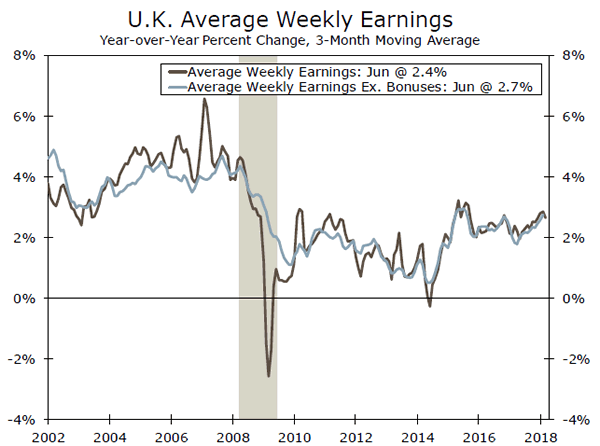
Next week is a busy one for the U.K. economy, with a number of key data releases followed by a policy announcement from the Bank of England (BoE). Among the key releases will be industrial output figures, which will likely be closely watched for any clues that Brexit uncertainty is affecting manufacturing sentiment. Meanwhile, the labor market report is also scheduled for release next week, and the wage figures will likely be the key focus of that report for markets. U.K. wage growth has been fairly steady in recent months, but slowing inflation has eased some pressure on U.K. consumers.
As for the BoE, which is scheduled to announce policy on Thursday of next week, we do not expect many new developments. The BoE raised its Bank Rate 25 bps to 0.75% at its August meeting, and further increases seem unlikely to be considered unless or until Brexit uncertainty is resolved.
Previous: 2.4% Consensus: 2.5% (Average Weekly Earnings, Year/Year)
European Central Bank Meeting • Thursday
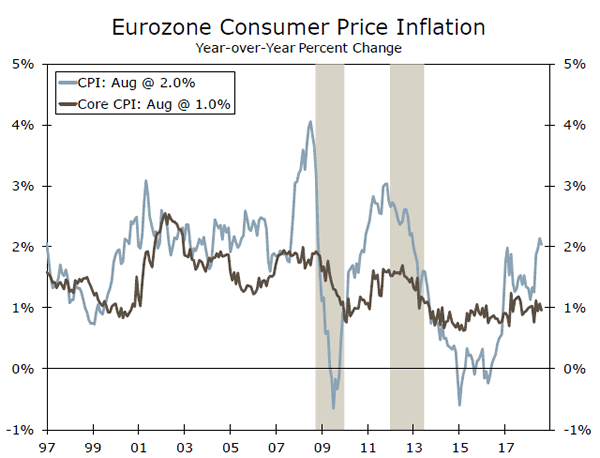
The European Central Bank (ECB) has been unwavering in its policy guidance since June, when it signaled it would end asset purchases by December but that it would likely keep interest rates steady until after summer 2019. A combination of soft European economic data, concerns around Italy and ongoing trade tensions have all conspired to keep ECB guidance fairly cautious, while still-subdued Eurozone core inflation has reduced the need for near-term policy normalization.
In our view, the ECB is unlikely to provide many new signals at its policy announcement next week, particularly given ongoing concerns around Italy and global trade. Instead, we believe it is more important to monitor the incoming European data flow for clues on whether the ECB might deviate from the policy schedule it laid out at its June announcement.
Previous: -0.40% Wells Fargo: -0.40% Consensus: -0.40% (Deposit Rate)
China Retail Sales • Friday
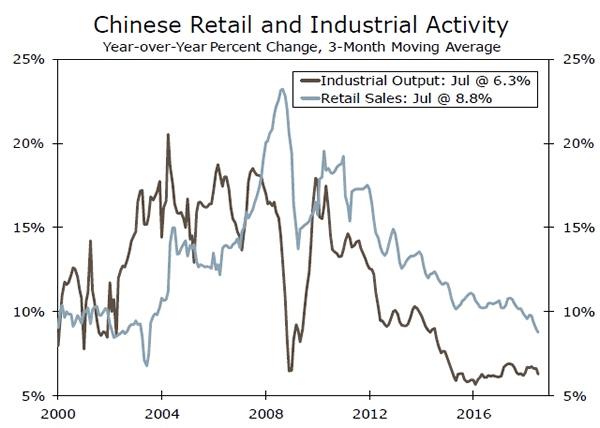
The Chinese economy has been a key focus for markets in recent months as U.S.-China trade tensions have simmered. Chinese growth and activity figures have softened over the past few months, with retail sales in particular showing signs of slowing. Authorities have taken steps to ease monetary and fiscal policy in an effort to cushion the slowdown, including cuts to the reserve requirement ratio for the country's banks.
Next week's release of Chinese retail sales figures will be important to monitor, particularly for any clues whether recent policy easing measures are starting to cushion the slowdown in economic activity. Also due for release are industrial output and fixed investment figures, as well as monetary indicators, which will provide some insight into how the recent policy measures from Chinese authorities are affecting the amount of liquidity in the economy.
Previous: 8.8% Consensus: 8.8% (Year-over-Year)
Point of View
Interest Rate Watch
EM Turmoil Through a Fed Lens
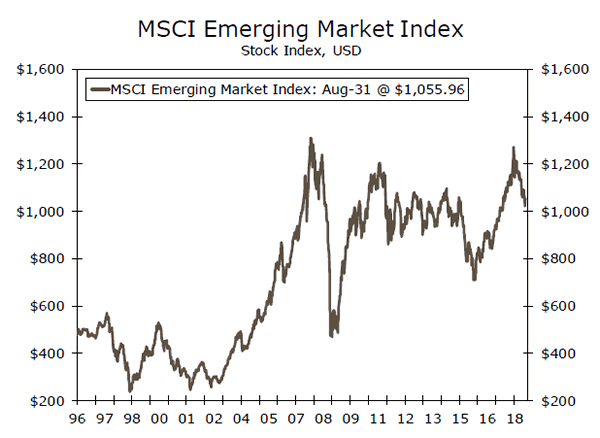
Emerging market (EM) risks were back in the spotlight this week. In contrast to earlier this year, when turmoil was centered on a few select countries, emerging market currencies were broadly under pressure and the MSCI Emerging Market Index neared bear market territory (top chart).
Could current tightening in EM conditions derail the Fed's plans to further tighten policy? Rising U.S. rates are thought to be negative for emerging market capital flows as investors can receive relatively more reward for less risk. Sudden outflows can weaken growth as central banks are forced to raise interest rates to stem the tide. If significant enough, slower growth in EM and a strengthening in the dollar as inflows reverse could weigh on U.S. growth.
"The Role of U.S. Monetary Policy Is Often Exaggerated" – Jerome Powell
Fed officials have shown little concern about the state of emerging markets. EM capital flows received only a passing mention at the most recent FOMC meeting, with Fed staff noting outflows had slowed in recent weeks.
Moreover, Fed Chair Powell gave a speech in May about how the linkages between U.S. monetary policy and global financial conditions were frequently overstated. While monetary policy in the United States (and other advanced economies) influences EM capital flows, the growth differentials that underlie policy decisions and commodity prices also play important roles.
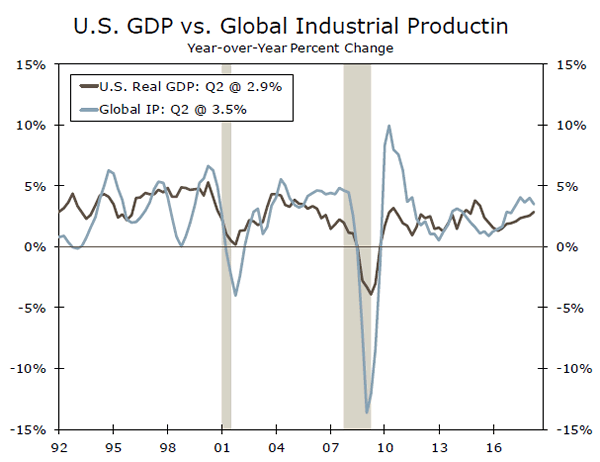
The EM turmoil of the late 1990s suggests conditions would need to worsen significantly to invoke a policy response by the Fed. U.S. growth barely budged over that period even as global growth, proxied by industrial production, slowed sharply (middle chart). It was not until nearly a year after EM stock markets entered bear territory and the dollar had risen roughly 10% before the Fed made a rate cut.
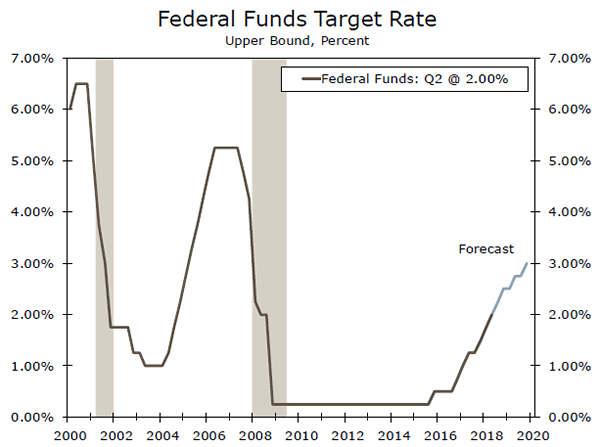
Moreover, as we have discussed in recent reports, on net, finances across EM are in generally better shape today than they were in the late 1990s. As a result, we do not see the recent turmoil as altering the Fed's current policy path, and still expect the FOMC to raise rates twice more this year (bottom chart).
Credit Market Insights
Down Trend in Small Business Loans
Small business loans have been steadily shrinking as a share of total business loans. According to the Federal Deposit Insurance Corporation (FDIC), loans under $1 million represented 20% of commercial & industrial and nonfarm nonresidential loan balances in Q2, matching record lows.
Part of the decline in small business loans can be attributed to inflation, since small loans are classified by the FDIC using nominal dollars. However, inflation alone cannot account for the magnitude of the recent decline. At the peak of the previous economic expansion in 2007, small loans made up 30% of commercial & industrial and 39% of nonfarm nonresidential loans.
Post-financial crisis, small loans declined more in percentage terms than larger ones. While total commercial and industrial loan balances grew 5% from 2011 to 2007, small loans declined 13%. The divergence is even starker for nonfarm nonresidential loans, where small loan balances have shrunk every year since 2009 but total balances returned to positive growth in 2012.
A number of reasons could be behind these trends. Banks have become more cautious lenders since the crisis, and small businesses tend to have shorter credit histories and less access to collateral than more established businesses. In addition, increased availability of financing from non-bank lenders, which tend to have easier lending standards, and healthier profits are likely weighing on demand for small loans from banks.
Topic of the Week
Duke Ellington Economics
While the jobs report and confirmation hearings for the Supreme Court dominated the news cycle this week, some less-widely followed details emerged that offer fresh perspective on the emerging trade conflict.
The ISM manufacturing index jumped to 61.3—its highest level since 2004 when the index was just a tick higher at 61.4, and the second-highest level since 1984.
This euphoria is difficult to square with some of the regional Fed surveys which, while still high, have rolled over in recent months. Aside from the fact that the export orders component slipped for the fourth time in five months, it is difficult to see how the tariff fights are hurting activity in this bellwether for the factory sector.
Mood Indigo
When you check in on the sentimental mood of overseas manufacturers you find a different story. In the top chart, we have plotted the U.S. ISM index against a few of its counterpart measures. Since the tariff talk ramped up this spring, the U.S. measure continued a trend ascent, even as the Japanese Nikkei PMI and Chinese Caixin index both edged lower. In the Eurozone, manufacturers report the slowest pace of expansion since the end of 2016 with the Eurozone PMI having slipped to 54.6.
In My Solitude
How long can the U.S. factory sector continue to go-italone and defy the gravity that has pulled down manufacturing sentiment overseas? That remains to be seen, but after trade boosted growth in the second quarter, it is poised to weigh on growth in Q3. We learned this week for example that exports in July fell for the second straight month, down another 1.0% with a drop on the goods side swamping a scant pick-up in service exports. As the retaliatory tariffs start to bite, we expect that some of the initial enthusiasm with which the tariffs have been met so far will fade as businesses come to terms with the many hard-to-predict ways that protectionist measures can impact global supply chains.
CFTC Commitments of Traders – Traders Expect Gasoline Prices to Fall as Driving Season Ends
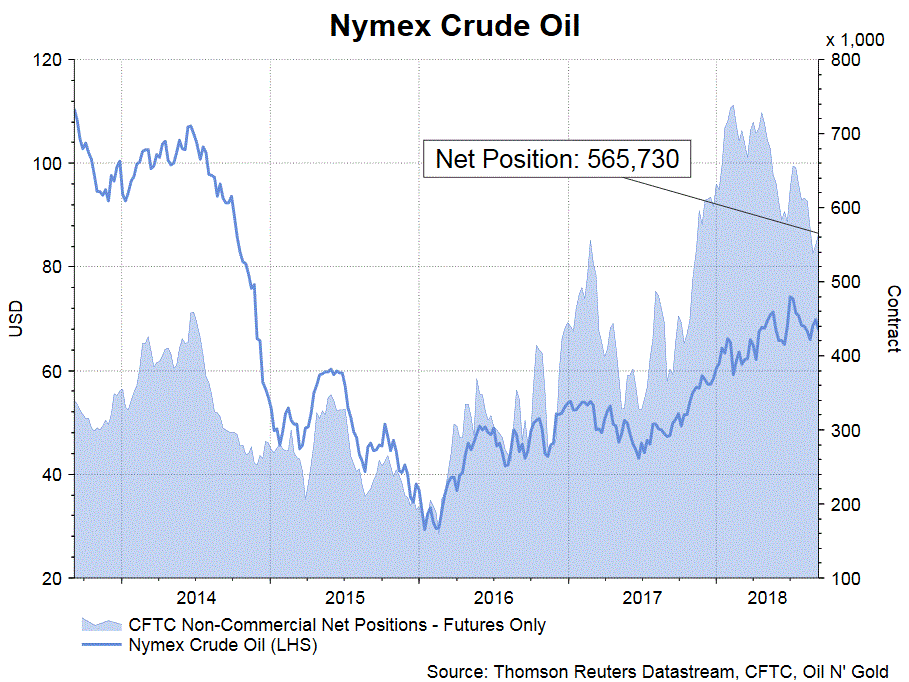
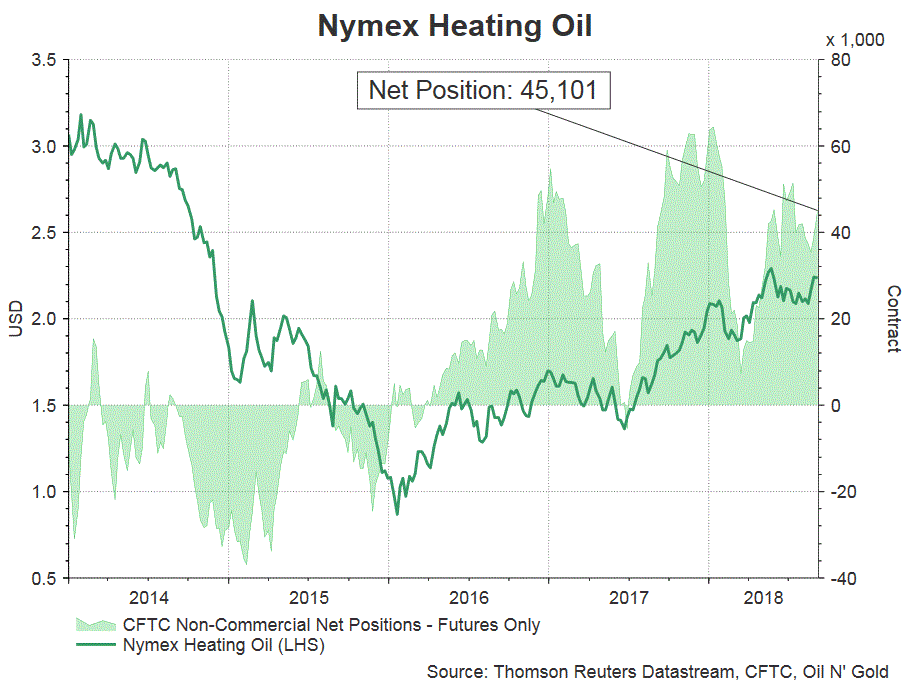
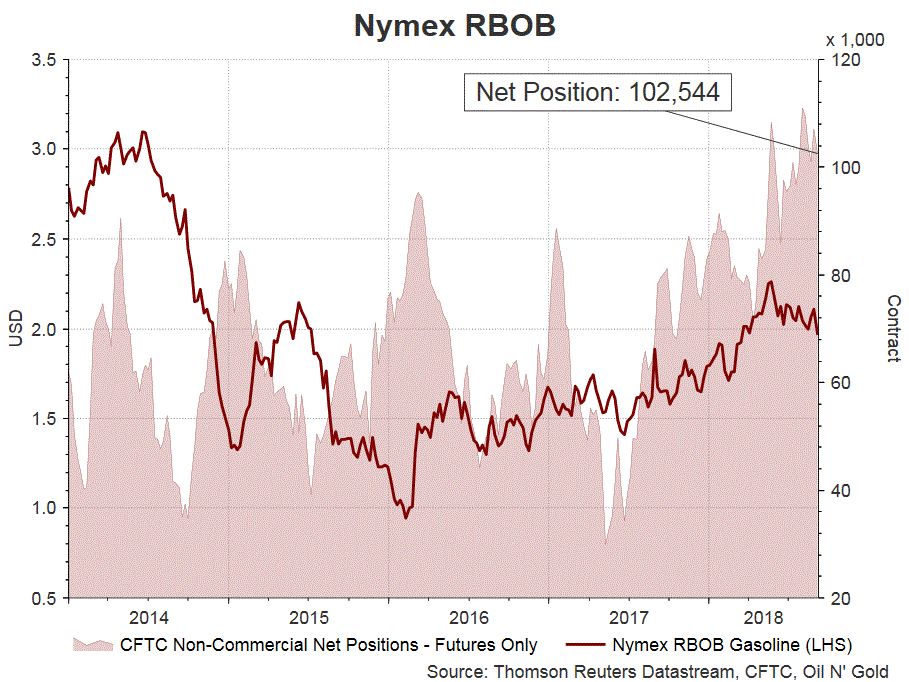
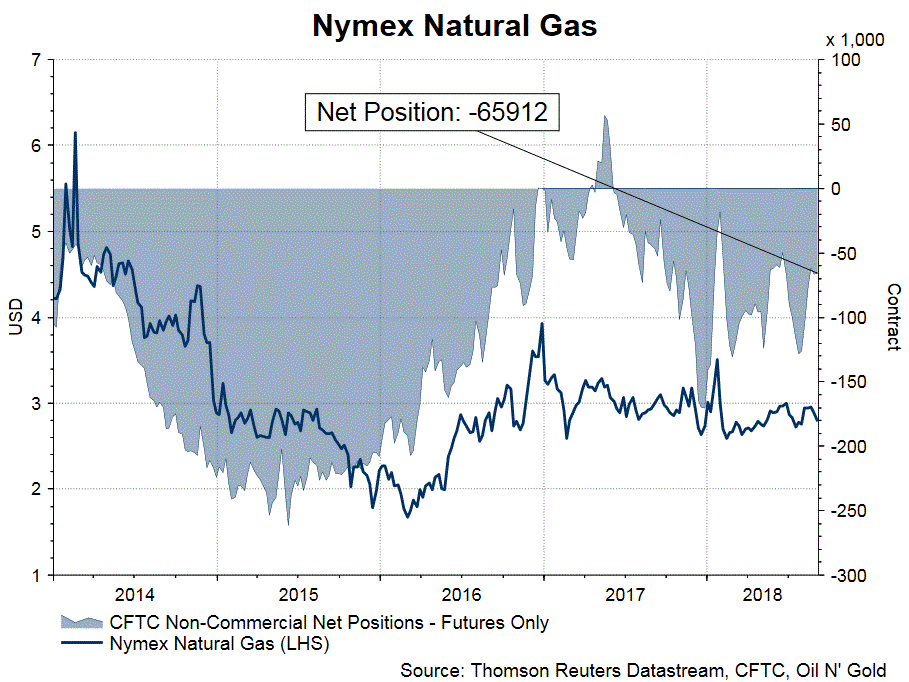
According to the CFTC Commitments of Traders report for the week ended September 4, NET LENGTH for crude oil and heating oil futures rose, while that for gasoline futures dropped. Speculative long positions of crude oil futures jumped +19 043 contracts, while shorts climbed +3 626 contracts higher, resulting in an increase in NET LENGTH, by +15 417 contracts, to 563 730 contracts. For refined oil products, Net LENGTH for heating oil futures added +5 994 contracts to 45 101, while that for gasoline fell -4 586 contracts to 102 544. During the week, the front-month WTI crude oil contract gained +1.96% while the corresponding Brent contract jumped +2.92%. RBOB gasoline price plunged -4.07%. Demand for gasoline should fall as the summer driving season ends. Net SHORT for natural gas dropped -357 contracts, to 65 912 contracts for the week.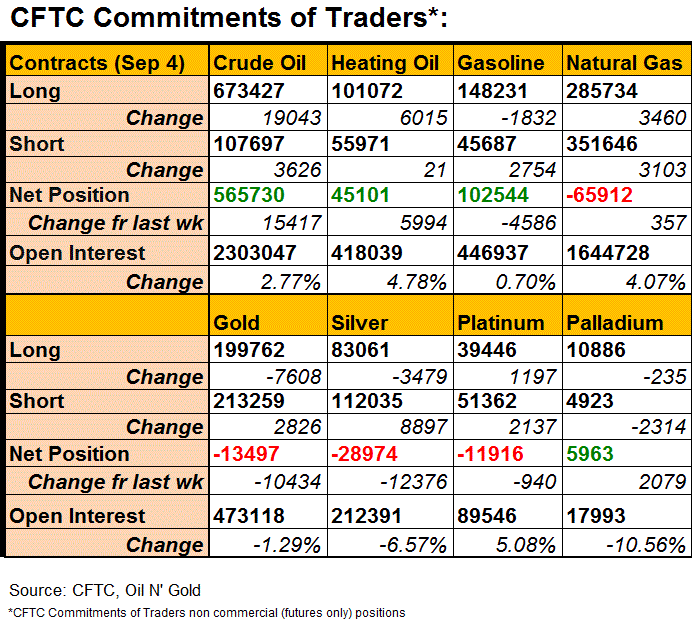
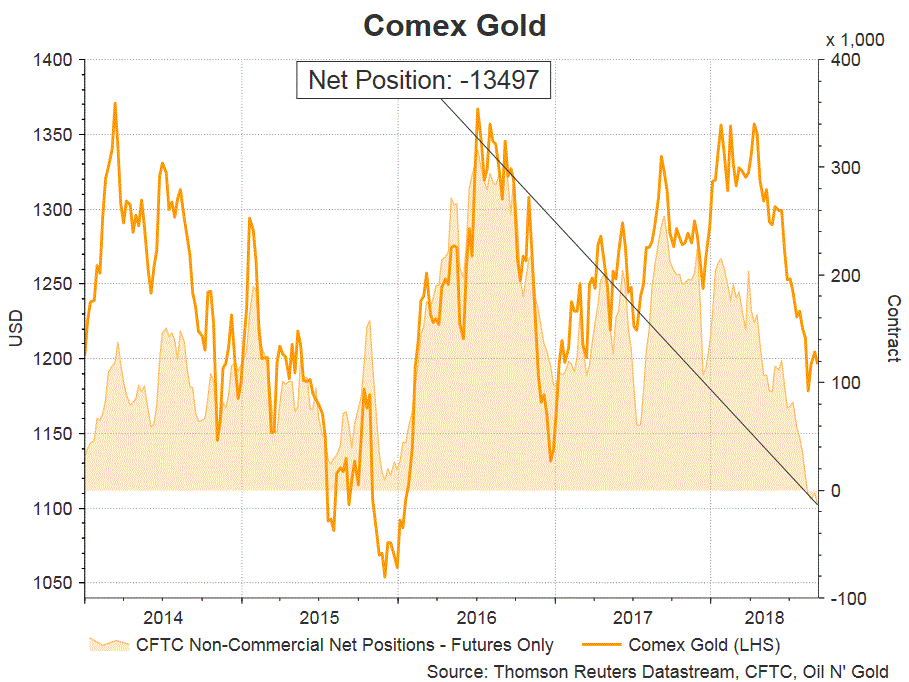
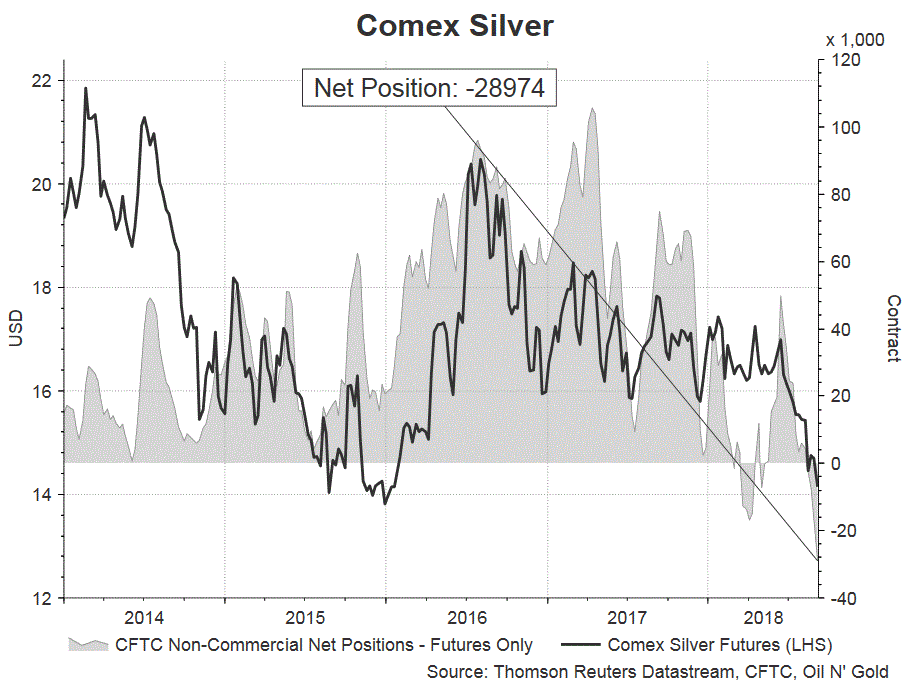
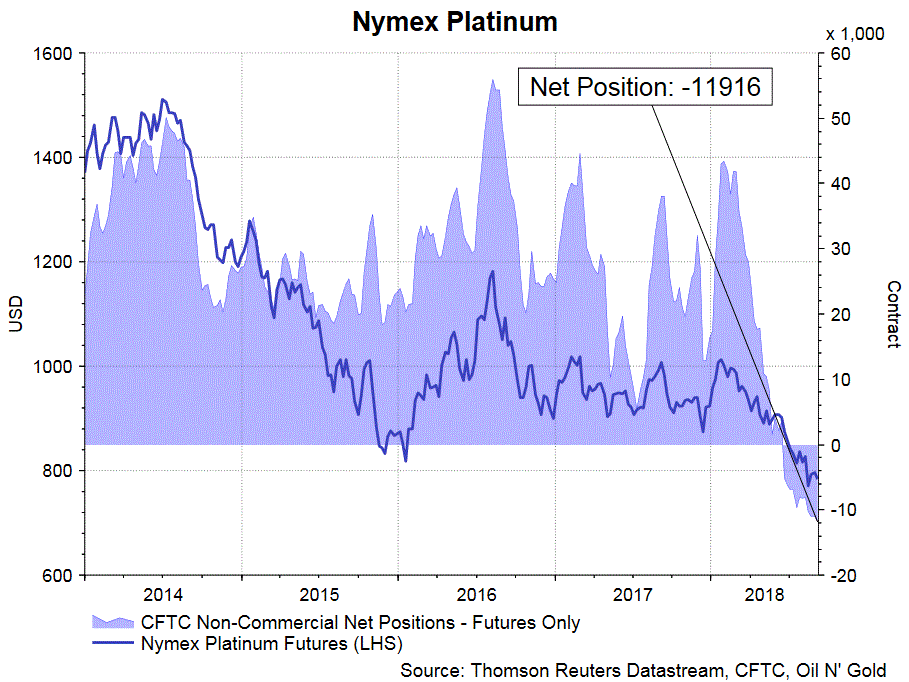
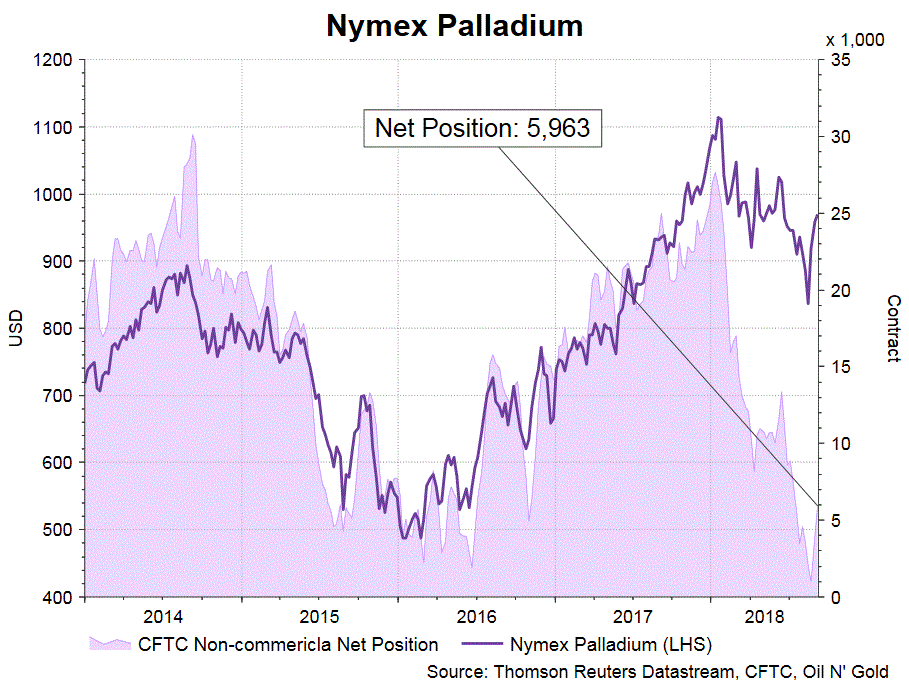
On the precious metal complex, gold and silver futures stayed in NET SHORTS for a fourth consecutive week. Speculative long positions for the former contracted -7 608, while shorts rose +2 826, resulting in a surge in NET SHORT to 13 497 contracts. For the latter, speculative long positions were trimmed by -3 479 while shorts rose 8 897, resulting in a jump in NET SHORT, by +12 376 contracts, to 28 974 contracts. For PGMs, NET SHORT of platinum added +940 contracts to 11 916 while NET LENGTH for palladium soared +2 079 contracts to 5 963.