

Sample Category Title
A Complex Matrix Of Confusion
A complex matrix of confusion.
Establishing views on cross assets classes on Monday morning is becoming increasingly difficult.
The tricky environment I am looking at today
Emerging market issues are still lingering and incredibly shaky outlook, the S&P remains robust stable and seriously sturdy, US yields continue to march higher, and US economy continues to outpace its peers. But so far, its a quiet start to the week with G-10 broadly unchanged from NY close with very moderate trading volumes across a plethora of generally active asset classes. The low participation from investors to start the week is likely due to the intense focus on trade war
The NFP effect
However, the US economy will be the driver early in the week given the NFP data was of knock it out of the park stuff. “Friday’s NFP was at 201k – the first time in 20 years that an initial August print was above 200k. The average hourly earnings were +0.4% making year on year 2.9% for the first time in 9 years having held 2.8% four times since the Fed started tightening.” This was massive !!! no wonder the US yields marched considerably higher as there fewer and fewer reasons for the Feds to remain accommodative
The US economy vis a vis the latest NFP print is driving the Bus and has thrown ice water on any hopes for a pause from the Fed who will likely keep their hawkish narrative intact.
China Syndrome
However, China’s economy, in juxtaposition, despite front-loading effect in the recent trade data, going forward Chinese exports are likely to factor negatively in any calculus due to the US tariffs. Chinas outlook appears increasingly dour after the President all but doubled down on his latest tariff tantrum. While the market’s pricing in 267 billion at 10 % according to the most recent Presidential bluster suggest the hawkish elements within the administration are prepared to tax all Chinas imports which would tally over 505 billion based 2017 data provided on the USTR website. But adding in the recent wave of tepid economic data, there should be more downside for China equity markets and a higher USDCNH
Oil Markets
The strong dollar and sagging equity market seldom augur well for oil prices but last week price action lower was likely driven by too much froth in the market as bullish bets increased around two critical possible supply disruptors, specifically Tropical Storm Gordon and protest in Iran, neither of which proved to be significant at all.
In addition, there were EM concerns that triggered a broader wave of commodity carnage and despite Oil well holding up relatively well during the tumult as Iran sanction continued to resonate supportively bullish for oil prices, there were just too many negative ducks lining up and base support levels gave way as bullish funds moved support bid lower.
Money managers continue buying into the market viewing the Iran sanction as the most significant near-term drivers dwarfing risk from emerging markets which are basing given the depth of concerted central bank intervention and the US -Sino trade escalations, which remain a complex metric of confusion on how that will affect oil prices near term.
But indeed, the Iran sanctions do look like the next big money trade and this likely bullish sentiment as we near should remain the dominant theme.
According to Baker Hughes, Oil rigs fell again last week adding more industry woes to American drillers, but like the Cushing, inventory builds its more function of pipeline bottlenecks as opposed to waning demand.
Asusual, there will be an intensive focus on trade war this week; Inventory reports will be a massive sentiment driver after last weeks substantial gasoline builds and even more so after testing the downside of the oil futures market resolve and WTI produced a bearish outside week.
Gold Markets
The markets continue to look for that golden lining. But the primary issue is haven demand remains fleeting in the presence of the stronger dollar narrative. As such, Fund managers continue to add to bearish bets driving makets deeper into oversold territory. While the crowded trade mentality has the Gold bulls dipping their toes into the uncertain water on a pullback to the low 1190, the fact remains, the general malaise on commodities coupled with the stronger dollar suggest seller emerge on rallies. But unless something gives on the USD or interest rate front would be confined to the near term well-worn paths between the $1190-1210 goalposts.
Currency Markets
The surging NFP should support the USD ahead of Thursday’s core CPI, factoring in lower gas prices but adding seasonality factors back into the equation has trader leading bullish and similarly for PPI.
Australian Dollar
The ongoing weakness in commodity markets, strong US dollar and the plethora of domestic issues should see the Aussie trade off its back foot and will continue to be faded on upticks. The saving grace for the Aussie ultimately comes down to resolving the US-China trade spat which as this juncture could be a bridge too far.
The Japanese Yen
Even though the US yield appeal suggests USDJPY higher with Japan getting added to the trade war saga, the Nikkei could remain extraordinarily fragile, and cap topside moves on USDJPY early in the week. Besides with the markets bracing for some tariff impact, we could expect knee-jerk reaction into have trades.
Malaysian Ringgit
The stronger USD as supported by stellar NFP data and jittery local market that remains focused on the destabilising economic effect of from US-China trade escalation suggest participation will stay low as regional speculators and trade war hedgers are moving back into long USDCNH which produced a bullish close on Friday.
Eco Data 9/10/18
[php_everywhere instance="1"]
Forex Forecast and Cryptocurrencies Forecast
First, a review of last week’s events:
EUR/USD. As for the trends and their changes, the forecast given last week turned out to be absolutely accurate: starting from Tuesday, September 6, we saw the weakening of the dollar and the pair's growth, and the strengthening of the dollar and the fall of the pair at the end of the week, thanks to the positive data on the labor market in the US. As for the volatility, even despite the end of the summer, it was significantly lower than expected: the maximum range of fluctuations was only 130 points. The market reacted sluggishly even to the growth of NFP (Non-farm Payrolls) by 36.7% (from 147K to 201K), and as a result, the pair completed the five-day period at 1.1552, improving the dollar position by only 50 points;
GBP/USD. Unlike the euro, the volatility of the pound, due to new statements by European officials on Brexit, is only growing, and amounted to over 240 points last week. The last jump of the pound was caused by the EU negotiator Michel Barnier's statements regarding the situation with the border between Great Britain and Ireland. As a result, as most analysts (60%) had assumed, the pair went north, reaching the level of 1.3025 by mid-Friday.
However, later, driven by the news on the US labor market, the dollar played back 110 points, as a result of which the pair, similar to EUR/USD, returned to the values of the start of the week, having stopped at the level of 1.2915;
USD/JPY. The forecast, which had been supported by more than 55% of experts, oscillators and graphical analysis on D1, suggested the movement of the pair in the side channel with a rather narrow range of 110.00-111.45. This scenario turned out to be quite accurate, with a certain tolerance: the pair stayed within 110.37-111.75, returning to the central zone of the corridor at the end of the week and finishing at 111.00;
Cryptocurrencies. The forecast for BTC/USD had assumed first the growth of the pair to $7,760 (in reality, the pair rose to $7,400), and then a correction and a decline, but not below the level of mining profitability in the zone $6,000-6,230. In reality, the price of bitcoin fell to the support of 6.300, having lost about 15% in 16 hours. The situation with Ethereum is even sadder for the bulls: the pair ETH/USD has lost almost 30%, having fallen from the mark of 302.1 to 211.6. The price of Litecoin (LTH) has fallen by 22%, that of the Ripple (XRP) - by 20%.
There are two possible reasons for this: 1) the decision of ShapeShift crypto platform to enter the users' registration and to start collecting their personal data, and 2) the news (which later turned out to be a fake) that Goldman Sachs will not create a special unit for trading cryptocurrencies.
In fact, neither of these two pieces of news had any meaningful significance for the crypto market, these are just private solutions of private companies. But, as it has been said many times before, suffice the big players to wish to collapse the market, and they will always find an excuse for this.
As for the forecast for the coming week, summarizing the opinions of a number of analysts, as well as forecasts made on the basis of a variety of methods of technical and graphical analysis, we can say the following:
EUR/USD. From the point of view of fundamental analysis, the most important events await us on Thursday, September 13. The ECB's interest rate decision and the ECB's press conference are expected on that date. As for the interest rate, there are no surprises expected here. But as for the press conference, some information on the timing of the tightening of monetary policy in the Eurozone may sound, although this is unlikely to happen in the nearest future. This though cannot be said about the decisions of the US Federal Reserve.
On the same Thursday, the data on the US inflation will be published, the high rates of which have become a serious signal for raising the interest rate by the Fed. The market is almost 100% confident that this will happen in September. Traders and experts are waiting for an answer to the question whether there will be another increase in December.
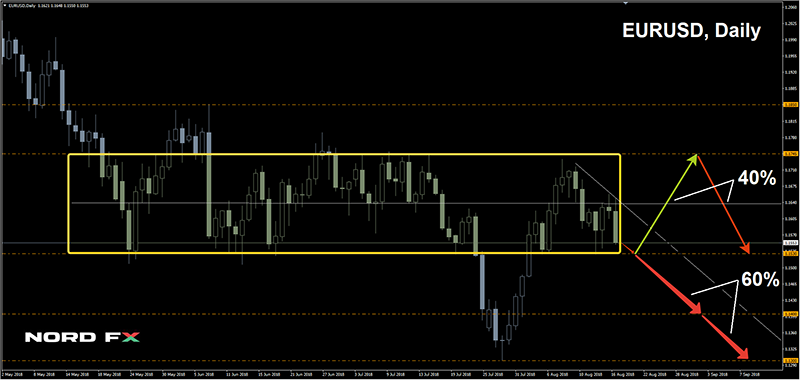
Basing on these expectations, most analysts (60%) vote for the growth of the dollar and a fall of the pair. Graphical analysis on D1 and about 85% of oscillators and trend indicators agree with them. The nearest support is 1.1530 and 1.1400, the targets for the end of September - the beginning of October are 1.1300 and 1.1125.
The remaining 40% of experts believe that the correction of the pair is not over yet, and therefore it can move in the side channel 1.1530-1.1745 for a while. Graphical analysis on H4 and 15% of oscillators that signal the pair is oversold, agree with this;
GBP/USD. Macroeconomic data from the UK will be released on Monday (GDP), and on Tuesday (pay), and again on Thursday, when the Bank of England will announce its decision on the interest rate. The rate is most likely to remain at the level of 0.75%, so it is not the rate itself that is of interest, but the number of votes given for its rise. And, traditionally, the market will closely follow the news about Britain's "divorce" from the European Union. In this situation, the readings of trend indicators, as well as the opinions of experts, are divided in two equal parts. Oscillators do not give clear signals either: about 50% of them are painted in a neutral color, 25% are green, 25% are red.
As for the graphical analysis, it shows the further growth of the dollar and the decline of the pair first into the zone 1.2785-1.2800, and then even lower, to the level of 1.2660, on D1. As for H4, graphical analysis does not exclude that, before going south, the pair will move along Pivot Point 1.2935 in the horizontal channel 1.3035-1.3040 for several days;
USD/JPY. The financial community paid attention to the article of James Freeman in the Wall Street Journal, which said, if briefly, that Japan will soon become a new target in the trade wars of Donald Trump. At such, Freeman refers to a personal telephone conversation with the US President.
So, Japan is on the brink of war, which it tried to avoid. If you add to this the increase in sales tax planned for the next year and dependence on the Iranian oil, the preponderance of forces is on the side of the Americans. The growth of wages and expenditures of households, leading inflation to the coveted bar in 2%, side with the Japanese.
So far, the experts' votes have been divided as follows: 55% are for the fall of the pair, 45% are for its growth. The indicators do not give any clear picture, and the graphical analysis on H4 draws the pair's oscillations within 110.30-111.80. When switching to the time frame D1, the oscillation range expands to 109.80-112.15;
Cryptocurrencies. Most likely, bears will not stop there, and the pair BTC/USD will still try to break through the level of $6,000 and get close to this year's low in the $5.760 zone. Although it is possible that it will take a breather for some time, moving to the east in the corridor of $6,230-6,640. The next resistance is in the zone $6,895-6,985.
Dollar Soared as Data Support Fed Hikes, Trade War to Intensify
Economic data, Fed expectations, trade war, Brexit were among the biggest themes last week. Emerging market risks seemed to have abated. Meanwhile, Italy was less of a threat to Eurozone after the government pledged not to blow up the account. Yen and Swiss Franc ended the week as the first and third strongest ones as ex-US markets were troubled by risk aversion. Dollar strengthened as usual on Trump's escalating trade threats to other countries and ended as the second strongest. New Zealand, Australian and Canadian Dollar were the weakest ones naturally, on risk aversion. Sterling ended mixed after suffering much volatility on flip-flopping Brexit headlines.
Markets firming up Fed interest rate pricing after strong week of data
Economic data released from the US were very strong. ISM manufacturing jumped to 61.3 in August, highest since May 2004. ISM non-manufacturing also rebounded to 58.5. Initial jobless claims dropped to 203k, lowest since 1969. Non-farm payroll showed respectable 201k. More importantly, average hourly earnings rose strongly by 0.4% mom.
Comments from Fed officials last week continued to be mixed. But that didn't change the overall picture in the board. That is, the consensus should be continuing rate hikes to neutral first. What's beyond that will depend on incoming data and other factors like yield curve.
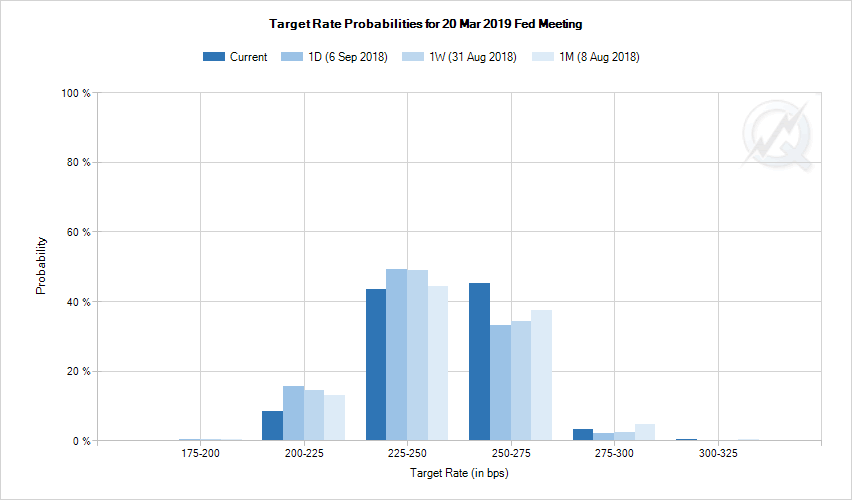
After the strong set of data, markets have firmed up their pricing on Fed's rate path. By March 2019 FOMC meeting, fed fund futures are now pricing in more than 48% chance of three more 25bps hikes to 2.50-2.75%. While it's still kept below 50% level, it's notably higher than 35.2% on Thursday, and 36.6% a week ago.
10 year yield finally broke 55 day EMA firmly
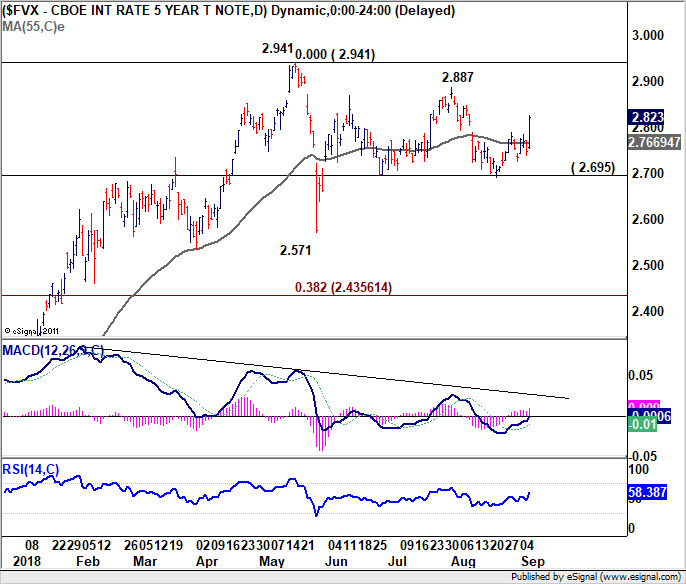
Strong NFP also lifted treasury yields clearly, reflecting the expectation on Fed hikes. 10 year yield jumped 0.063 to 2.942 on Friday. More importantly, TNX finally made up its mind to take the flat 55 day EMA decisively. The threat of another immediate fall in TNX diminished largely. And more upside would be seen back towards 2.887/941 resistance zone. The development will limit any downside attempt in USD/JPY and could eventually give it a lift.
Trade tensions to worse, at least till mid-term elections
Trade war remained a dominant theme in the global markets, as stocks were sold off deeply. But it should be noted again that US equities stayed firm all the way despite some brief and shallow setbacks. The threads of trade tensions have now become so tangled that it's hard to pick a point to start the analysis.
But anyway, let's start with Canada. Whether it's still NAFTA or not, the trade negotiation between the US and Canada ended another week without any tangible progress. Dairy, media ownership and Chapter 19 dispute resolution mechanism remained the deadlocks. Trump brought out auto tariffs on Canada again on Friday and warned that "in Canada, the tax on cars would be the ruination of the country." So, tariffs on Canadian cars are still very much a possibility given Canadian Prime Minister Justin Trudeau's firm stance on the issues.
Then, if Canada gets auto tariffs, the chance would be increased for EU too, if the latter doesn't concede further. Just a week ago, Trump rejected EU's offer to lower auto tariffs to zero, ignoring the "ceasefire agreement". Additionally, Trump leaked his plan to a WSJ journalist that Japan is the next trade target. The US-Japan negotiation have started, and Trump could fire a shot at Japan after concluding or abandoning talks with Canada.
Then there is China, the public hearing on 25% tariffs on USD 200B in Chinese products ended last week. Trump is ready to start imposing them any time and China is prepared for retaliation. On Friday, Trump bluffed again and said there's another USD 267B in products ready to be tariffed on short notice and he warned "that totally changes the equation". That's the piece of news that triggered the strong rally in Dollar and selloff in commodity currencies on Friday.
However, it should be noted that from China's August trade data, Trump's ransom way of negotiation and trade policy failed again. China increased imports from other regions in August like EU (10.6% yoy) and AU (34.0% yoy). Import from US slowed drastically to 2.7% yoy. On the other hand, exports to the US still grew steadily at 13.2% yoy comparing to EU (8.3% yoy) and AU (23.3% yoy). In the end, trade surplus with the US grew 18.4% yoy. And, trade surplus with EU just rose 4.0% yoy. Trade deficit with AU has indeed jumped 45.7% yoy. More details found in this quick note.
Anyway, there are, almost certainly, more developments and escalations ahead of mid-term election in November. The question is, whether Canada, EU, Japan and China will wait out Trump. Or like Mexico, some would concede.
US stock markets shrug unaffected by trade war, but global stocks tumbled
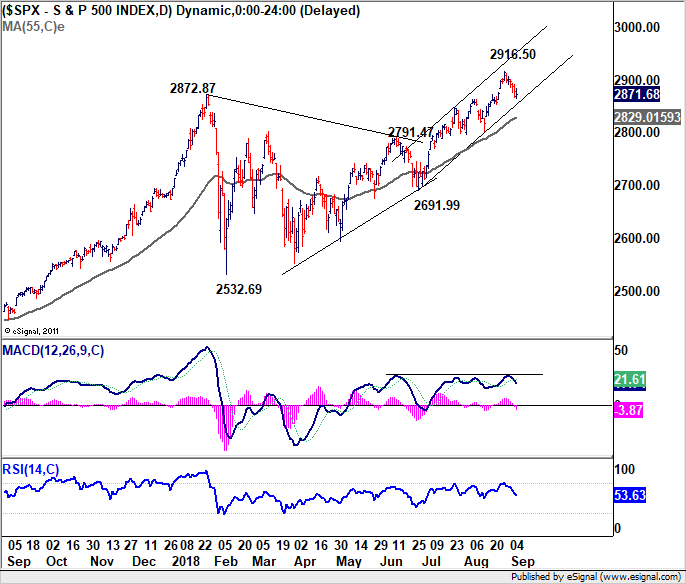
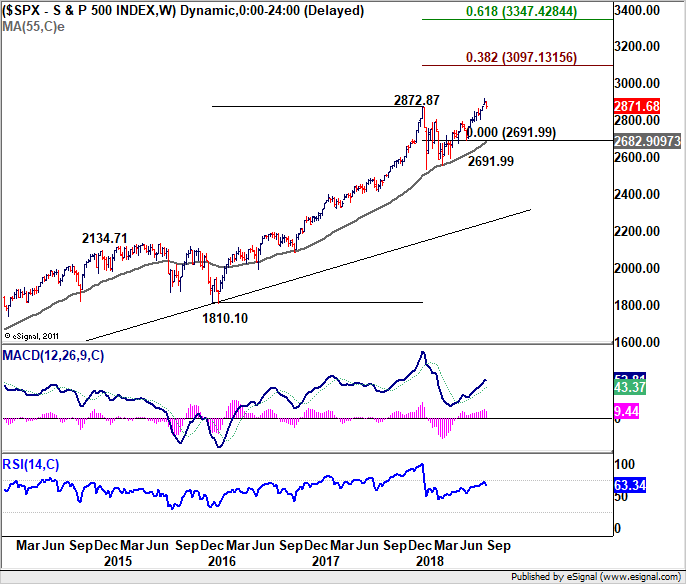
We'd like to emphasize again that when we talk about risk aversion, we're clearly it refers to ex-US global markets. S&P 500 retreated after hitting 2916.50 record high. But it's kept inside near term rising channel, well above rising 55 day EMA (now at 2829.01). The pull back also looks corrective so far. There is no indicate of trend reversal. SPX remains on track to extend the record run towards 3000 psychological level.
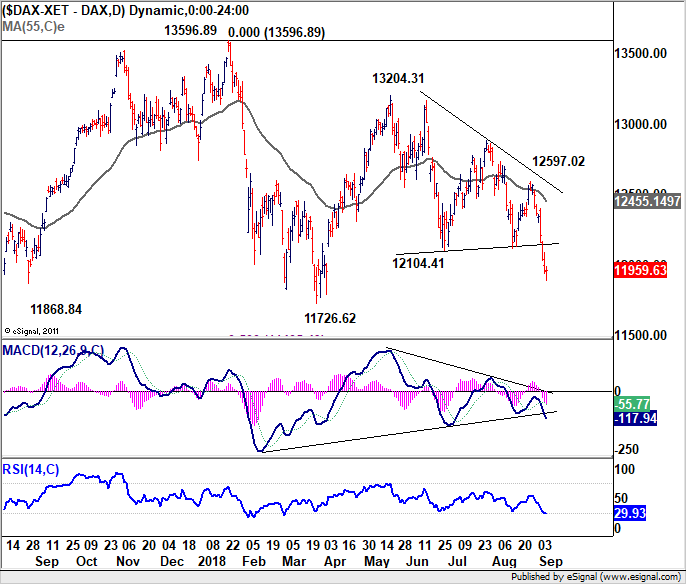
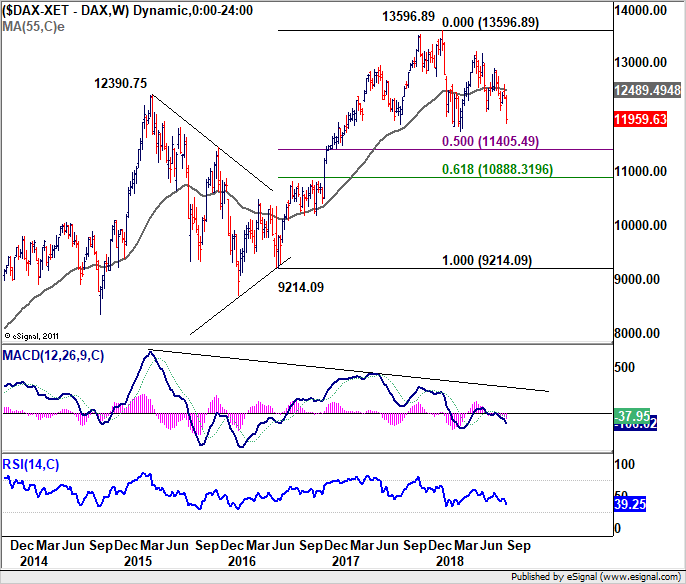
On the other hand, DAX suffered steep selloff and broke 12104.41 support last week to close at 11959.63. The rejections by 55 day and 55 week EMA were rather bearish. We're viewing price actions from 13596.89 as a corrective pattern. Deeper fall would now be seen to 11726.62. There is prospect breaking 50% retracement of 9214.09 to 13596.89 at 11405.49 before bottoming.
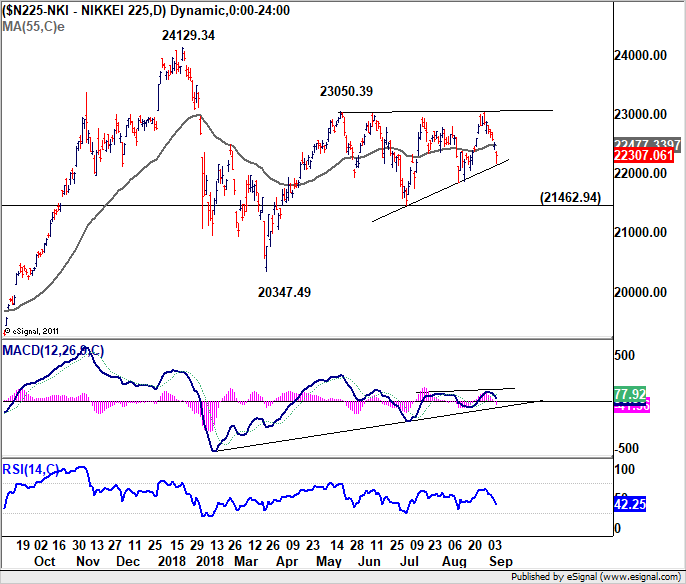
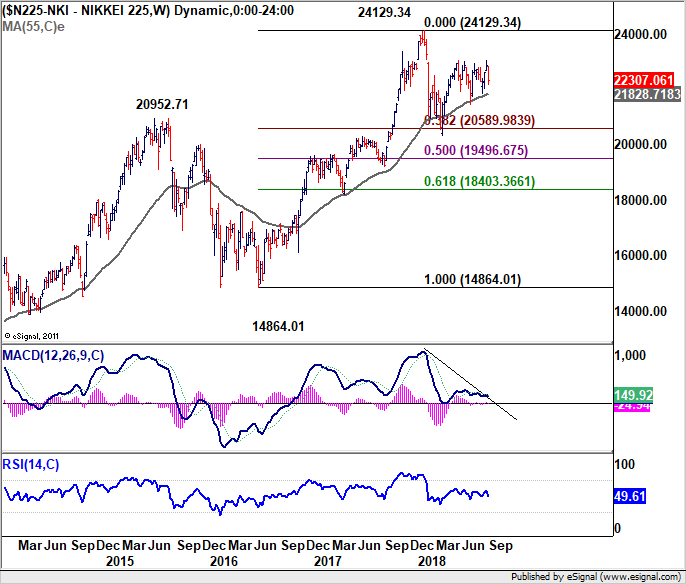
Nikkei was once again rejected by 23050.39 key near term resistance. The late selloff was triggered by news that Japan is Trump's next trade target. Immediate focus is on near term trend line (now at 22135). Break there will open up more downside to 21462.94 key support level. Break of this will confirm completion of the rebound from 20347.49. That is, the correction from 24129.34 is going to extend with another leg, possibly through 20000 handle to 50% retracement of 14864.01 to 24129.34 at 19496.67.
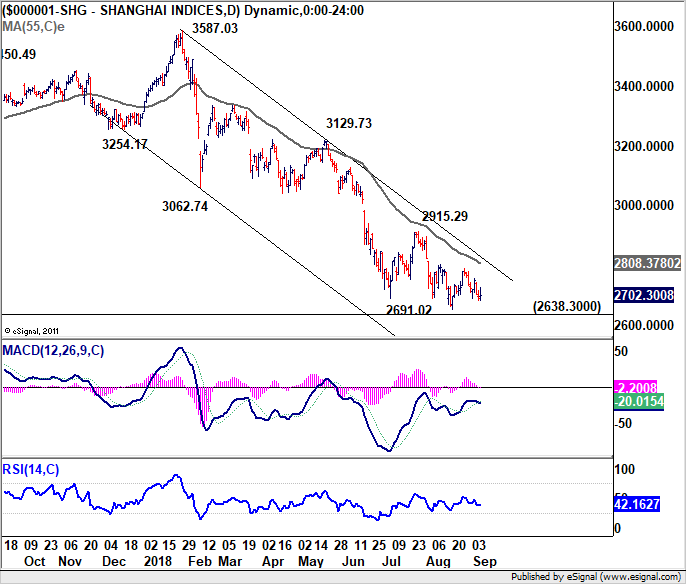
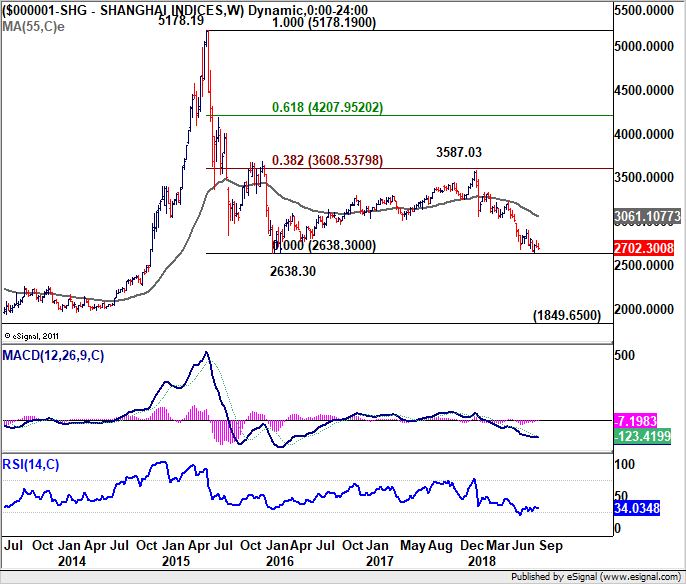
China Shanghai SEE continued to stay in range above 2638.30 key support (2016 low). But things are looking bad as the rebounds got weaker and weaker. It's just a matter of time when 2638.30 is taken out firmly. But it's hard to say where the index will fall too given China's history of intervention and market manipulation. The "national team" might finally comes in when SSE hits 2500 handle.
Considering the above analysis, there's a high chance that Yen, Swiss Franc and Dollar will firm up against others ahead. And commodity currencies, as well as Euro will continue to suffer.
Position trading strategies
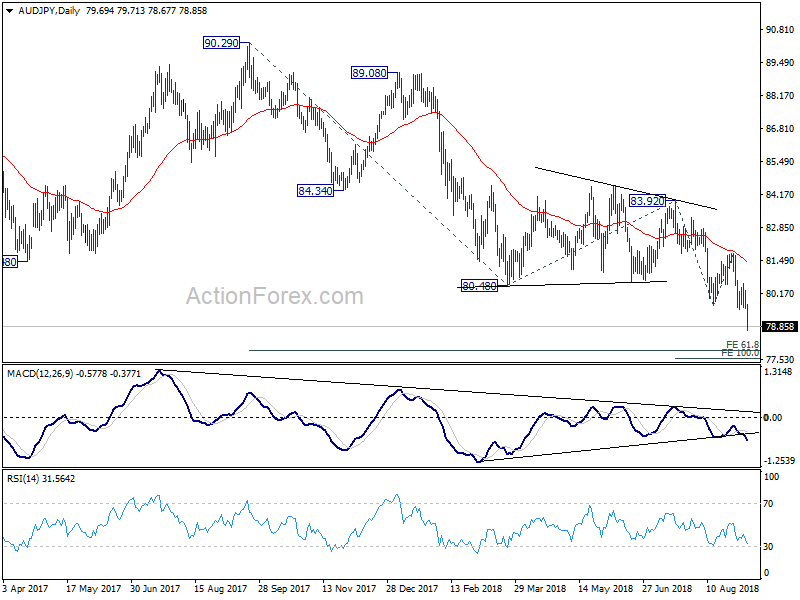
On position trading strategies, we've entered short in AUD/JPY last week at 80.25 as noted planned in the week report. As AUD/JPY declined, we lowered the stop to breakeven at 80.25 here. Now, the development was as we expected. 61.8% retracement of 72.39 to 90.29 at 79.22 was taken out quite decisively. Yet, it's not deep even enough to warrant lowering of stop yet. So we'll keep the stop at 80.25.
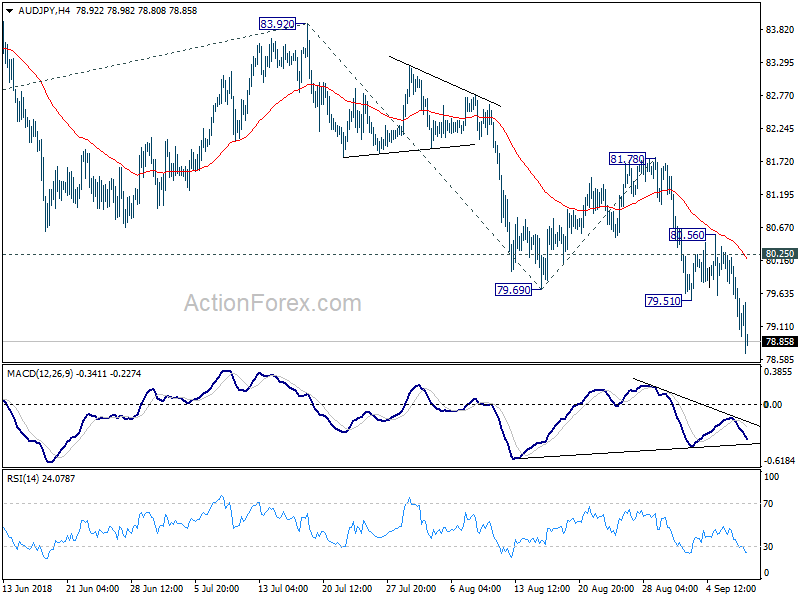
AUD/JPY should now head to 77.55/85 (61.8% projection of 90.29 to 80.48 from 83.92 at 77.85, 100% projection of 83.92 to 79.69 from 81.78 at 77.55). We do not plan to exit there yet, as we would like to monitor and assess the downside momentum first.
As noted before, the rejection from falling 55 week EMA was rather bearish in medium term. The whole up trend from 72.39 (2016 low) should have completed at 90.29 (2017 high). We're now looking at the prospect of deeper fall to 100% projection of 90.29 to 80.48 from 83.92 at 74.11, or further to 72.39 low. We'll make a call on where to exit later.
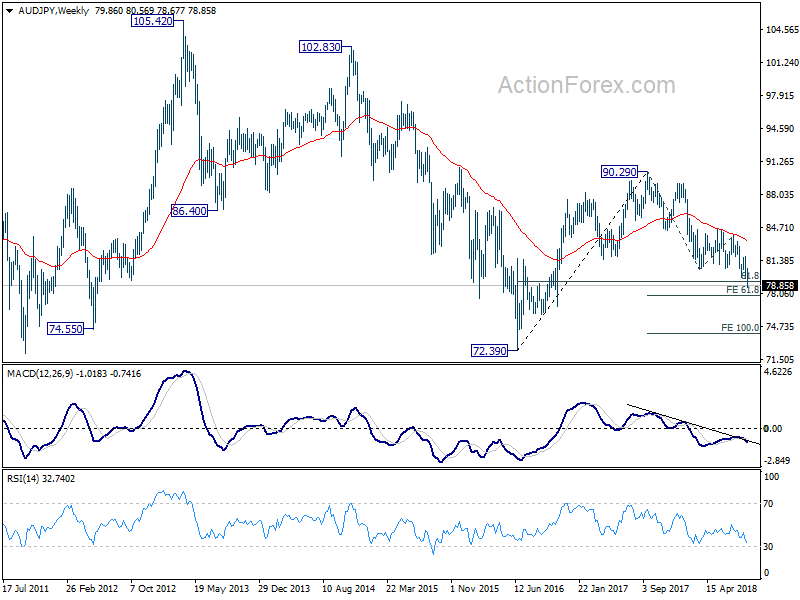
So to summarize, we'll hold AUD/JPY short, with stop at 80.25. No target yet, potentially between 74.11 and 72.39.
As for new strategy, Dollar, Yen and Swiss Franc are the three to consider buying. We have AUD/JPY already, therefore, we'd avoid both Aussie and Yen. Swiss franc has indeed led the way higher long ago so we'd prefer not to jump in again now. That left Dollar for our consideration. Euro, Sterling and Canadian Dollar are the candidates.
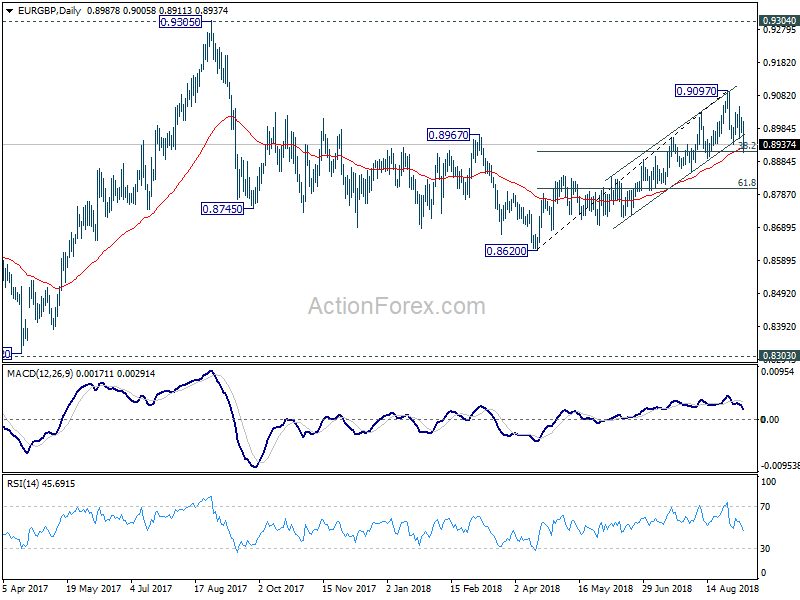
As mentioned in our technical report, EUR/GBP's sharp fall last week took out near term channel support and 0.8937 support. The development indicates that a short term top was formed at 0.9097. And, more importantly, the choppy structure from 0.8620 to 0.9097 argues that it's a corrective move that might be completed. Break of 38.2% retracement of 0.8620 to 0.9097 at 0.8915 will affirm our bearish view and target 61.8% retracement at 0.8802 and below. Hence, Euro is a better one to sell than Sterling.
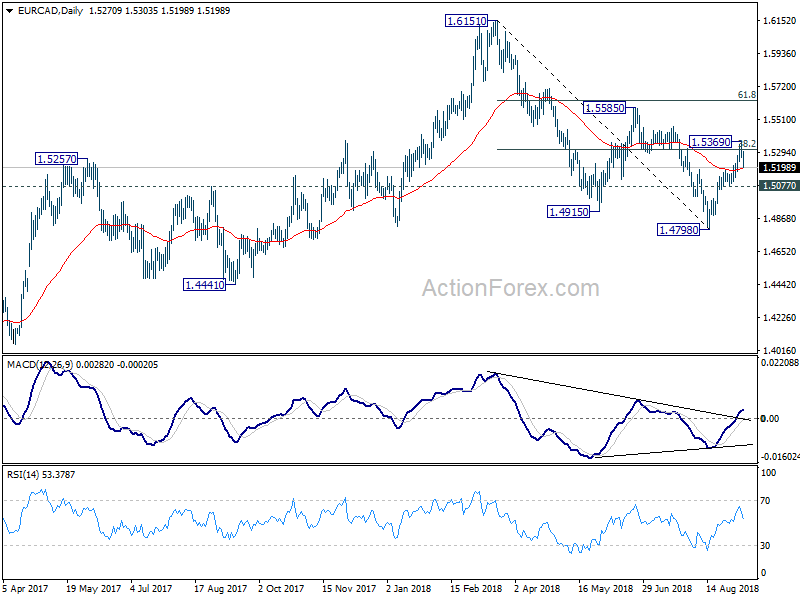
Looking at EUR/CAD, the cross should have bottomed in medium term at 1.4798 on bullish convergence condition in daily MACD. But strong resistance was seen from 38.2% retracement of 1.6151 to 1.4798 at 1.5315. EUR/CAD retreated sharply after hitting 1.5369. The development should now set the range for near term consolidation between 1.5077 support and 1.5369. Further rise in in favor in the cross, but that will come after the consolidation completes. That is, for the near term, it may not make much difference selling Euro or Canadian. However, as BoC is on course for more rate hike, and there could suddenly be a breakthrough in NAFTA talks. So, in that sense, Euro is preferred.
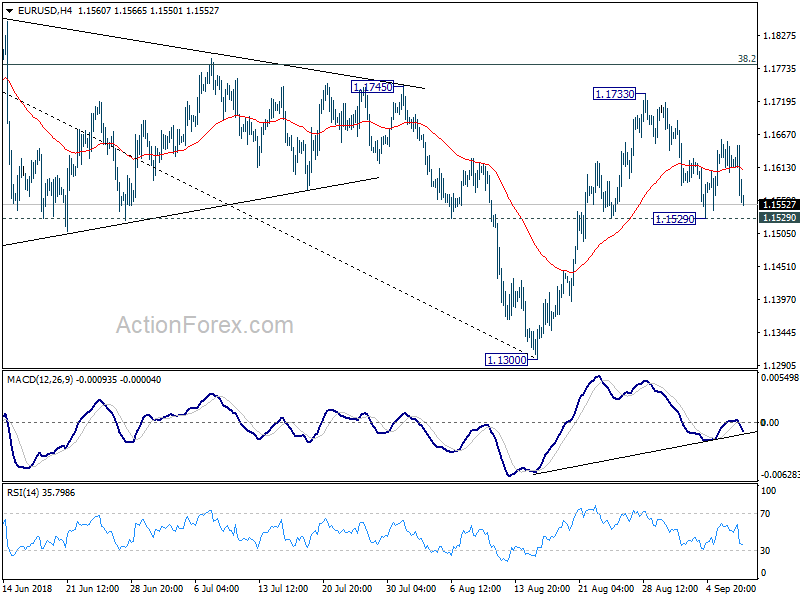
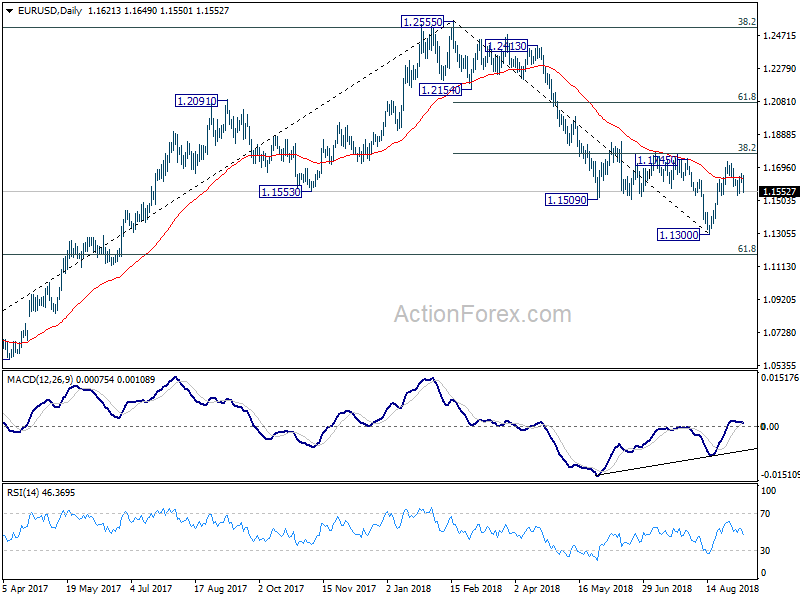
Now, EUR/USD. Our view is unchanged that price actions from 1.1300 are merely a corrective pattern. And in case of another rise, upside should be limited by 38.2% retracement of 1.2555 to 1.1300 at 1.1779 to bring near term reversal. However, it should be noted that 1.1300 is seen as a medium term bottom. Therefore, we don't expect a break of 1.1300 on the next fall. Instead, there could be one more rebound to make it a medium term three wave consolidation pattern. Hence, if we sell on break of 1.1529, and put at stop at 1.1660, even if EUR/USD can hit 1.1300, risk/reward is lower than 1:2. Not justified. So, we'll give it a pass first but keep monitoring. There's a chance of selling EUR/USD if it recovers towards 1.1733 with weak momentum. Then, we can enter at a better price. Let's see.
AUD/USD Weekly Outlook
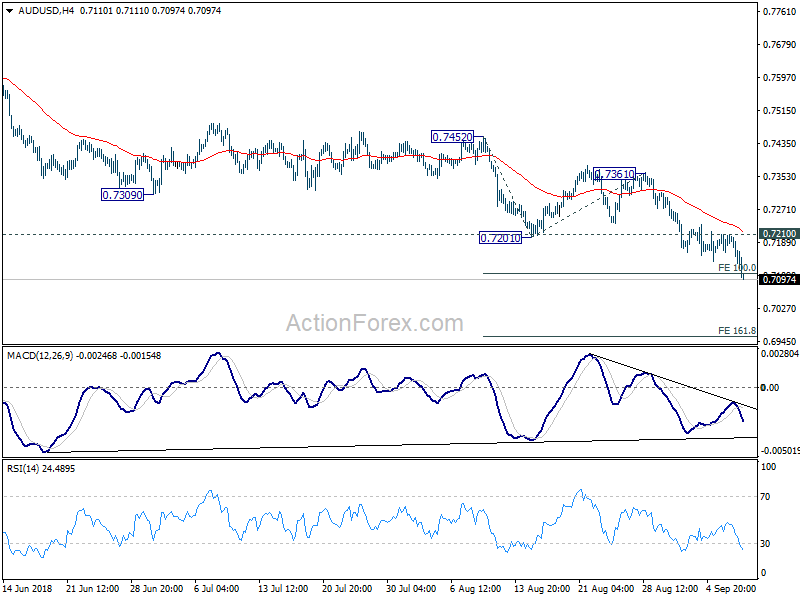
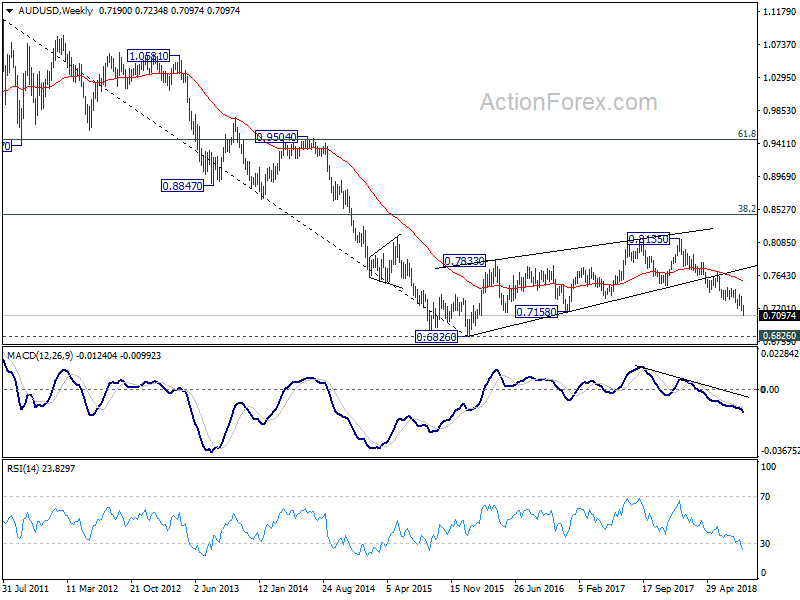
AUD/USD's down trend extended last week to as low as 0.7097. 100% projection of 0.7452 to 0.7201 from 0.7361 at 0.7110 was already met and there is no sign of bottoming. Initial bias remains on the downside this week for 161.8% projection at 0.6955. Break will target key support level at 0.6826. On the upside, break of 0.7210 resistance is needed to indicate short term bottoming. Otherwise, outlook will stay bearish in case of recovery.
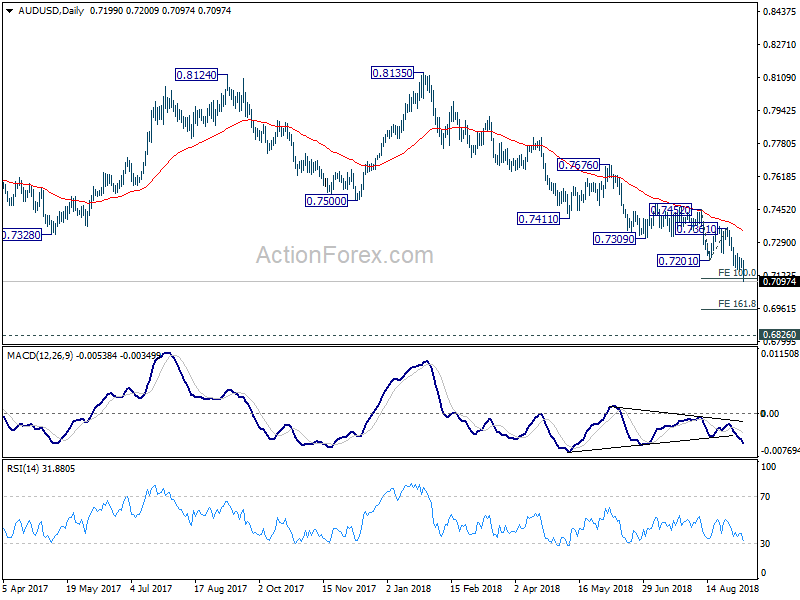
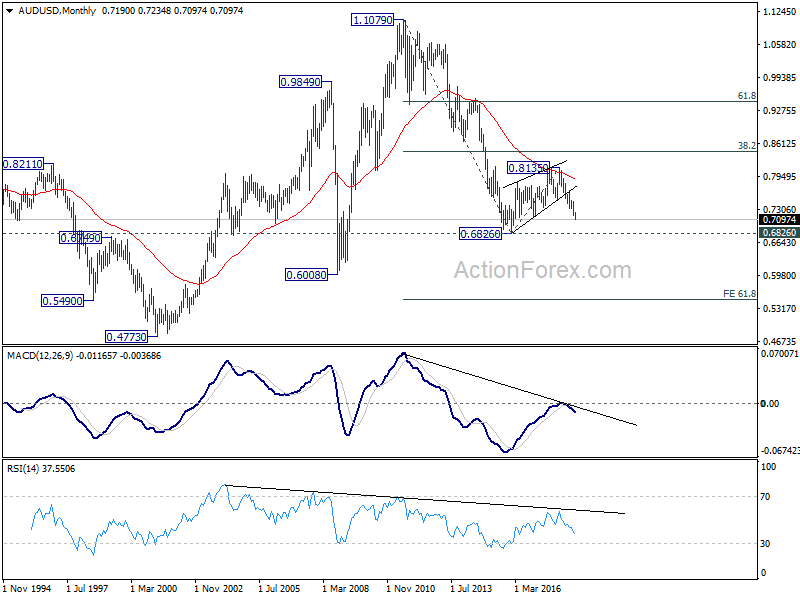
In the bigger picture, rebound from 0.6826 (2016 low) is seen as a corrective move that should be completed at 0.8135. Fall from there would extend to have a test on 0.6826. There is prospect of resuming long term down trend from 1.1079 (2011 high). Current downside momentum as seen in daily and weekly MACD support this bearish case. Firm break of 0.6826 will target 0.6008 key support next (2008 low). On the upside, break of 0.7361 resistance is needed to be the first sign of medium term bottoming. Otherwise, outlook will remain bearish even in case of strong rebound.
In the longer term picture, the corrective structure of rebound from 0.6826 (2016 low) to 0.8135, and the failure to break 38.2% retracement of 1.1079 (2011 high) to 0.6826 at 0.8451, carry bearish implications. AUD/USD was also rejected by 55 month EMA. Now, the down trend from 1.1079 is in favor to extend. On break of 0.6826, next target will be 61.8% projection of 1.1079 to 0.6826 from 0.8135 at 0.5507.
CFTC Commitments of Traders – Greenback Rose Across the Board
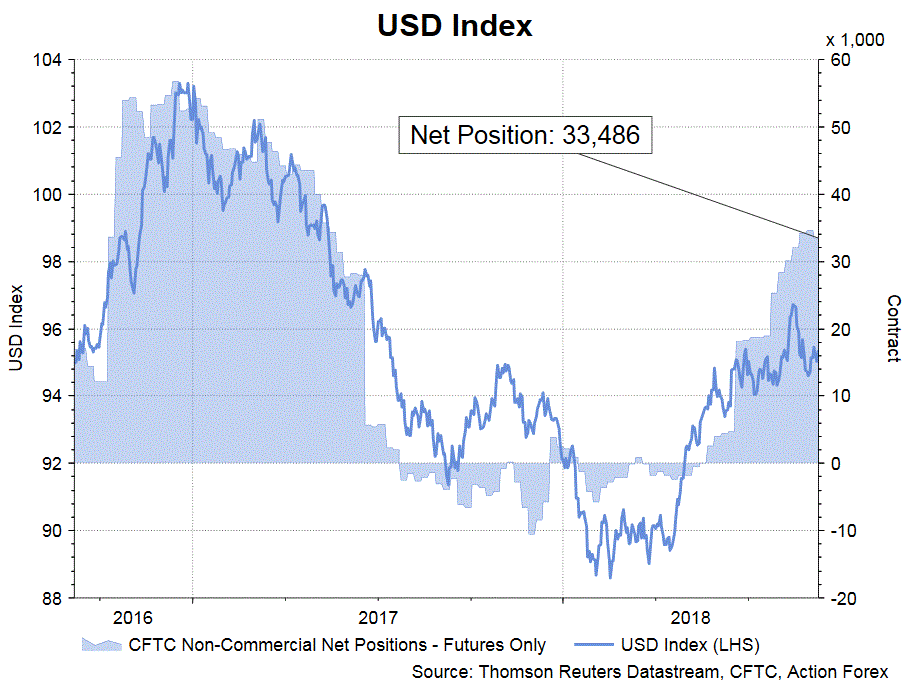
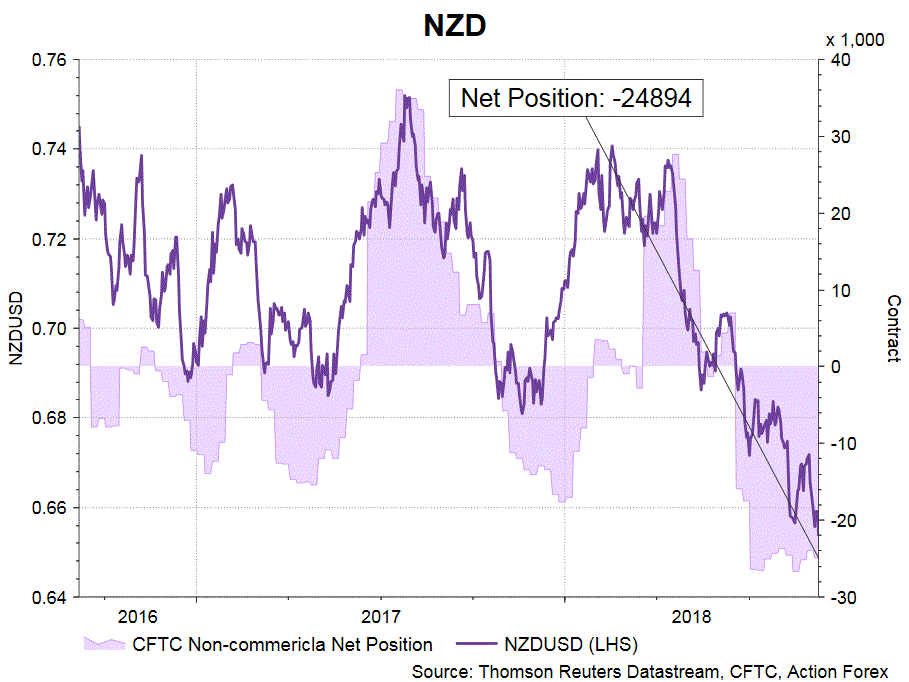
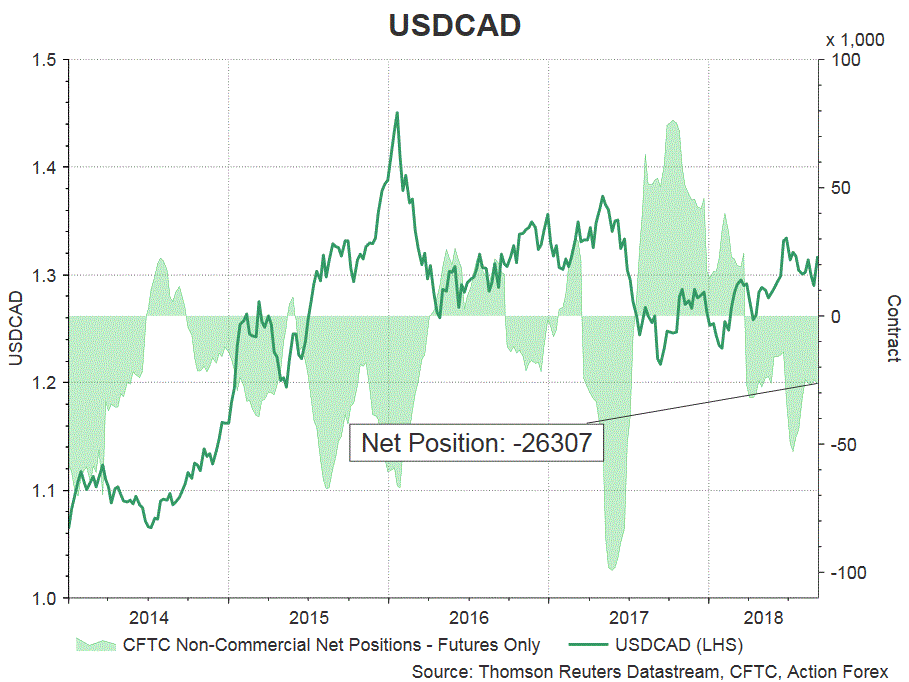
As suggested in the CFTC Commitments of Traders report in the week ended September 4, NET LENGTH of USD index dropped -1 085 contracts to 33 486 contracts for the week. Both speculative long and short positions increased. During the week, the DXY index gained +0.76%. The greenback rose against all major currencies with the exception of Swiss franc (CHF).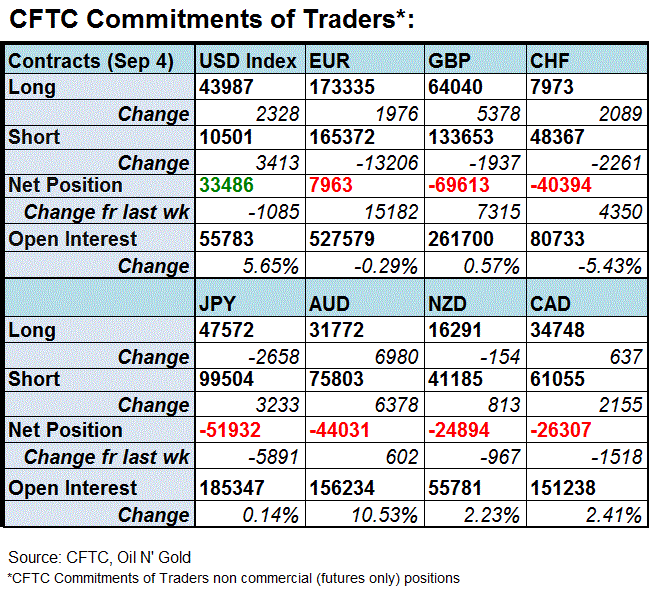
EUR futures reverted to NET LENGTH of 7 963 contracts. While speculative long positions added +1 976 contracts, shorts slumped -13 206 contracts. EURUSD slipped -1.35% during the week. The focus of the coming week would be on the ECB meeting. NET SHORT for GBP futures dropped -7 315 contracts to 69 613. 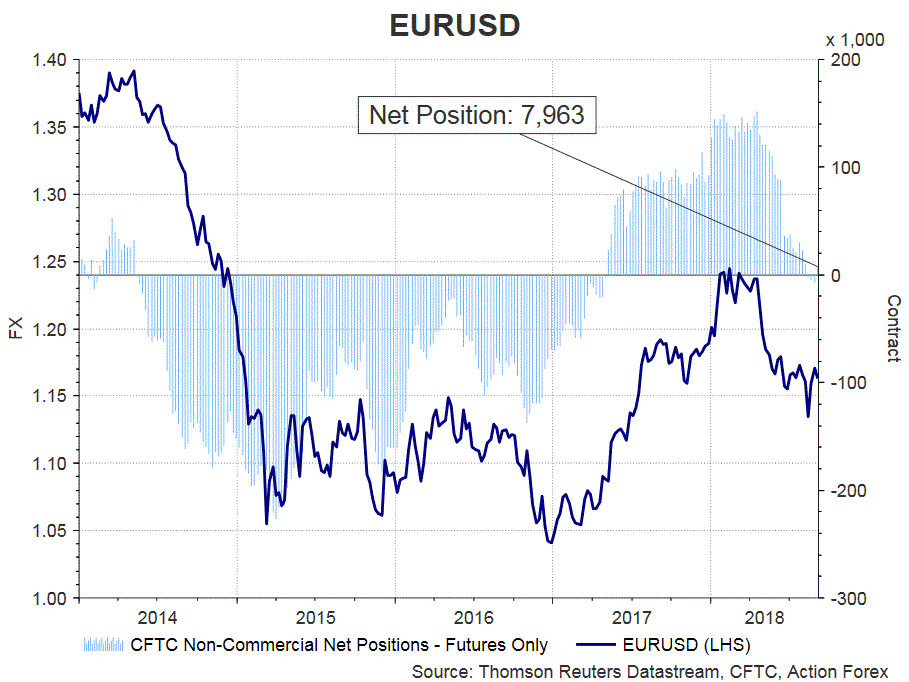
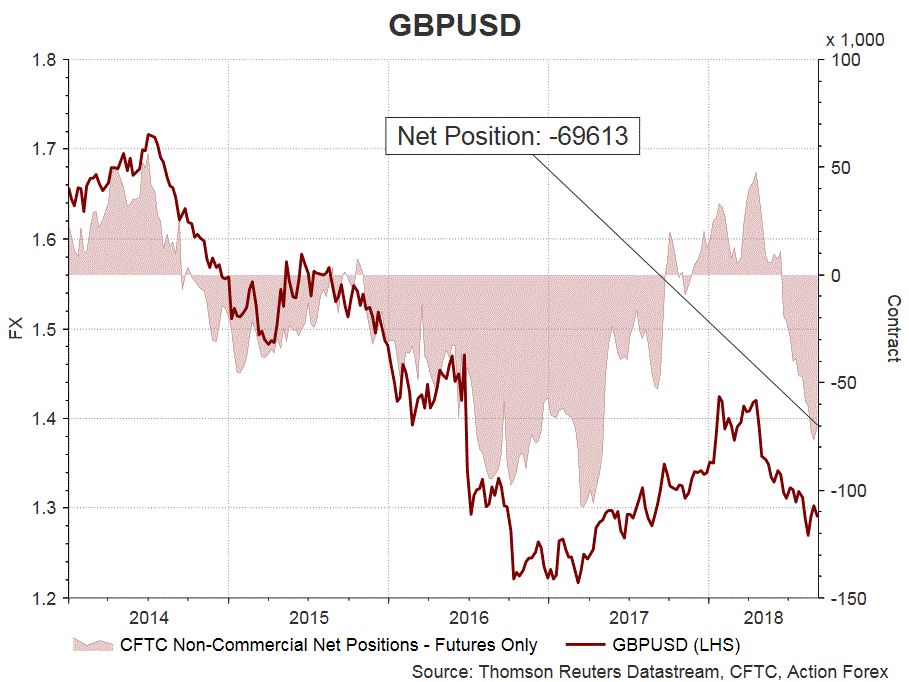
On safe-haven currencies, Net SHORT for CHF futures dropped -4 350 contracts to 40 394 while that for JPY futures rose 5 891 contracts to 51 932 during the week. This was driven by the decline in speculative long positions (-2 658 contracts) and a rise in shorts (+3 233 contracts). 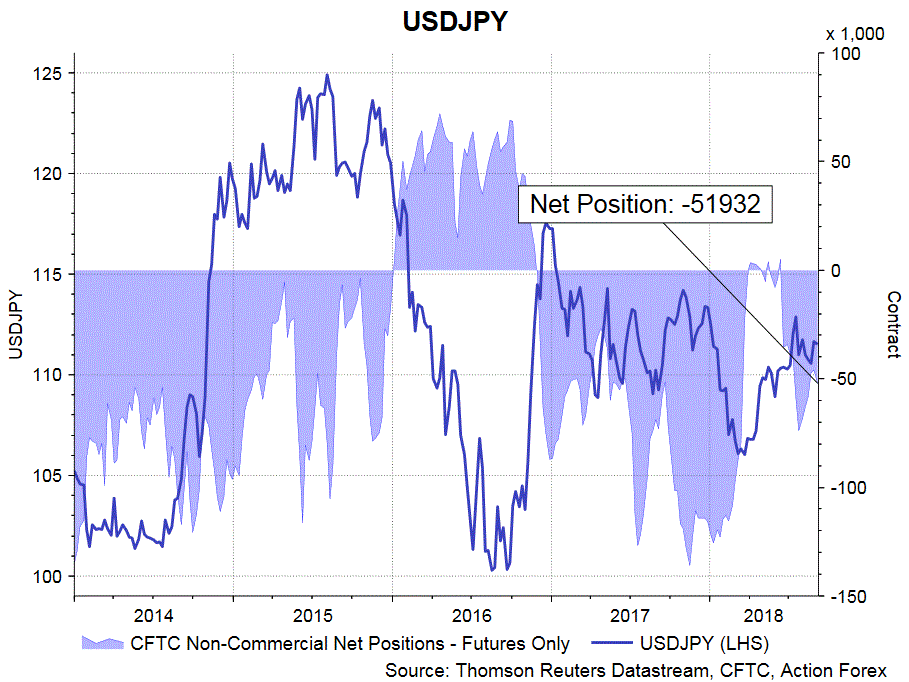
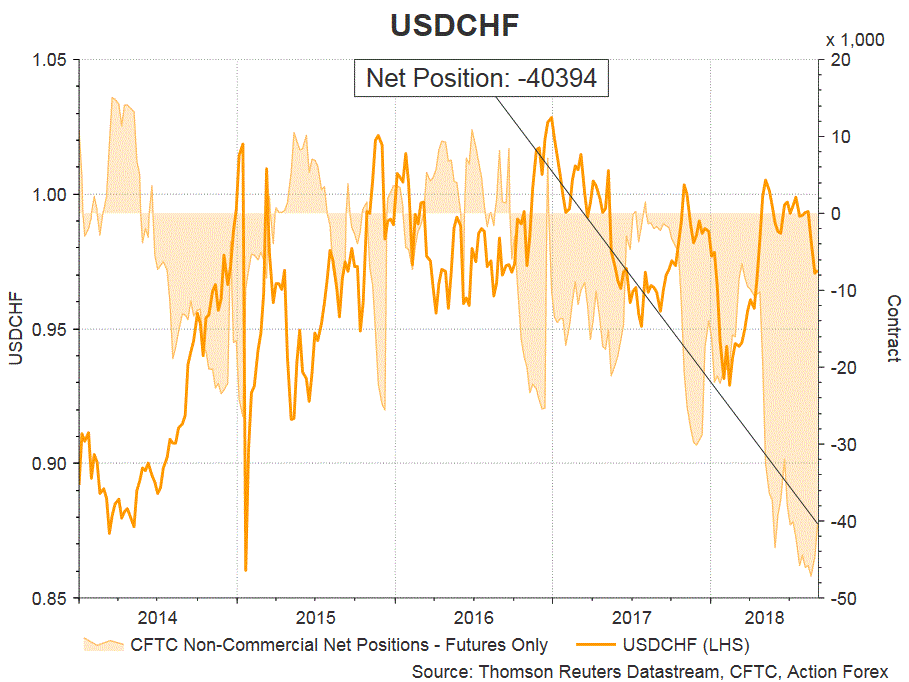
All commodity currencies stayed in NET SHORT positions. NET SHORT for AUD futures dropped -602 contracts to 44 031, while that for NZD futures added +967 contracts to 24 894. NET SHORT for CAD futures soared +1 518 contracts to 26 307. 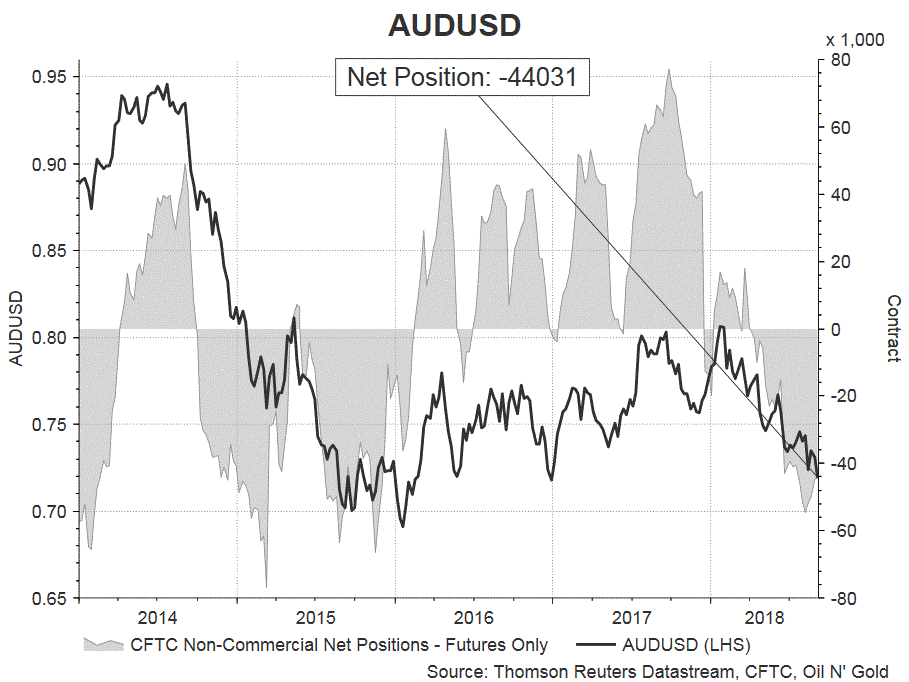
EUR/USD Weekly Outlook
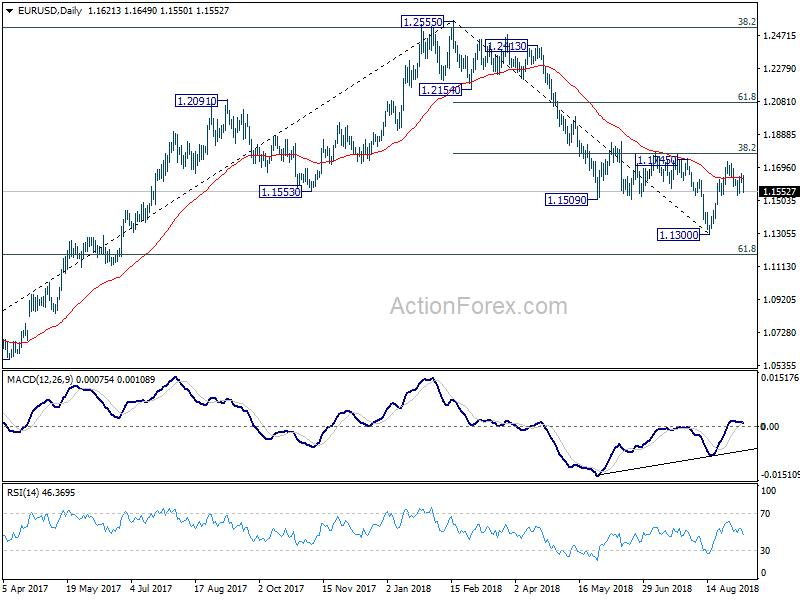
EUR/USD dipped lower last week but downside was contained by 1.1529 support. Initial bias remains neutral this week first. Outlook is unchanged that price actions from 1.1300 are forming a corrective pattern. IN case of another rise, strong resistance should be seen at 38.2% retracement of 1.2555 to 1.1300 at 1.1779 to limit upside, at least on first attempt. On the downside, break of 1.1529 minor will indicate completion of the rebound and turn bias to the downside for retesting 1.1300 low. After all, consolidation from 1.1300 will likely extend for a while before completion.
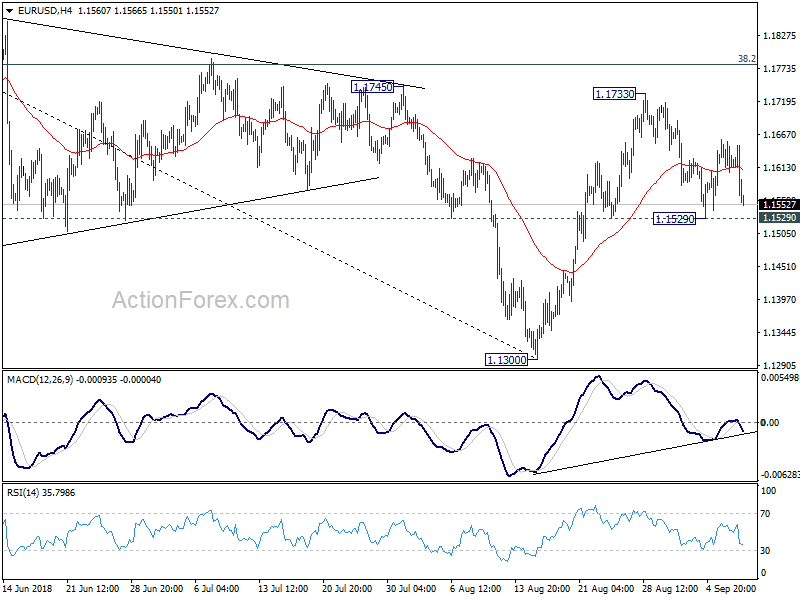
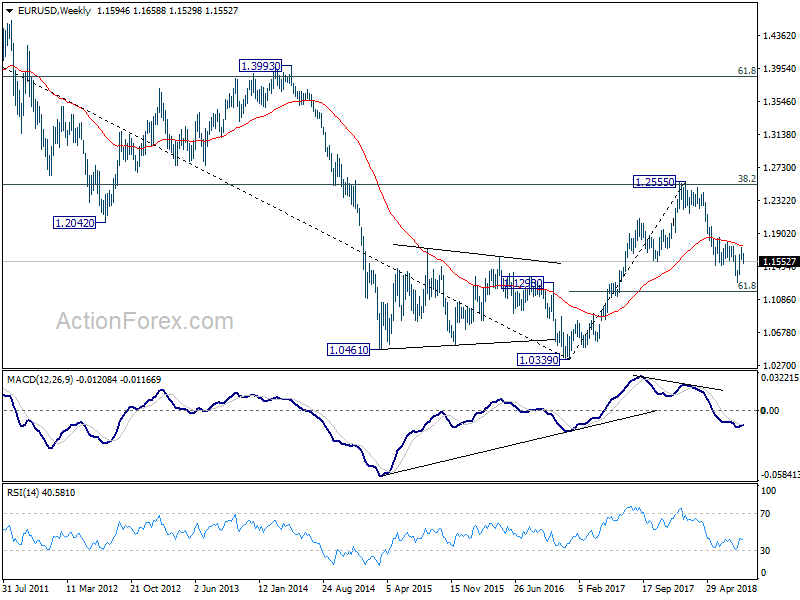
In the bigger picture, a medium term bottom should be in place at 1.1300, on bullish convergence condition in daily MACD and some consolidations would be seen. But still, note that EUR/USD was rejected by 38.2% retracement of 1.6039 (2008 high) to 1.0339 (2017 low) at 1.2516. That carries some long term bearish implications. Thus, we'd expect fall from 1.2555 high to resume after consolidation completes. Below 1.1300 should send EUR/USD through 61.8% retracement of 1.0339 to 1.2555 at 1.1186. And, in that case, EUR/USD would head to retest 1.0339 (2017 low).
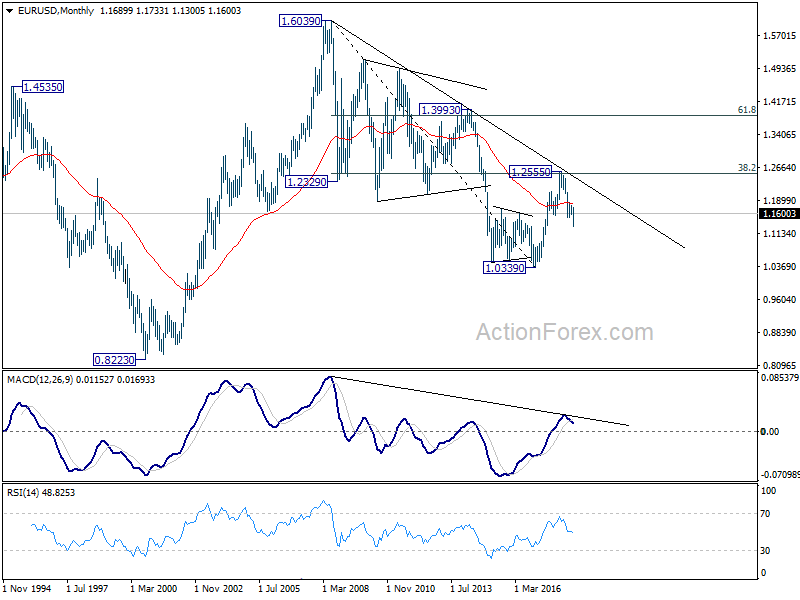
In the long term picture, the rejection from 38.2% retracement of 1.6039 to 1.0339 at 1.2516 argues that long term down trend from 1.6039 (2008 high) might not be over yet. EUR/USD is also held below decade long trend line resistance. Sustained trading below 55 week EMA adds bearishness to the case. Firm break of 61.8% retracement of 1.0339 to 1.2555 at 1.1186 should at least bring a retest on 1.0339 low.
USD/JPY Weekly Outlook
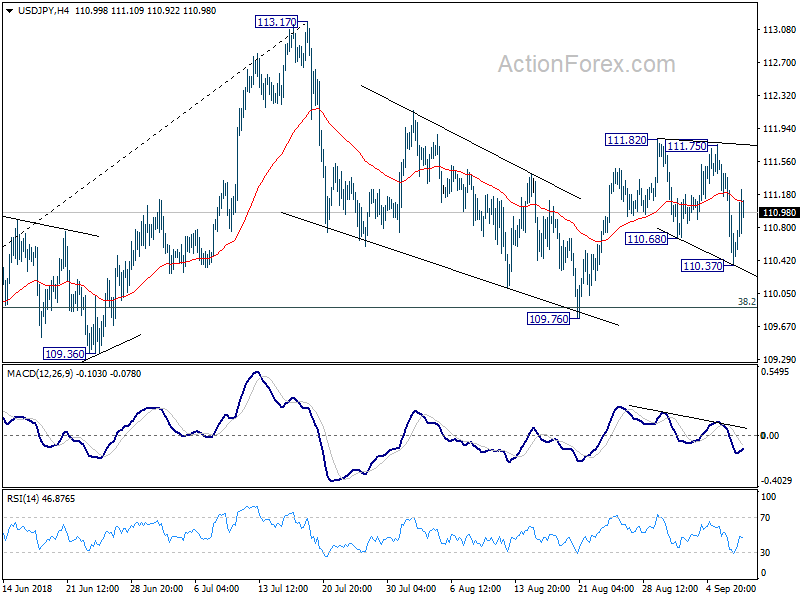
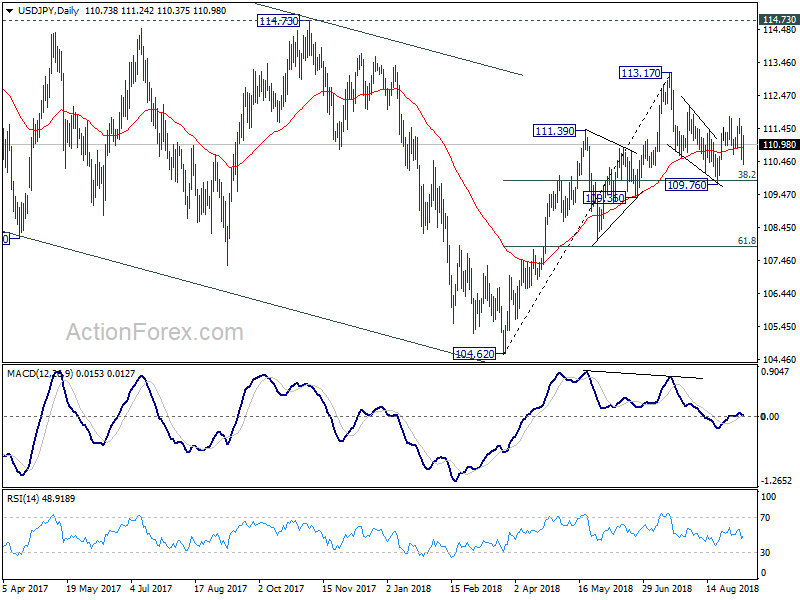
USD/JPY's consolidation from 111.82 extended last week with a dip to 110.37 then recovered. Initial bias is neutral this week first. On the upside, break of 111.75 will resume the rebound from 109.76 to retest 113.17 high. On the downside, below 110.37 will bring deeper fall. But still, we'd expect strong support from 38.2% retracement of 104.62 to 113.17 at 109.90 to contain downside and bring rebound.
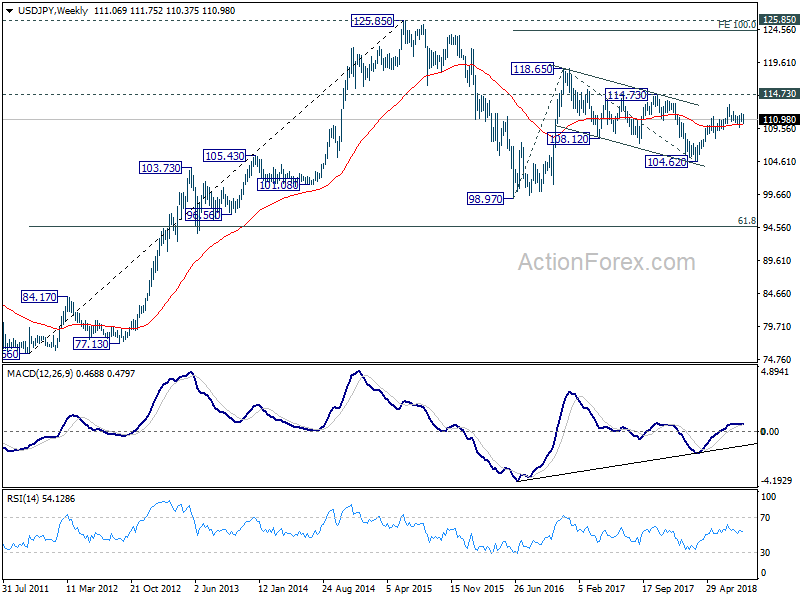
In the bigger picture, corrective fall from 118.65 (2016 high) should have completed with three waves down to 104.62. Decisive break of 114.73 resistance will likely resume whole rally from 98.97 (2016 low) to 100% projection of 98.97 to 118.65 from 104.62 at 124.30, which is reasonably close to 125.85 (2015 high). This will stay as the preferred case as long as 109.36 support holds. However, decisive break of 109.36 will mix up the outlook again. And deeper fall should be seen back to 61.8% retracement of 104.62 to 113.17 at 107.88 and below.
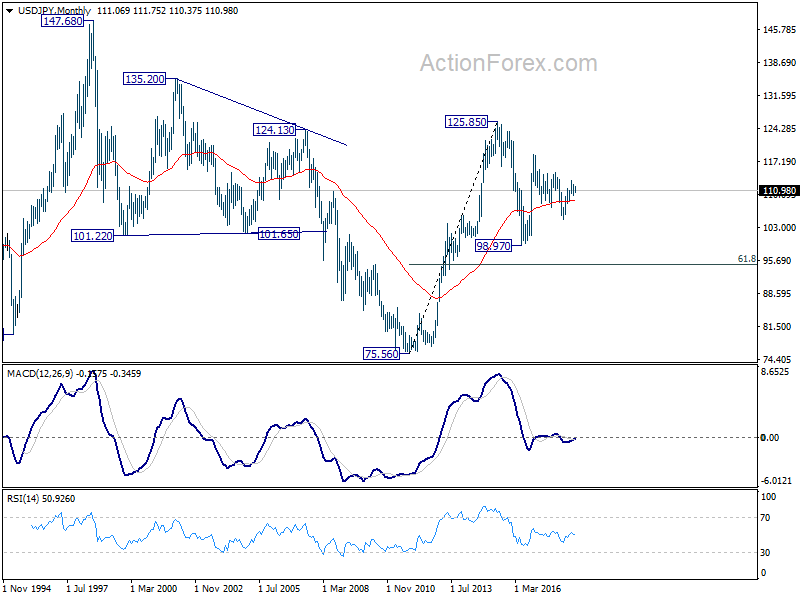
In the long term picture, the rise from 75.56 (2011 low) long term bottom to 125.85 top is viewed as an impulsive move, no change in this view. Price actions from 125.85 are seen as a corrective move which could still extend. In case of deeper fall, downside should be contained by 61.8% retracement of 75.56 to 125.85 at 94.77. Up trend from 75.56 is expected to resume at a later stage for above 135.20/147.68 resistance zone.
GBP/USD Weekly Outlook
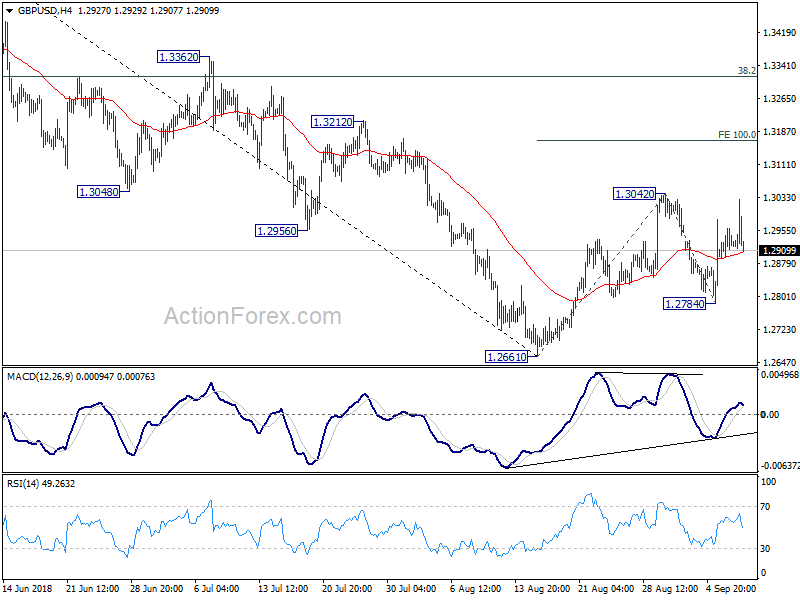
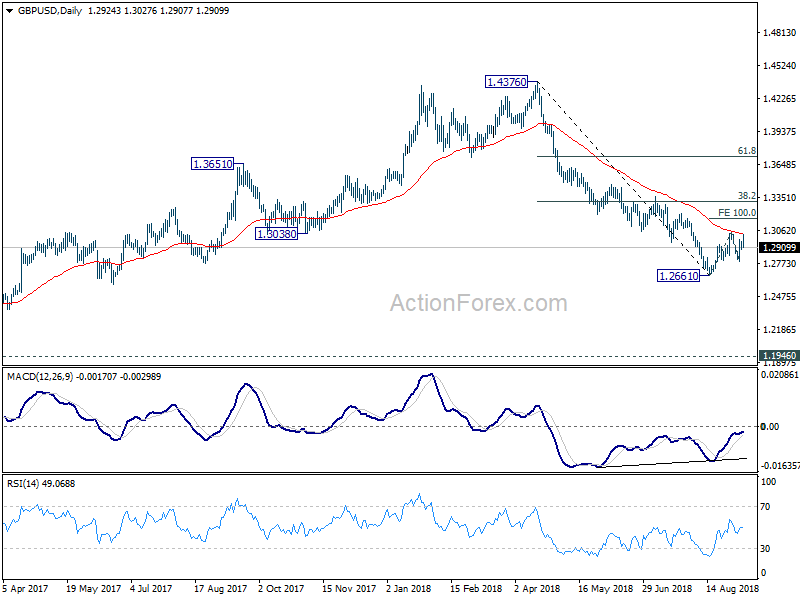
A lot of volatility was seen in GBP/USD last week but it's overall bounded in range of 1.2784/3042. Initial bias is neutral this week for some range trading first. On the the upside, break of 1.3042 will resume the rebound from 1.2661 and target 100% projection of 1.2661 to 1.3042 from 1.2784 at 1.3165. However, as such rebound is seen as a correction, upside should be limited by 1.3316 key fibonacci level to complete the corrective rise and bring near term reversal. On the downside, break of 1.2784 will bring retest of 1.2661 low.
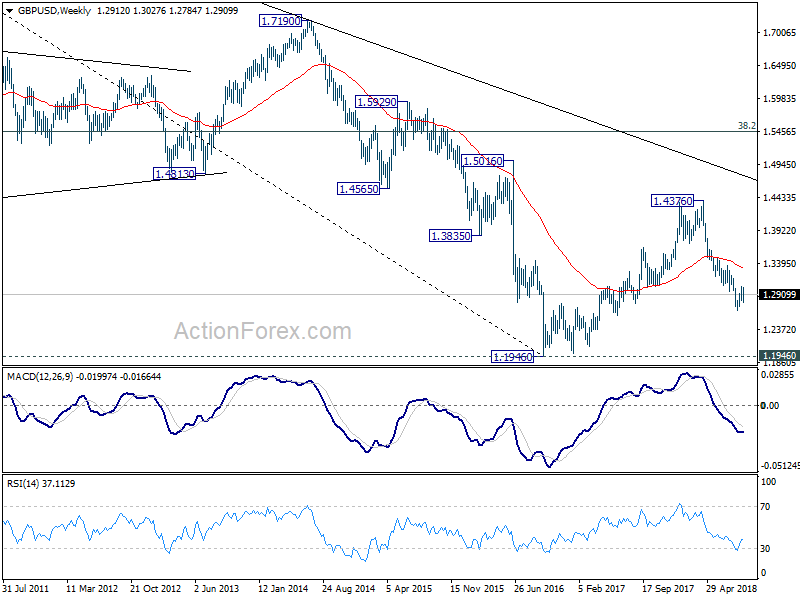
In the bigger picture, whole medium term rebound from 1.1946 (2016 low) should have completed at 1.4376 already, after rejection from 55 month EMA (now at 1.4099). The structure and momentum of the fall from 1.4376 argues that it's resuming long term down trend. And this will be the preferred case as long as 38.2% retracement of 1.4376 to 1.2661 at 1.3316 holds. However, firm break of 1.3316 would bring stronger rebound to 61.8% retracement at 1.3721. And, the eventual depth of the fall from 1.4376, and the chance of hitting 1.1946 low, will depend on the strength of the interim corrective rebound from 1.2661.
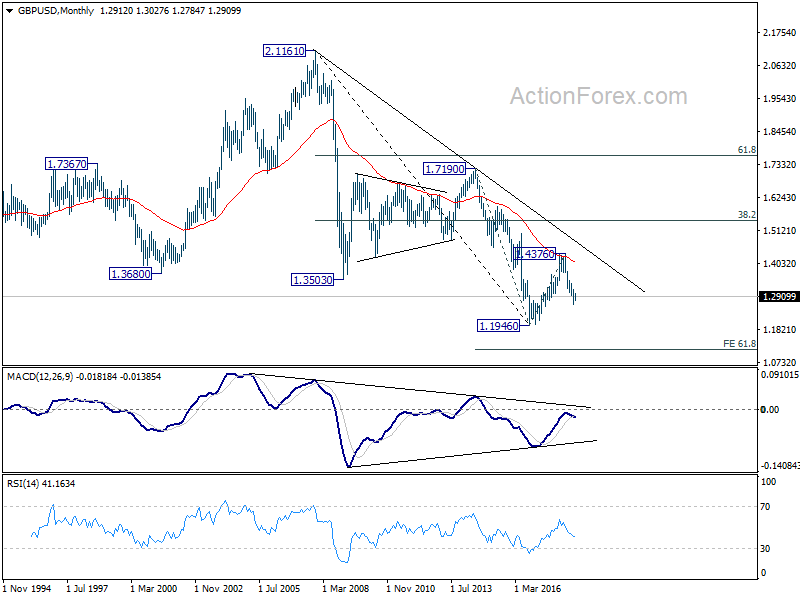
In the longer term picture, outlook in GBP/USD is held bearish. Rebound from 1.1946 was rejected solidly by falling 55 month EMA. The pair was limited well below 38.2% retracement of 2.1161 (2007 high) to 1.1946, as well as the decade long falling trend line. On break of 1.1946, next target will be 61.8% projection of 1.7190 to 1.1946 from 1.4376 at 1.1135.
USD/CHF Weekly Outlook
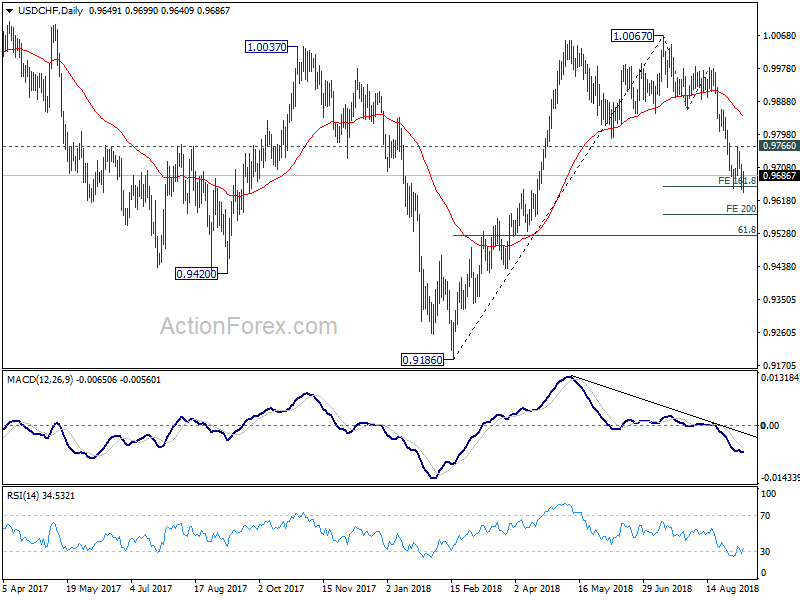
USD/CHF edged lower to 0.9640 last week but couldn't sustained below 161.8% projection of 1.0067 to 0.9866 from 0.9981 at 0.9656. Initial bias remains neutral this week first. As long as 0.9766 resistance holds, outlook remains bearish for deeper decline. Break of 0.9640 will target 200% projection at 0.8579 next. Though, break of 0.9766 will indicate near term reversal and target 0.9866 support turned resistance.
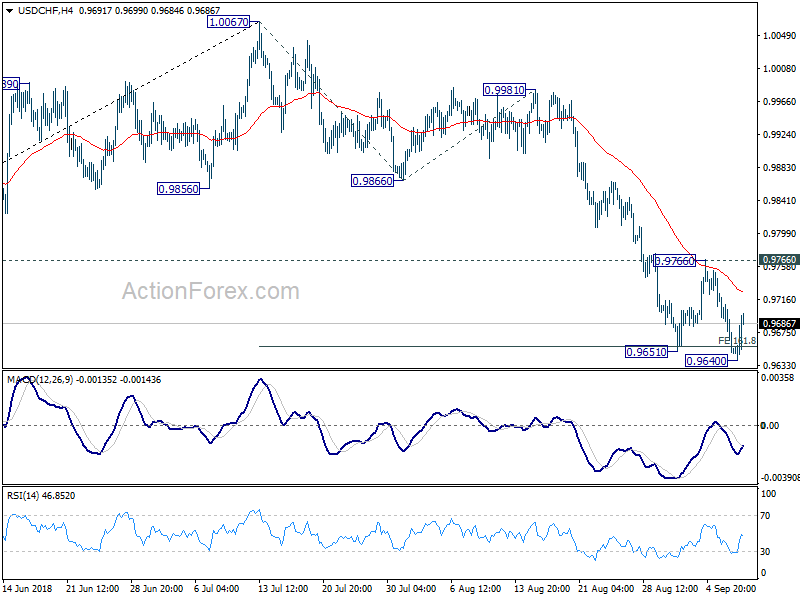
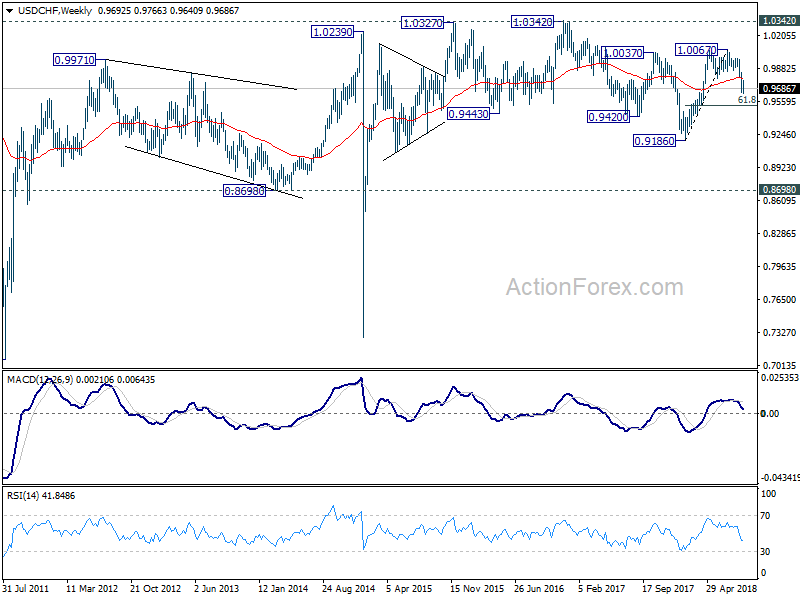
In the bigger picture, current development suggests that rise from 0.9186 low has completed at 1.0067, after failing to sustain above 1.0037 resistance. Fall from 1.0067 could extend to 61.8% retracement of 0.9816 to 1.0067 at 0.9523 and below. But for now, we don't expect a break of 0.9186 low. On the upside, firm break of 0.9866 support turned resistance will suggests that fall from 1.0067 has completed and rise from 0.9186 is resuming.
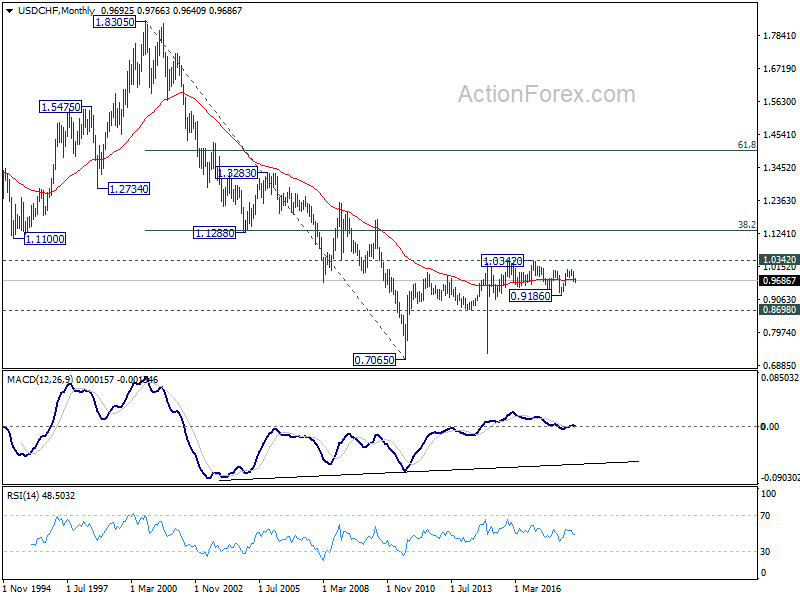
In the long term picture, price actions from 0.7065 (2011 low) are not clearly impulsive yet. Thus, we'll treat it as developing into a corrective pattern, at least, until a firm break of 1.0342 resistance.
AUD/USD Weekly Outlook
AUD/USD's down trend extended last week to as low as 0.7097. 100% projection of 0.7452 to 0.7201 from 0.7361 at 0.7110 was already met and there is no sign of bottoming. Initial bias remains on the downside this week for 161.8% projection at 0.6955. Break will target key support level at 0.6826. On the upside, break of 0.7210 resistance is needed to indicate short term bottoming. Otherwise, outlook will stay bearish in case of recovery.
In the bigger picture, rebound from 0.6826 (2016 low) is seen as a corrective move that should be completed at 0.8135. Fall from there would extend to have a test on 0.6826. There is prospect of resuming long term down trend from 1.1079 (2011 high). Current downside momentum as seen in daily and weekly MACD support this bearish case. Firm break of 0.6826 will target 0.6008 key support next (2008 low). On the upside, break of 0.7361 resistance is needed to be the first sign of medium term bottoming. Otherwise, outlook will remain bearish even in case of strong rebound.
In the longer term picture, the corrective structure of rebound from 0.6826 (2016 low) to 0.8135, and the failure to break 38.2% retracement of 1.1079 (2011 high) to 0.6826 at 0.8451, carry bearish implications. AUD/USD was also rejected by 55 month EMA. Now, the down trend from 1.1079 is in favor to extend. On break of 0.6826, next target will be 61.8% projection of 1.1079 to 0.6826 from 0.8135 at 0.5507.