

Sample Category Title
The Weekly Bottom Line: Summer’s Ending, But the U.S. Economy Still Shines
U.S. Highlights
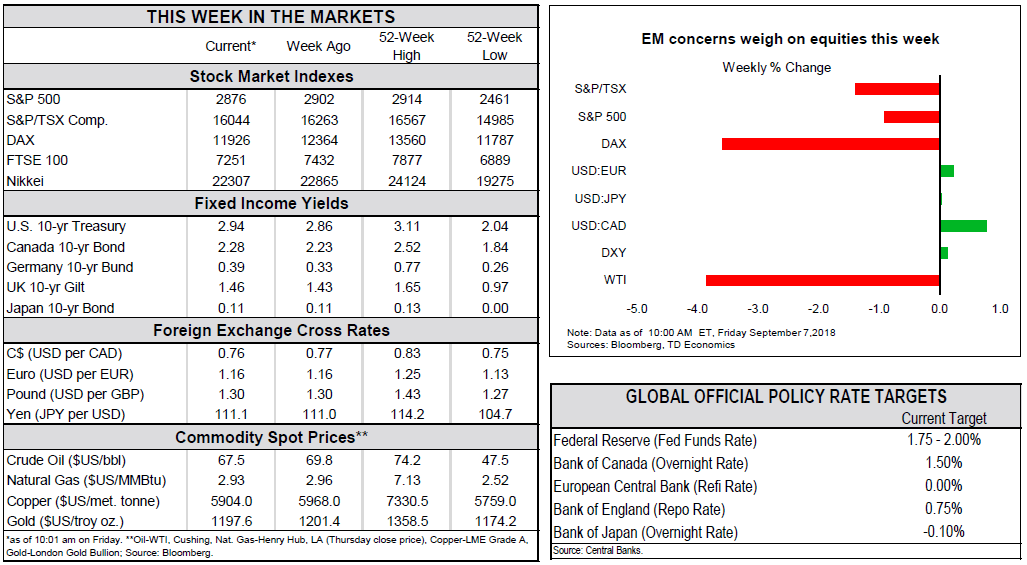
- Concerns about emerging markets continued to weigh on investor sentiment this week, with the selloff in EM assets and currencies spreading beyond Turkey and Argentina.
- Meanwhile, domestic data remained positive. ISM indices for both manufacturing and services sectors rose handsomely in August. The payroll report delivered another batch of good news with 201k new jobs created on the month and wage growth accelerating.
- All told, the U.S. economy continues to boom, giving the Fed little reason to alter its interest rate normalization plans that include another increase on September 26th.
Canadian Highlights
- As expected, the Bank of Canada left the overnight rate at 1.5%. Its accompanying statement was generally upbeat, noting positive developments on both external and domestic fronts.
- A follow up speech by Senior Deputy Governor Wilkins noted Canada's resilience, but also emphasized the Bank's focus on monitoring economic data and the impact of trade developments on the inflation outlook.
- Canada's job market took a step back in August, shedding 51.6k jobs, all them part time (-92k). The unemployment rate rose to 6.0% from 5.8% in July.
U.S. - Summer's Ending, But the U.S. Economy Still Shines
Trade developments and payrolls stole the limelight in this busy, holiday-shortened week. Concerns about emerging markets continued to weigh on investor sentiment with the selloff in EM assets and currencies spreading further beyond Turkey and Argentina. Meanwhile, the increased risk of another round of economic sanctions has sent the Russian ruble lower.
While selling pressure eased somewhat by the week's end, headwinds battering emerging markets are unlikely to dissipate soon. U.S. expansionary fiscal policy is buoying domestic growth, putting upward pressure on the dollar, inflation, and interest rates. At the same time, trade spats with China and other U.S. trade partners are weighing on overseas currencies and global growth. As a result, dollar strength coupled with worries about trade should continue to fuel investor flight from emerging markets.
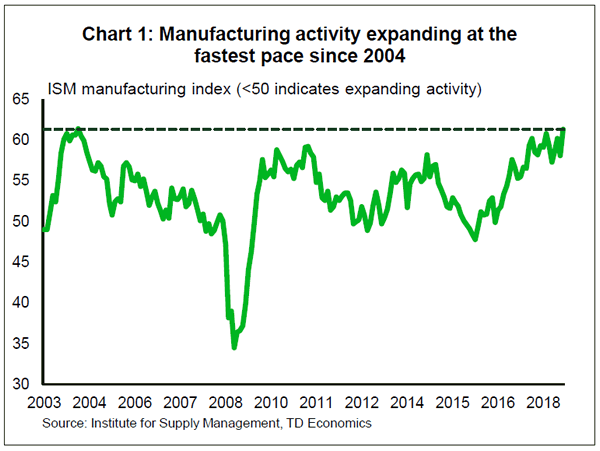
Meanwhile, if cracks are appearing in U.S. business confidence, they were nowhere to be found in the August data. ISM indices for both manufacturing and services sectors rose handsomely (Chart 1), suggesting that U.S. industries remain at the top of their game. Even as tariffs continue to raise costs and play havoc with supply chains, companies report rising new orders and expanded production on the back of solid domestic demand that offers a deep cushion against potential tariff impacts.
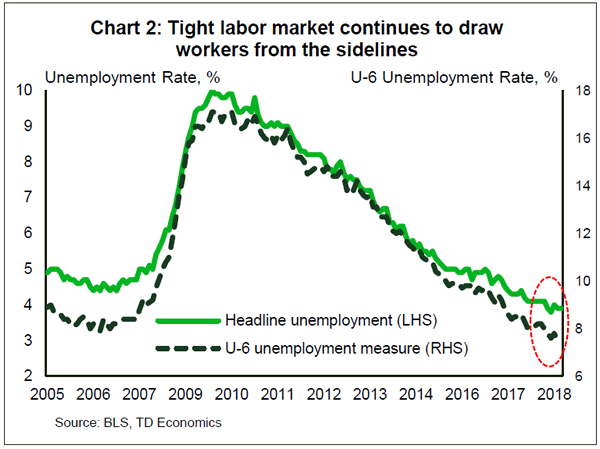
Strong sentiment and economic momentum is boosting hiring, as evidenced by today's payroll report, which showed that 201k new jobs were created in August. With the jobless rate hovering at historic lows, it is becoming increasingly difficult to find workers to fill positions. This continues to draw in workers from the sidelines (Chart 2) and also motivating firms to raise wages. As a result, the closely watched average hourly earnings measure rose 0.4% in August, accelerating to 2.9% on a year-over-year basis. This is the fastest pace of wage growth of the recovery, and may prove to be the start of the long-awaited sustained pickup in wage growth.
Clearly the U.S. economy is barreling full steam ahead, and the estimated impact of tariffs has so far been quite small. The $50 bn in import tariffs on China and the steel and aluminum tariffs may shave roughly 0.2 ppts off U.S. real GDP growth in about years' time, and add two tenths of a point to inflation. However, as we note in our report, the tariffs in place are only the tip of the iceberg relative to those under review or threatened. So far the U.S. has levied tariffs on $107 bn of imports into the U.S., but the total tariff action under consideration amounts to $715 bn. If implemented, they could place about 1.2 ppts of U.S. and 0.4 ppts of global growth at risk.
All told, an escalation in the trade spat with China and waning global demand may yet test the durability of the current expansion. However, for now the U.S. economy continues to boom with little reason for the Fed to alter its interest rate normalization plans that include another quarter point increase on September 26th.
Canada - A Resilient Economy Beset By Risks
It was a busy week for Canadian economy watchers. Between a Bank of Canada announcement and a speech by Senior Deputy Governor Wilkins, analysts were also treated to July trade data and an August jobs report. Meanwhile, NAFTA negotiations continued, with both sides noting progress, but no deal yet.
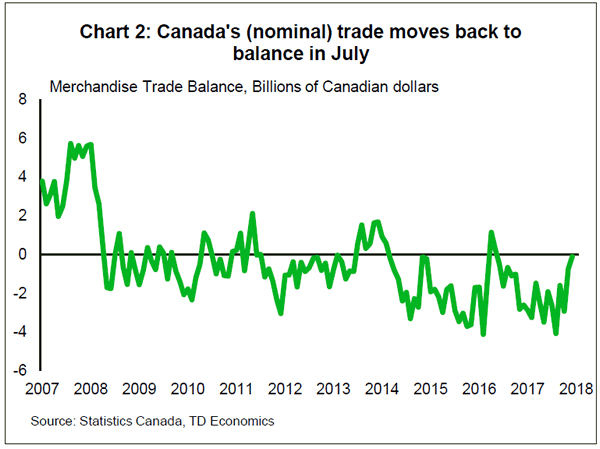
As expected, the Bank of Canada left its key lending rate unchanged on Wednesday. The content of its statement, however, could just as easily have accompanied a rising rate announcement. In terms of external developments, it noted ongoing progress in global growth and particularly robust growth stateside. Domestically, it acknowledged positive business investment and export growth (July saw the smallest trade deficit since late 2016), in spite of uncertainty around trade policy. And finally, on the housing front, the Bank noted a stabilization in activity alongside a welcomed slowdown in credit growth.
The positive tone of the statement was reinforced in a follow up speech entitled "An Update on Canada's Economic Resilience." As noted in the title, Canada's economy has continued to operate close to potential despite numerous headwinds. Having bounced back solidly from the commodity-rout, it has also withstood trade uncertainty with relative gusto. Still, Wilkins was careful to recognize the negative impact of trade uncertainty and that this is something that is not easily accounted for in the Bank's economic models, requiring ongoing monitoring and additional focus on corroborating evidence.
Wilkins also spent some time unpacking inflation developments. Headline inflation has risen to 3%, but this has been largely due to temporary factors – rising energy prices and a surge in airline prices. Core inflation measures, meanwhile, have trended right around the Bank's 2% mark, showing few signs of breaking higher or risking that the Bank has fallen behind the curve.
On this point, perhaps the part of the speech to get the most attention was the discussion of the "gradual" characterization of future policy. Wilkins noted that the Governing Council had discussed whether the term was still appropriate, given Canada's cited resilience. Ultimately, with the rise in inflation looking temporary and uncertainty around trade continuing to be a factor, the Bank of Canada opted to retain its "gradual" language.
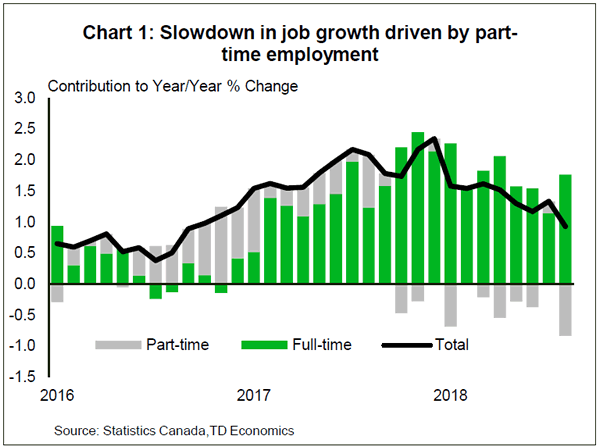
A gradual approach may also be prudent given the inherent volatility in Canadian economic data. Canada's job market pulled back in August, shedding 51.6k jobs, all of them part-time (-92k) and nearly all of them in Ontario (-80.1k). On a longer-term basis, the pace of job growth at 0.9% year-on-year seems just about right for an economy operating near potential.
All told, developments this week put an exclamation point on our expectation for an October rate hike. Following that, we think we are likely to move back into wait and see mode – with trade evelopments front and center to future Bank of Canada decisions.
U.S.: Upcoming Key Economic Releases
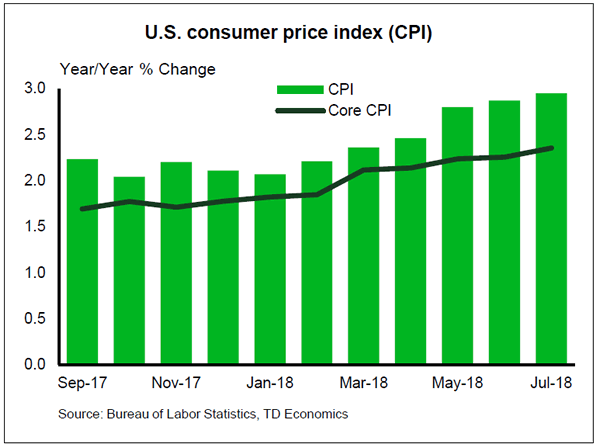
U.S. Consumer Price Index - August
- Release Date: September 13, 2018
- Previous: 0.2% m/m, 2.9% y/y; core 0.2% m/m
- TD Forecast: 0.3% m/m, 2.8% y/y; core 0.2% m/m
- Consensus: 0.3% m/m, 2.8% y/y; core 0.2% m/m
We expect CPI to moderate to 2.8% from this July peak, reflecting a 0.3% m/m gain boosted by gasoline prices and a solid core. We eye weakness in food prices on the back of the tariff-induced slowdown in agricultural prices which have depressed producer-level prices. Outside of food and energy, we look for core CPI to print a strong 0.2% m/m, keeping core inflation at 2.4%. Underpinning another strong read are goods prices, held higher in particular by a rebound in apparel and further gains in auto prices. Recent industry analyst reports continue to emphasize record higher vehicle prices while building momentum in import prices suggests scope for high import content products like apparel to post gains. As in July we will continue to watch for ongoing tariff impacts from steel/aluminium and those imposed on China, which have not yet been noticeable. Looking ahead we continue to expect headline inflation to slide further into yearend as base effects from gasoline prices dissipate.
U.S. Retail Sales - August
- Release Date: September 11, 2018
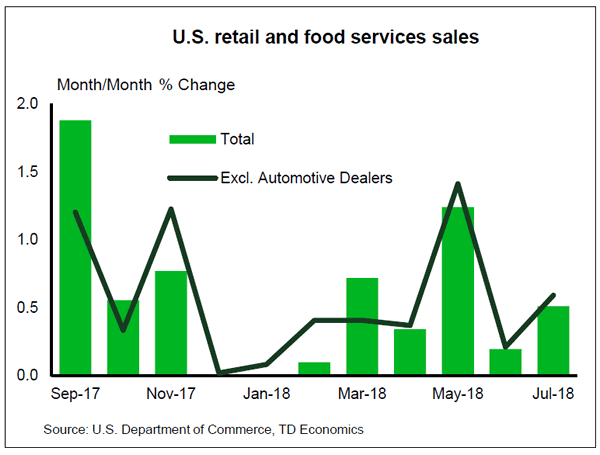
- Previous: 0.5%, 0.6% ex-auto, 0.5% control
- TD Forecast: 0.5%, 0.8% ex-auto, 0.5% control
- Consensus: 0.6%, 0.6% ex-auto, 0.5% control
We expect a strong retail sales report with headline sales rising 0.5% in August. Auto sales are a drag this month but elsewhere we eye gains across gasoline stations (helped by higher gasoline prices), restaurants (warm weather) and the broader control group. The latter is expected to post a 0.5% increase. The August read would be consistent with Q3 real PCE at a solid rate near 2.5-3%, underpinning Q3 GDP tracking north of 3%.
Canada: Upcoming Key Economic Releases
Canadian Housing Starts - August
- Release Date: September 11, 2018
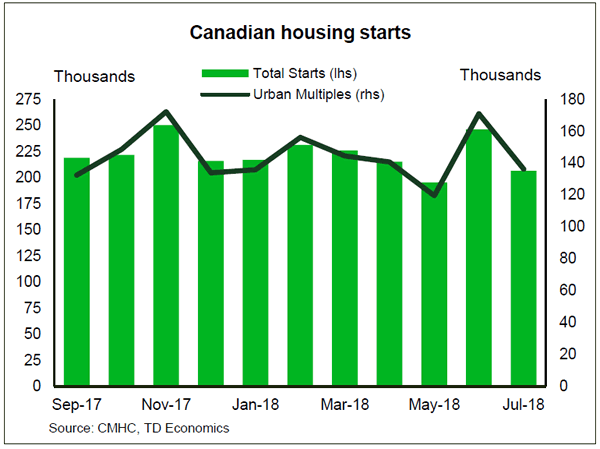
- Previous: 206.3k
- TD forecast: 225k
- Consensus: NA
We look for a sizeable rebound in August housing starts to 225k, slightly above the 6-month average and following a 206k pace in July. This would be consistent with the trend in building permits which have maintained a steady uptrend since late 2017. In the details we expect increases in both single- and multi-unit starts. The former in particular hit a more than 3-year low in July whereas permit issuance picked up in the summer months, pointing to a rebound. Overall, the August rebound if realized would leave housing construction tracking fairly solid into Q3 but further out we continue to expect a gradual moderation closer to a 200k pace, consistent with a rising rate environment.
Trade Tensions and Strong US Employment Lift Dollar
The US dollar rose on Friday against all major pairs after a strong U.S. non farm payrolls (NFP) report was published. The US added 201,000 jobs, but more importantly hourly wages beat expectations in August coming in at 0.4 percent. The market has priced in a rate hike by the U.S. Federal Reserve when Federal Open Market Committee (FOMC) members meet on September 25–26. Next up in the economic calendar are the releases of US inflation and retail sales data.
Fundamentals back the rise of the US dollar, but its the jitters triggered by the escalation of a trade war between the US and China that has made the greenback a safe haven. Emerging and developed markets continue to suffer effects of risk aversion as uncertainty about the new round of US tariffs.
- Bank of England (BoE) to hold rates on Thursday
- European Central Bank (ECB) to keep tapering pace steady
- US inflation and retail sales could boost USD
ECB to Keep Tapering Steady This Week
The EUR/USD lost 0.35 percent in the last five days. The single currency is trading at 1.1561 after the August NFP report delivered on all fronts. The pace in job gains continues even as the slack has been reduced. Wages in the US are showing signs of life, but haven’t created inflationary pressures. The Fed is expected to deliver its third interest rate hike this month. The CME FedWatch tool shows a 99.8 percent probability of a 25 basis points upward change to the Fed funds rate.
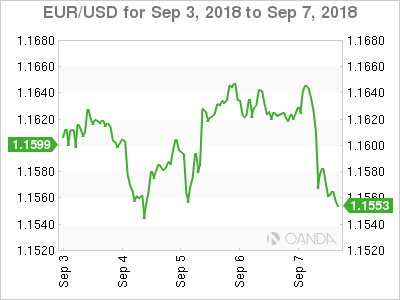
The probability of rate lift in December rose from 70.9 percent a day ago to 77.6 percent after the release of the US jobs report.
The European Central Bank (ECB) will publish its rate statement on Thursday, September 13. Little surprises are expected from the central bank as its set to wrap up its QE program by the end of 2018.
The press conference hosted by ECB President Mario Draghi will be the highlight as he is sure to make comments on the headwinds the European economy is facing. Trade and political tensions will get a mention. Investors will be listening in to find some clues about the possible first rate hike by the ECB, but Draghi has said that it could come after the summer of 2019.
Canadian Dollar Falls Dragged Down by Disappointing Jobs Report
The USD/CAD gained 1.01 percent in the first week of September. The currency pair is trading at 1.3173 after a tale of two reports put downward pressure on the loonie. The Canadian and US jobs reports were published on Friday at the same time. While the US economy added 201,000 and saw wage growth. The Canadian economy lost 51,600 jobs in August and the unemployment rate rose to 6 percent.
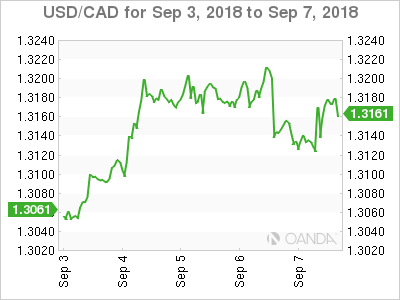
The Bank of Canada held rates unchanged in September and with the disappointing August jobs report probabilities of an October rate hike are now below 60 percent.
Next week in the Canadian economic calendar looks thin, with the new house price index on Thursday being the highlight. US data will continue to dominate as inflation indicators will be published. The producer price index PPI on Wednesday, September 12 and the consumer price index (CPI) on Thursday.
Canadian officials said that a deal with the US to replace NAFTA would not be reached on Friday. The market remains optimistic about a deal being struck, but given the two sides remain apart on key issues it could take more time for negotiations to reach a productive outcome.
Crude Falls on Trade Tension and Demand Jitters
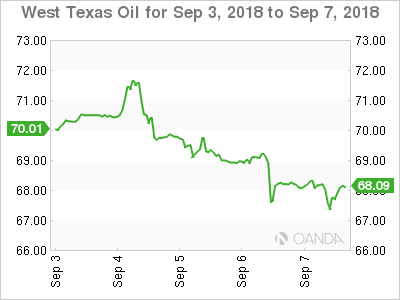
Oil prices closed the week 2.9 percent lower. West Texas Intermediate was trading at $68.11 on Friday. The escalation of trade war rhetoric and its potential reality are impacting global energy demand forecasts. The weekly US crude inventory release showed slowing demand in gasoline and distillates with the end of the driving season in sight.
Gold Lower After Strong Jobs Report Boosts Dollar
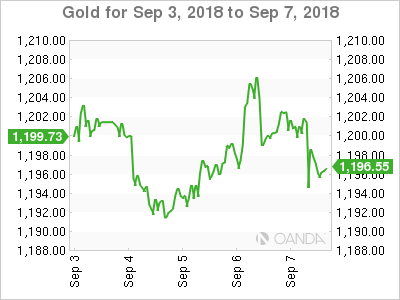
Gold had a volatile week and ended up lower on a weekly basis. The. Yellow metal closed slightly above the $1,200 price level. A solid jobs report, with a gain of 201,000 jobs and strong wage growth validates the September rate hike that is already priced in, and puts a December rate hike firmly on the table.
White House Advisor Larry Kudlow said on Friday that the US is waiting to China to agree to specific issue before the process can move forward.
Economic indicators in the US back up two rate hikes this year putting pressure on gold prices awaiting inflation data during the week.
Peso Drops as NAFTA 2.0 Deal Remains Out of Sight
The USD/MXN rose during the week. The currency pair is trading at 19.3213 after the peso dropped following the publication of the NFP jobs report. Dollar fundamentals were strong this week with lagging and leading indicators pointing to a solid economy and validating two more rate hikes by the U.S. Federal Reserve.
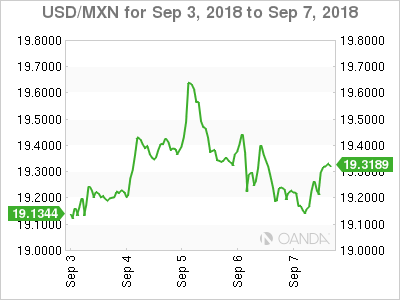
The threat of more US tariffs on China put pressure on emerging markets and the peso is beginning to shed some of the protection gained by reaching a deal with the US.
Market events to watch this week:
Monday, September 10
- 4:30am GBP GDP m/m
- 4:30am GBP Manufacturing Production m/m
Tuesday, September 11
- 4:30am GBP Average Earnings Index 3m/y
Wednesday, September 12
- 8:30am USD PPI m/m
- 10:30am USD Crude Oil Inventories
- 9:30pm AUD Employment Change
Thursday, September 13
- 7:00am GBP MPC Official Bank Rate Votes
- 7:00am GBP Monetary Policy Summary
- 7:00am GBP Official Bank Rate
- 7:45am EUR Main Refinancing Rate
- 8:30am EUR ECB Press Conference
- 8:30am USD CPI m/m
- 8:30amUSD Core CPI m/m
Friday, September 14
- 6:00am GBP BOE Gov Carney Speaks
- 8:30am USD Core Retail Sales m/m
- 8:30am USD Retail Sales m/m
*All times EDT
Stocks fall, Dollar and Yen surge as Trump ready to tariff additional $267B in Chinese goods
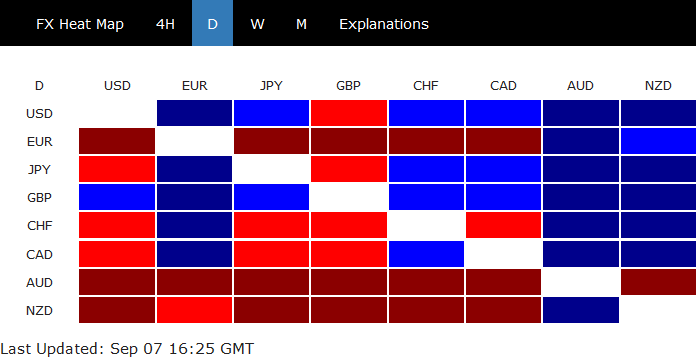
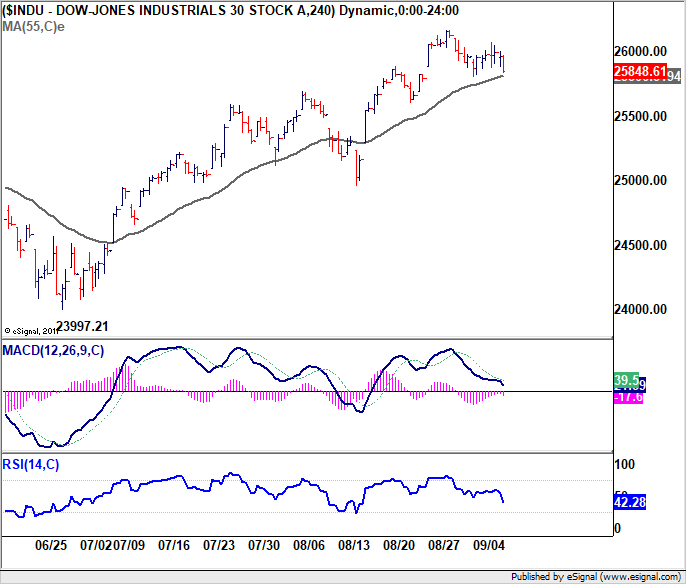
DOW drops "slightly" by -130 pts, Dollar and yen surge, after Trump said he's ready for more tariffs on China. The public hearing on 25% tariffs on USD 200B of Chinese goods ended yesterday. Trump said he has additional USD 267 billion in goods identified to tariff any time. Additionally, he said he's started trade negotiation with Japan. And on Canada, he added "we'll see what happens".
Dallas Fed Kaplan: Job report reaffirm view to move rate to neutral
Dallas Fed President Robert Kaplan said in a Fox interview that "I believe in light of economic performance we ought to be moving toward neutral...that tells me over the next nine to 12 months we ought to be raising the fed funds rate probably at least three more times, maybe three or four times."
And referring to today's strong NFP, he added "everything that is in this jobs report today just causes me to reaffirm that view."
UK Manufacturers to See a Slowdown; UK GDP Growth to Inch Up in July
Early this week the IHS/Markit Institute indicated that the British manufacturing industry had slowed down to its lowest expansion rate since July 2016 – July 2016 was just after the Brexit referendum – as the country’s export business contracted for the first time in more than two years despite the weakness in the sterling relative exchange rate. The worrisome numbers have now shifted attention to the UK industrial figures due on Monday which could add further fuel to concerns that Brexit and trade uncertainties have already started to put breaks on the UK’s industrial growth. Still, fresh GDP growth readings published on the same day could support that the British economy has overall picked up steam.
At 0830 GMT on Monday, the Office for National Statistics is forecasted to say that on a monthly basis industrial growth has slowed down to 0.4% in July from 0.2% in June, maintaining the yearly gauge steady at 1.1%. Separately in the manufacturing sector, which accounts for about 10% of the British economy, expansion is also expected to ease by 0.2 percentage points to 0.2%, though in yearly terms the sector is projected to lose steam, printing a slightly weaker growth of 1.4% compared to 1.5% in the previous month. While the latter would not create bold headlines, as the change is minimal, investors could take the numbers as an evidence that trade restrictions from the US and the lack of clarity in the Brexit front – particularly whether this would negatively affect UK businesses – have already created hurdles for companies.
The speculation could set off a wave of selling in the pound, which was unable to benefit from good manufacturing export orders in August. Although the currency was depreciating the past five months against the US dollar, foreign demand for UK manufacturing products, fell to the lowest in two years according to the latest PMI survey. Exports of total services and goods for the second quarter showed the strongest deterioration since the end of 2009 as well, plunging by 3.6% y/y. Elsewhere, in the London Exchange Stock Market, the FTSE 100 was another weak spot, as the blue-chip index failed to extend gains on the back of a slipping pound, moving down by 5% after reaching all-time highs in May.
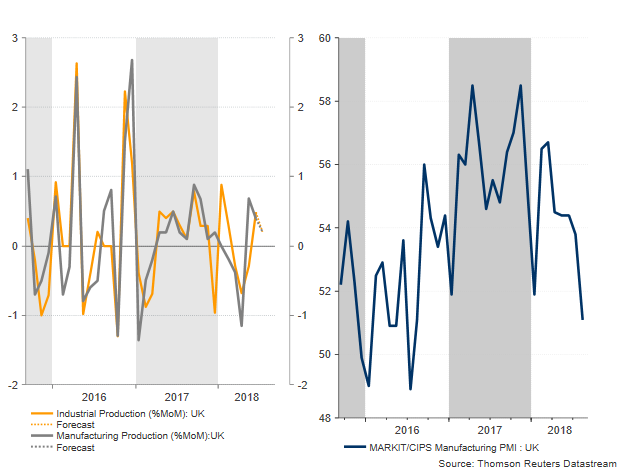
Before taking a position on the pound, however, investors will look at July’s GDP data delivered together with the industrial report as these would give a clue on how the British economy performed at the start of the third quarter. Analysts believe that GDP growth improved to 0.2% m/m from 0.1% in June, driving the yearly measure up by 0.1 percentage points to 1.5%. An equivalent gain is also expected in the three-month growth average which is expected to come in at 0.5%.
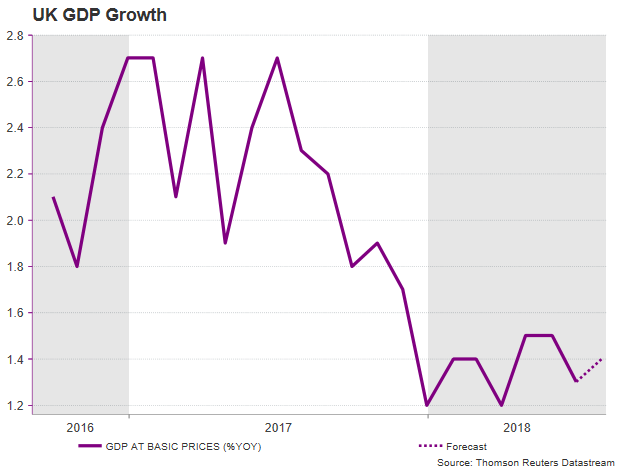
Should GDP results appear more encouraging than analysts estimate, proving that the economy in overall had a better start in the third quarter, pound/dollar could surpass today’s high of 1.3028 to touch 1.3058, the 23.6% Fibonacci of the downleg from 1.4376 to 1.2660. Even higher, the focus would shift to the 1.3100 psychological level ahead of the 32.8% Fibonacci of 1.3131. Still, any disappointment in the industrial figures could limit upside movements in sterling.
On the other hand, a worse than expected GDP outcome would cloud views on the economic outlook, sending the pair down to 1.2900 where the price found some support in previous sessions. Stronger bearish corrections could also eye the 1.2800 round level.
Any new Brexit- or trade-related development could override any data impact. Recall that on Friday, transcripts published by the UK parliament showed that the EU Brexit negotiator is open to discussing alternative backstops in the withdrawal agreement. The statement offered a tailwind to the pound, pushing it above 1.30.
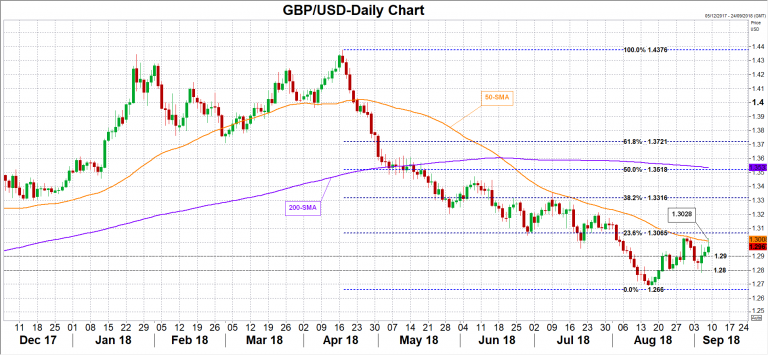
Trump is Struggling With Only Two Months to Midterm
Today's key points
- US midterm election is mostly a political event not an economic event.
- We expect the market implications to be limited, as Trumponomics is unlikely to be rolled back.
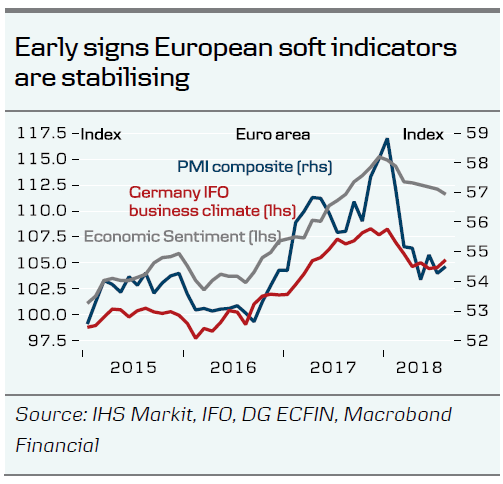
- In Europe, there are early signs that soft indicators are stabilising, meaning that growth will probably remain at current levels.
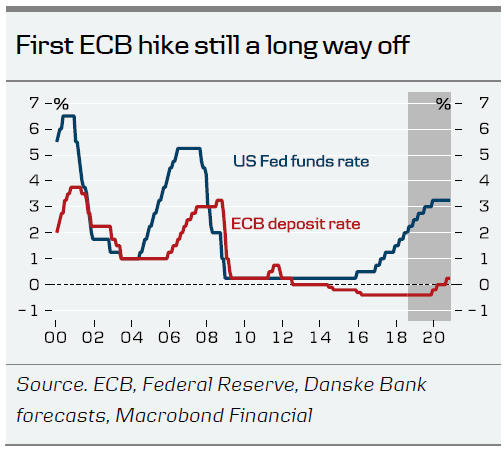
- We still do not expect the ECB to hike before December 2019, as inflation remains subdued.
US midterm election is mostly a political event
Trump's first real political test is on Tuesday 6 November, when the midterm elections take place. While media coverage is going to be intense, we think the election is mostly a political event not an economic event, which we discussed in depth in US Midterm Elections – Mostly a political event with limited implications for markets and the economy, 4 September. We believe the US expansion is set to continue in coming years, as optimism remains high and fiscal policy remains expansionary.
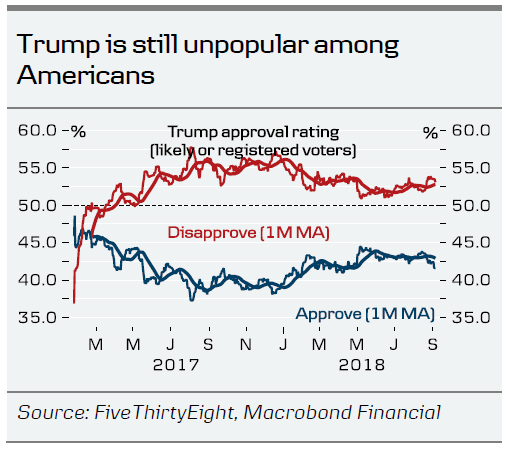
The most likely outcome is that the Democrats win the House but the Republicans retain Senate control. This would make President Donald Trump a 'lame duck' in the sense that he cannot get through with his domestic agenda. Trump's focus would remain on foreign and trade policy. If the Democrats win the House, we believe they are likely to start an impeachment process against Trump. While this would create a lot of headlines and noise, we do not think Trump would be convicted, as this requires a super-majority in the Senate (impeachment is a political, not a legal, verdict).
Even if the Democrats win control of both chambers, it would be difficult for them to roll back Trump's laws/policies, as Trump can veto any attempt to do that, which should limit the immediate impact on US Treasuries. The higher government deficits ahead would increase US Treasury issuance and put upward pressure on long-end US yields. The midterm elections are also unlikely to change the Fed's outlook despite Trump's criticism. The flattening of the US yield curve remains the main focus.
EUR/USD and real rates have moved apart under Trump. In a scenario where Trump ends up a 'lame duck' after the midterms, it could support the USD somewhat (and weigh on EUR/USD), as the 'Trump discount' may start to be priced out. History suggests that the midterm elections are secondary for equities. We are positive on equities, as returns are more dependent on macro than politics, although volatility may be higher.
European indicators are stabilising
Growth in the euro area has slowed this year, from 0.7% per quarter on average in 2017 to 0.4% in both Q1 and Q2 18. Euro area soft indicators have fallen sharply this year but part of the story is that growth was never as strong as the indicators showed. Now there are early signs that the soft indicators are stabilising, suggesting that growth will stay around the current level. This is also visible in the euro area surprise index, which is back to neutral after its sharp fall earlier this year. This is good news, as it suggests the European expansion is continuing, although at a slower pace than in 2017, and we expect the unemployment rate to decline further. As the expansion is not as old as the US expansion, the expansion has further to go still.
Despite above-trend GDP growth, the European Central Bank is a long way from raising rates, as the inflation pressure remains subdued. We expect the first hike to come by the end of 2019 and next week's ECB meeting is likely to be undramatic. We still expect the ECB to end its bond-buying programme by the end of this year. For more, see ECB Preview – For the feinschmeckeres, 7 September.
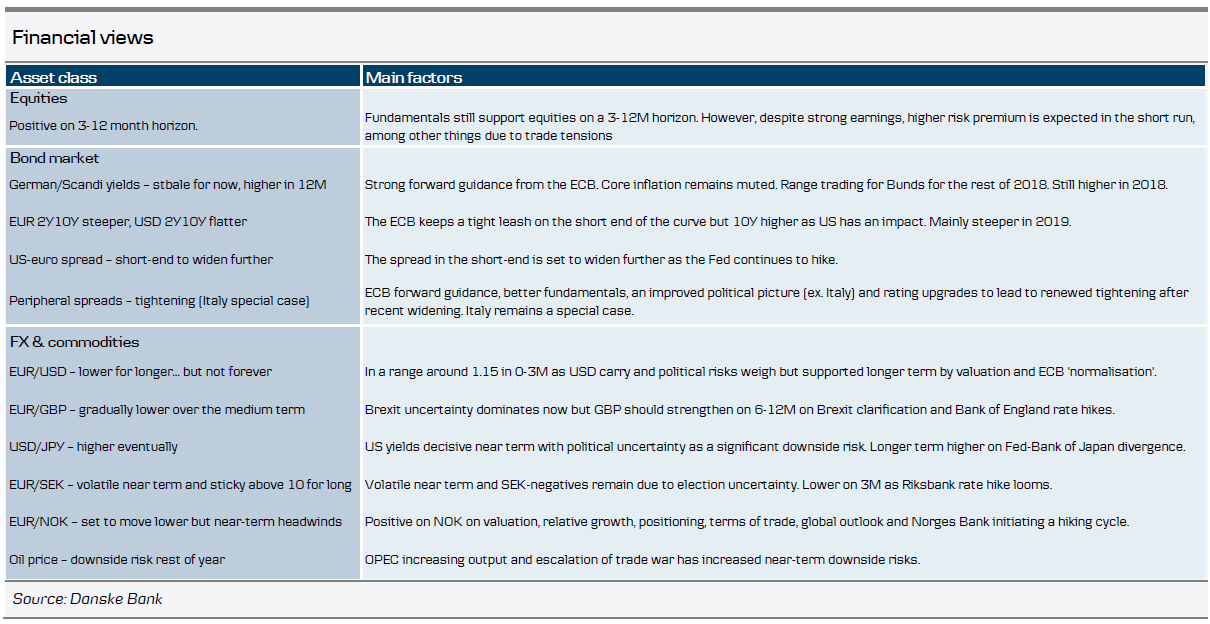
Following marked growth divergence in favour of the US, we believe the relative cyclical picture is starting to shift with the improved economic data in the euro area. Short term, we think the relative-rate support for USD and EUR political risks will dominate, leaving EUR/USD in the sub-1.15 range but we see the cross staying above 1.10. At yearend, when the relative cyclical picture may shift in favour of the euro area and the euro capital outflows of recent years are fading when the first ECB hike draws closer, we think EUR/USD will move higher again. We forecast EUR/USD in 1.18 in 6M and 1.25 in 12M.
.
We still expect a steeper EUR yield curve on a 12-month horizon. The ECB still maintains a relatively tight grip on the short end of the curve. However, this is not the case for the 10Y segment of the curve, which we expect to be pushed higher by rising US yields, the end of ECB QE from the ECB and the pricing of rate hikes in 2019/20. For more see our Yield Outlook, 14 August.
Week Ahead: Markets See a Range of Highs and Lows Between Stocks, Currencies and Commodities
The markets in the past week have experienced various movements in a variety of sectors, ranging from Index’s to currencies. The decline in gold had been a major issue and had arose the possibilities of an increase in inflation. Nevertheless, the precious metal was saved by dollar’s decline. Additionally, oil supply had momentarily dropped due to hurricane Gordon. However, has now stabilized after U.S. crude inventories had dropped to its lowest since 2015. NASDAQ and S&P 500 have seen a decline due to Netflix paving the way for heavy tech stocks sell off. US economy successfully added 201k jobs in August and unemployment rate steady at 3.9%.
EUR/USD
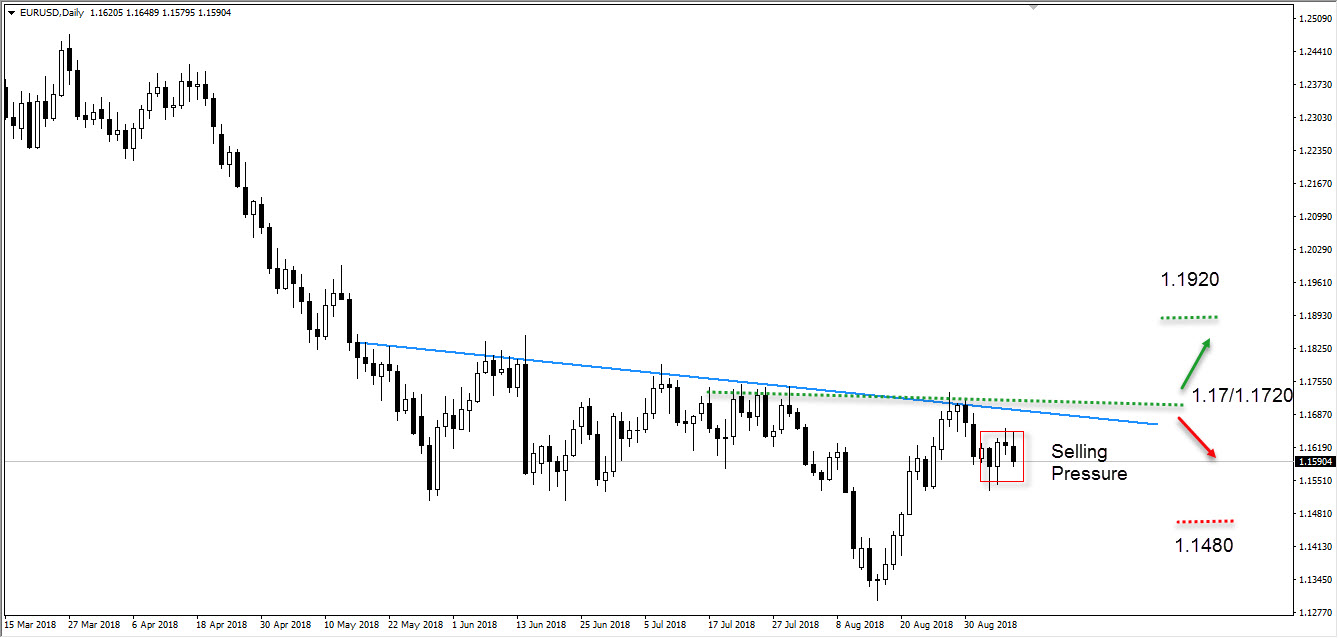
The chart below on a daily time-frame shows the pair EUR/USD which is priced at $1.15904 is trading below the downward trend line. This shows that the bearish sentiment is still present in the markets for the pair EUR/USD. In addition, the possibilities of the price trading towards the support line (coloured in red) which is priced at $1.1480 is present. However, if the price is able to breakout of the downward trend line in an upward movement it may drive towards the resistance line (coloured in green) which is priced at $1.17.
Major support: 1.1480
Major resistance: 1.1920
GBP/USD
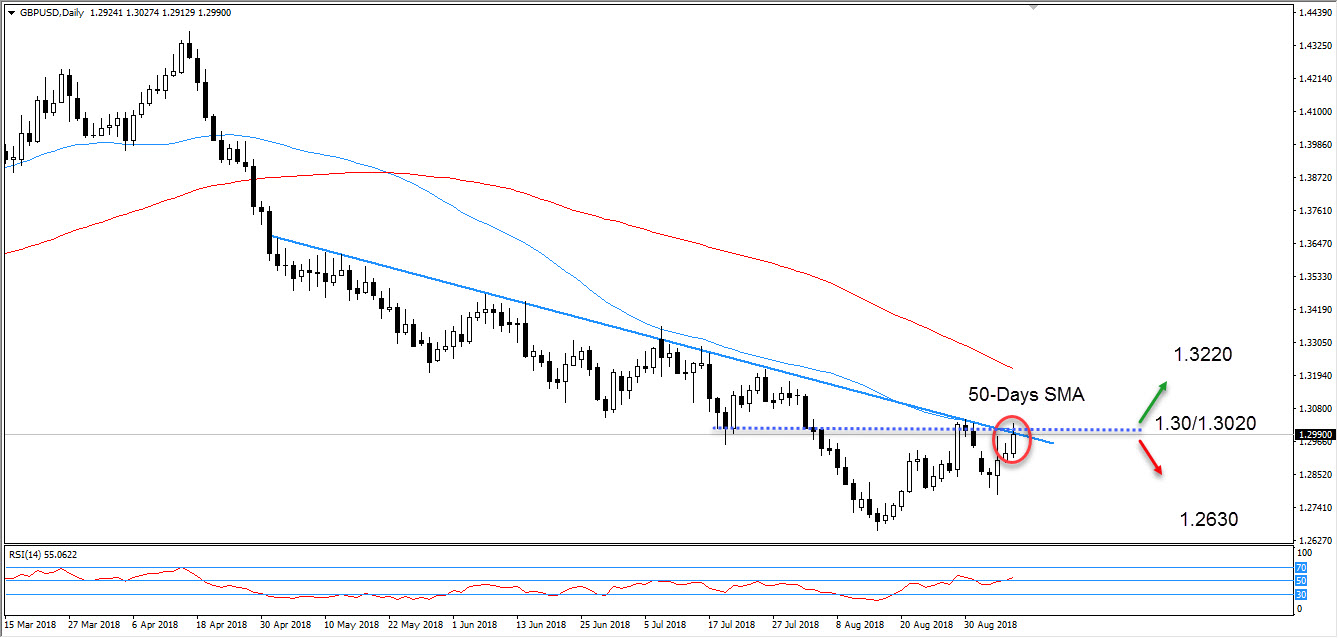
The chart below on a daily time-frame shows the pair GBP/USD failing to break the resistance level (shown in dotted blue line) which is priced at $1.30. Moreover, this in turn increases the bearish negative sentiment in the markets amongst the pair. In addition, it is evidently displayed below that the pair has seen a reversal at the 50-day moving average (coloured in blue). On the other hand, if the level of $1.3220 holds, then it is possible to see a re-test towards the support zone at $1.2630 (red arrow showing location of support).
The Relative Strength Index chart shows that the price for GBP/USD is being controlled by a bullish movement trading towards the oversold zone.
Major support: 1.2630
Major resistance: 1.3220
USD/JPY
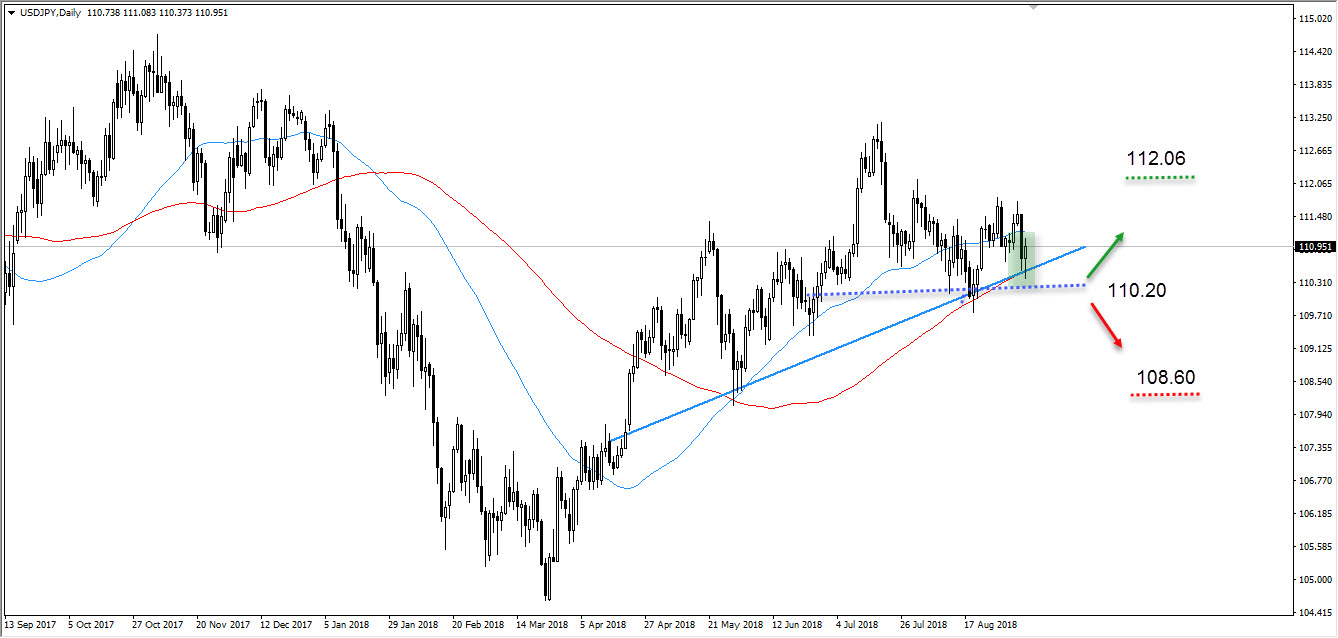
The chart below on a daily time-frame shows the pair USD/JPY which is currently priced at $110.951 is trading up which informs that the US dollar strength is assisting in the pairs rise. It is evident below that a rebound has taken place and a bullish signal is present in the markets for the pair. This increases the likelihood for the price to trade towards the resistance zone (coloured in green) which is priced at $112.06
Major support: 108.60
Major resistance: 112.06
XAU/USD
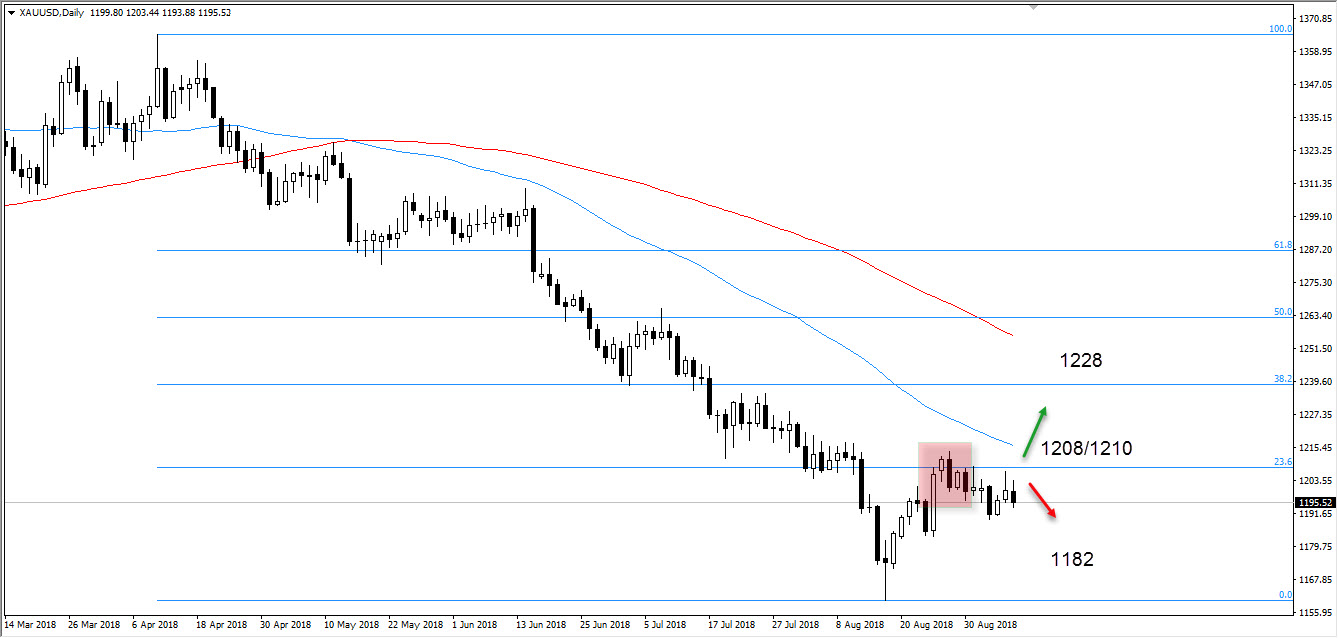
The chart below on a daily time-frame shows the pair XAU/USD which is priced at $1195.52. It is evident that an upward correction move has reversed at the Fibonacci areas of 23.6%. This has taken place with a bearish signal being present. Therefore, a continuation for the mid-term downtrend is the scenario which may take place. If the price trades along and beneath the downtrend it is possible that it will reach the support zone (indicating by a red arrow) which is priced at $1182.
Major support: 1182
Major resistance: 1228
WTI
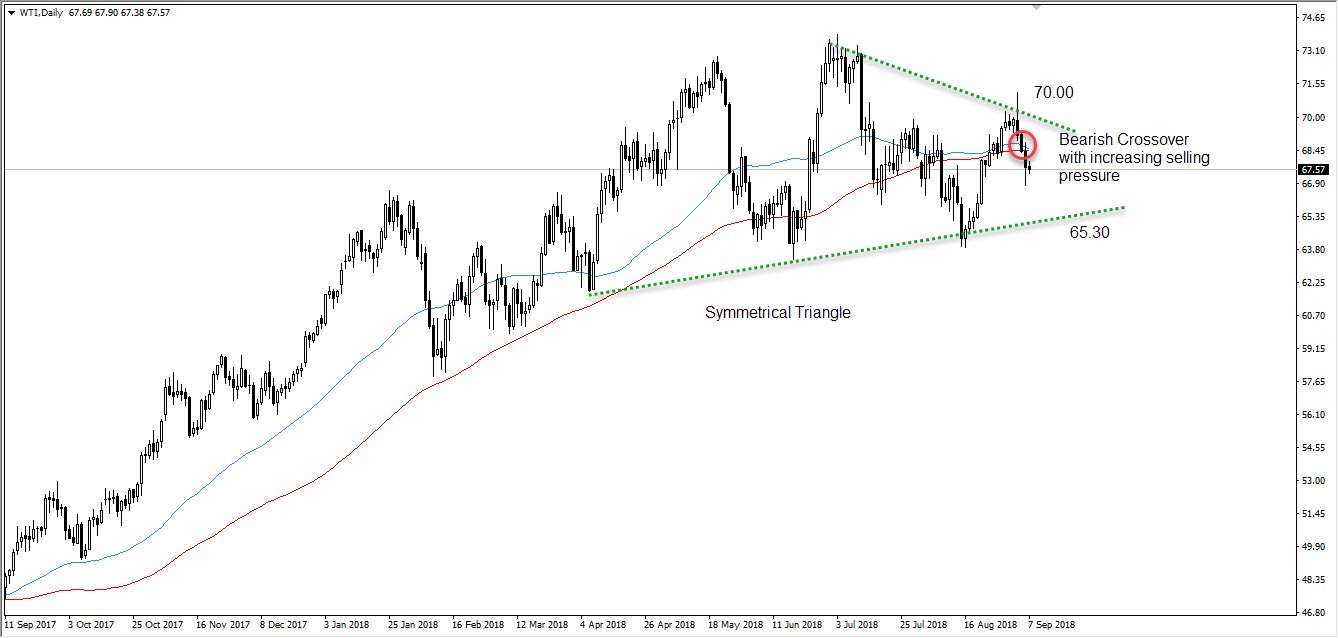
The chart below on a daily time-frame shows U.S. West Texas Intermediate is seen to be in a range and is trading within the symmetrical triangle which is clearly indicated with two dotted green lines. Moreover, the sell signal along with the bearish cross-over between the 50 (blue) and 100 (red) day moving averages indicates a possible downward move which would break through the down line of the symmetrical triangle leading the price to trade to $65.30.
Major support: 65.30
Major resistance: 70.00
DOW JONES
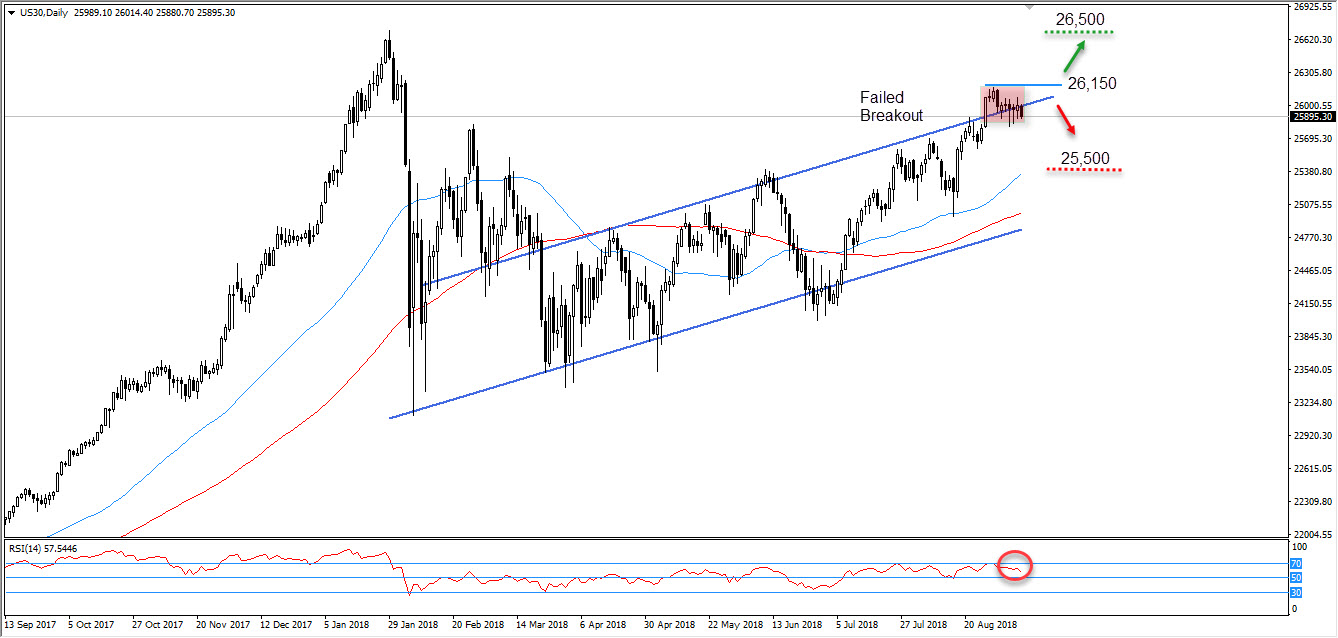
The chart below on a daily time-frame shows the Index DOW JONES which is priced at $25895.30 failing to keep up the momentum of a bullish breakout. Therefore, as displayed below the resistance zone (coloured in blue) which is priced at $26,150 still holds.
The weekly close which lies within the upward channel, informs that the breakout has most certainly failed and now a downward trend where the price would trade towards the support zone (coloured in red) which is priced at $25,500 is likely but not definite.
Major support: 25,500
Major resistance: 26,500
Australia & New Zealand Weekly: We Still Expect a Growth Slowdown in 2019 Despite Recent Strong GDP Report
Week beginning 10 September 2018
- We still expect a growth slowdown in 2019 despite recent strong GDP report.
- Australia: Westpac-MI consumer sentiment, Westpac-AusChamber survey, employment, RBA Assistant Governor Bullock speaks.
- NZ: retail card spending, house sales and prices.
- China: fixed asset investment, retail sales, CPI.
- Europe: ECB policy decision and forecasts.
- US: CPI, retail sales, Federal Reserve Beige Book.
- Other central bank meetings: BoE, Central bank of Turkey, Central Bank of Argentina.
- Key economic & financial forecasts.
Information contained in this report current as at 7 September 2018.
We Still Expect a Growth Slowdown in 2019 Despite Recent Strong GDP Report
The June quarter GDP report was released this week. Due to upward revisions of around 0.5 percentage points, the Australian economy was revealed to be much stronger than we had been led to believe.
Real GDP expanded by a solid 0.9% in the June quarter and annual growth printed 3.4% – well above potential of around 2.75%. Markets were expecting annual growth of around 2.8% with most of the lift being attributed to revisions of earlier quarters.
These accounts have prompted a review of our growth outlook.
We have lifted our growth forecast for 2018 from 2.7% to 3.3%.
The growth forecast for 2019 has been lifted from 2.5% to 2.7% and the 2020 forecast has increased from 2.8% to 3.0%.
While the levels of the growth forecasts have been lifted, the profile of an economy that will slow into 2019 and lift modestly in 2020 remains.
Furthermore, these growth rates (following 2.4% in 2017) are insufficient to make any meaningful impact on the spare capacity in the economy and therefore our inflation and wages forecasts remain essentially unchanged.
Our key themes over the forecast period remain intact:
- House prices in Sydney and Melbourne are now falling and this process is expected to persist through the remainder of 2018, 2019, and well into 2020. The adjustments will be shallow but persistent. That process will see consumption per capita which has been running at a pace slightly above household income per capita drop below that pace. We also expect total labour income growth to slow from 5% in 2017, to 4% in 2018, 3.6% in 2019, and drifting back to 4% in 2020. Slower income growth complemented by the expected wealth effect should see consumer spending growth slow from the current 3% to a more modest 2.6% in 2019 and 2.8% in 2020.
- We expect global growth to slow from 3.8% in 2017 to 3.5% in 2020. That slowdown in global growth through 2019 and 2020 reflects China on a steady downswing (down to 6.0% growth in 2020); US slowing from mid-2019 (partly under the weight of persistent Fed tightening – US growth to slow to 1.7% in 2020; Japan responding badly to the introduction of a consumption tax in 2019 (growth slowing to 0.7% in 2020); European growth dropping below trend as the ECB stops QE (back to 1.5% in 2020); trade disruptions; and ongoing adjustments being required in those emerging markets that may be exposed to US interest rates, a strong USD, and higher oil prices.
- While we have been surprised by the data revisions to the housing construction cycle (dwelling investment growth for the September to March quarters was revised up from minus 1.3% to plus 2.2%) a slowdown seems highly likely. Strong population growth will be insufficient to counter slowing foreign investment; credit tightening by the Australian banks; current increases in mortgage rates; and prospects of tax changes following next year's election.
- Political uncertainty looks set to weigh on firms' investment and employment intentions through the remainder of 2018 and 2019. These factors have played out clearly during the election campaigns of 2013 and 2016.
- The drought will weigh on farm exports and rural investment and consumption through 2018/19.
Nevertheless we have factored in a number of positives over this period that were apparent in the national accounts and partly responsible for our modest lift in growth forecasts.
- New dwelling investment is reported to have boomed at a 14% annualised pace in the first half of 2018. That current momentum indicates that the expected contraction in investment will be delayed. That contraction will include renovation spending as home owners respond to falling house prices.
- Public demand was reported to have grown by 5% over the last year. Governments are playing catch up, investing particularly in transport infrastructure and boosting health expenditure to meet the needs of a rapidly growing population. We are now expecting that momentum to hold for longer. We have raised our profile for public demand growth over 2019 and 2020 from 3.8% (2019) and 3.6% (2020) to 4.3% (2019) and 4.0% (2020).
- Recent surveys of investment intentions have not been encouraging. In the June quarter, equipment investment contracted for the first time since September quarter 2016. However we are lifting our estimate of the strength of the spill-over from government spending to private investment and, while still slowing, have modestly boosted our profile for non-mining business investment.
- The accounts highlighted some improvement in wages growth. Queensland and Western Australia have lifted to 5.8% (annual), now exceeding NSW (4%) and Victoria (4.7%). That development highlights the recovery in income growth in the mining states and signals a somewhat more buoyant outlook as the drag from the mining states subsides.
- While our slowing global growth outlook will impact confidence and the terms of trade, China's policies around addressing pollution have boosted demand for LNG and high quality Australian iron ore, disturbing the "normal" relationship between global growth and Australia's key commodity exports.
- The stronger current growth will boost the finances of governments, both state and federal. That will allow governments to continue to pursue their expansionary spending and investment programs and may stimulate a lift in Federal Government spending plans as the parties vie for popular support.
These revised growth forecasts do not change our forecasts for monetary policy. We still expect the RBA cash rate to remain on hold through to the end of our forecast horizon – 2020.
The key here is that following a 2.4% growth rate in 2017, the economy will only register a single above potential growth performance before slowing back to slightly below potential in 2019 with a modest above potential lift in 2020.
There is unlikely to be much sustained progress in closing the output gap and delivering higher wage and price inflation outcomes.
The week that was
June quarter GDP for Australia was our focus this week. It offered a positive surprise versus expectations, and will provide the RBA with comfort regarding the outlook.
In terms of headline GDP, the 0.9% gain for Q2 2018 was 0.2ppts above the market's expectation. See the essay above for the impact on our forecasts.
Within the GDP detail, clearly evident was the importance of population growth to aggregate momentum. Note that against the 3.4%yr outcome for GDP overall, GDP per capita was much weaker at 1.8%. Albeit materially above the post-GFC per capita average of 1.1%yr, it is (in contrast) well below that experienced between 1993 and 2007 (2.5%yr). This strength in population growth helps explain two key aspects of our aggregate growth story: the need for strong public investment; but also the subdued consumer.
Public (government) demand has been surging for over three years now, as state governments sought to catch up on investment that should have already occurred while population growth continued to run well ahead of historical norms. Unsurprisingly, where population growth has been strongest, so too has public demand. Against growth of 4.8%yr for the nation overall, in Victoria it has risen 8.1%yr. At the other end of the spectrum is South Australia, where public demand is currently down 2.6%yr. Importantly for the outlook, the national pipeline of projects is large and growing. Victoria and NSW will continue to drive aggregate activity, but other states are now also coming to the party – Queensland being the prime example. Population growth and government spending also have flow-on benefits for private sector investment, particularly the construction of new health; education; and short-stay accommodation facilities as well as offices. Victoria is again the prime example, with private non-residential construction and infrastructure work up 12%yr and 14%yr respectively.
Turning then to the subdued consumer. Population growth typically offers great opportunities to the existing population as activity and employment increase. However, if the rate of per capita growth is not sustained, then total income has to stretch further. Notable in Q2 2018 was that compensation per employee rose just 0.1%, keeping annual growth at a soft 1.8%. Significantly, the non-mining states (where activity and employment growth has been strongest) have seen a moderation in wage/ salary growth of late. Incorporating the other components of household income, and taking inflation into consideration, we are left with annual real household income growth of just 1.6% over the past 12 months, following no net gain for the past six months. These outcomes explain why the savings rate has fallen to just 1.0%, a level we have seen breached rarely and only briefly. It is not surprising then that consumer spending remains sub-par, both in aggregate and per capita terms.
Looking ahead, the RBA expects momentum to remain robust, forecasting growth "a bit above 3 per cent". This view is predicated on the unemployment rate continuing to trend down to around 5% and improving wage growth, both of which would support stronger consumption growth and associated business investment. We have doubts over employment and wages growth, and are also mindful of a potential negative wealth effect from house price declines. Further, for housing investment, financial conditions have clearly tightened, reducing demand for new construction. Albeit only to July, the latest retail sales detail highlights considerable uncertainty around consumer spending as we move into the second half, with tentative signs of spill-overs from the decelerating housing market. If sustained, this trend will weigh further on retail sector profits and these businesses' willingness to invest and employ.
Elsewhere in the world this week, PMI data was the focus. For the US, it was unequivocally strong. Most notable was the ISM manufacturing survey at a 14 year high on broad-based strength. For China, while external demand has softened, domestic orders have held up well, particularly given the marked deterioration in investment growth. Important for aggregate activity, employment growth has also shown resilience. Indeed, the official NBS PMI's have reported an acceleration in employment growth of late (though we must caution that the Caixin measures, which focus on smaller firms, have reported the opposite). In the rest of the Asian region, India and Indonesia were shown to be carrying strong momentum at June as they come face to face with multiple headwinds related to emerging market capital flight; consequent monetary policy tightening; and the ill effects of higher inflation on discretionary household incomes. The region has a bumpy road ahead of it, but structurally speaking, they are well placed to weather the storm. Speaking of which, the coming week is likely to see an announcement made by the Trump administration on the next round of tariffs (on $200bn of imports from China). Ahead of this, China has again emphasised they will respond to any intensification of hostilities.
Chart of the week: Financial Accounts
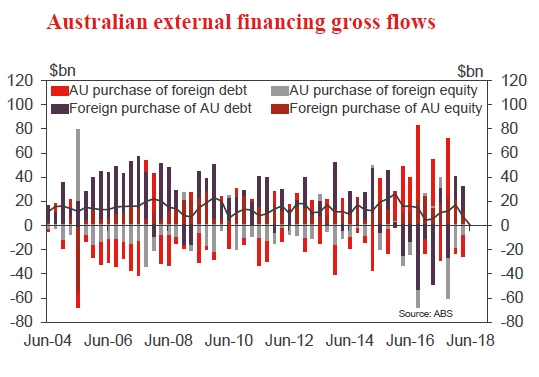
Ahead of GDP, we also received an update on foreign investment in Australia. The key theme from this release remains the strength of direct investment into Australia. Despite the mining investment boom having well and truly ended, foreign investors continue to show strong interest in Australian assets – from individual office buildings to listed companies. Interestingly, as these current investments typically involve the purchase of existing assets, the funds that are flowing into Australia are in the form of equity capital. Highlighting this, new loans from foreign parents represented just 2% of direct investment in 2017 and 2018-to-date compared to over 20% between 2014 and 2016. Apart from direct investment, Australian firms appetite for debt financing from offshore also remains limited. The past year has seen Australian corporates raise $12bn offshore to fund domestic operations; however this follows a $15bn reduction in the stock between Q2 2015 and Q2 2017.
New Zealand: week ahead & data wrap
Quiet achievers
The drivers of New Zealand's economic growth are changing. As construction, population growth and the housing market retreat, other sectors are stepping up. One of these is the external sector. New Zealand's terms of trade is back within reach of its late-2017 record high on the back of strong prices for commodity exports. Recent data shows services exports have also been stronger than previously reported. The buoyant export sector is supporting growth prospects in many regions, as outlined in our recent Regional Roundup report.
New Zealand's external sector is stepping up to the plate as previous drivers of New Zealand's economic growth start to slow. As evidence of this, New Zealand's terms of trade – the ratio of New Zealand's export prices to import prices – rose by 0.6% in the June quarter. Export prices were up 2.4% in NZ dollar terms in the quarter, with higher prices almost across the board for New Zealand's main commodity exports. The 1.7% lift in import prices was propelled by a 10% jump in oil prices and a small drop in the exchange rate.
While the export story remains a strong one, this could be as good as it gets for the terms of trade for a while. Key commodity prices have moderated in recent months, most notably dairy prices. The recent run of soft GlobalDairyTrade auctions continued this week, with the headline GDT price index edging 0.7% lower. On this measure, dairy prices have fallen around 13% since the start of the local 2018/19 dairy season. The weaker New Zealand dollar has only partially offset the impact of these falls on farmgate prices.
For our part, an expectation of softer dairy prices over the second half of 2018 has underpinned our $6.50 milk price forecast for some time. In contrast, Fonterra has taken longer to come around to this view, only downgrading its milk price forecast last week. We still think Fonterra's new $6.75 (previously $7) milk price forecast is too optimistic. Indeed, we are wary of the downside risks to our own $6.50 forecast, which is contingent on whole milk powder prices remaining around current levels before improving gradually in the New Year. Further falls in whole milk powder prices from here would have us reassessing this outlook.
Yet New Zealand's export sector is no longer all about commodity exports. Tourism is booming, the international education market has grown strongly of late and business services (including the likes of ICT, intellectual property services and financial intermediation services) has expanded as technological developments have helped alleviate New Zealand's geographic disadvantage. These quiet achievers really should have been enjoying star billing in recent years.
Indeed, Stats NZ data released this week showed this was the case to an even greater extent than we previously thought. New Zealand's exports of services have been revised significantly higher. Most notably, the annual update of international student spending was stronger than anticipated. In addition, Stats NZ is now capturing spending by visitors on cruise ships in its data. This, combined with other changes, has led to exports of services being revised up as far back as 2013. Where it has its maximum impact, the changes add an additional $1bn to exports of services in the March 2017 year.
Not only does that mean the external sector was doing even better than we gave it credit for in recent years, it also means our external accounts are in an even healthier position than we previously thought. The new data implies an improvement in New Zealand's current account in the order of 0.3% of GDP at the height of its impact, meaning NZ's current account deficit probably improved to 1.9% of GDP in 2016.
The flip side of the terms of trade is import prices, not least oil. Oil prices have exceeded expectations in recent months in part due to supply disruptions in Venezuela and Angola. Other OPEC producers have declined to step in and fill the void to date, meaning tighter supplies and higher prices. We still expect prices will moderate next year, as supply from other oil producers including the US increases, but we think this change will happen more slowly than previously envisioned. That has important implications for our CPI forecasts. After updating for this new oil price outlook, we now expect inflation at the end of next year will be 1.6% (previously we were forecasting 1.3%).
The strong performance of the external sector has also been reflected in differences in activity amongst regions, as highlighted in our recent Regional Roundup report1. In general, activity levels in the major metropolitan regions have been more subdued than those in rural regions, a trend that continued in the latest quarter. Most notably, regional economic confidence (how surveyed households view prospects for their own region over the year ahead) was the weakest in Auckland as the pace of growth in the region slowed. With the housing market in Auckland likely to be hardest hit by government policy changes aimed squarely at investors, the region is also likely to remain more subdued going forward than other parts of the country.
In contrast, traditional tourist hot spots, particularly those with significant exposure to the high flying horticulture sector, such as the Bay of Plenty, Otago and Gisborne/Hawke's Bay continue to be amongst the most buoyant parts of the country. Add to that prospects for a lift in regional investment on the back of the launch of the Government's Infrastructure Growth Fund and it's likely that the regions will continue to outperform metropolitan areas even as the overall pace of growth slows right across the country.
Data Previews
Aus Q3 AusChamber-Westpac business survey
- Sep 11, Last: 63.8
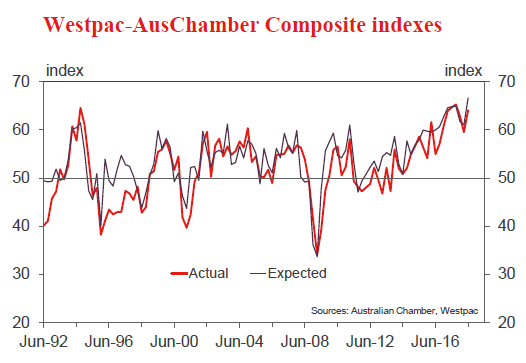
The Australian Chamber-Westpac survey of the manufacturing sector provides a timely update on conditions in the sector and insights into economy-wide trends. The Actual Composite tracks a range of demand related measures including investment and employment. The Q3 survey was conducted in August and into September.
In Q2, the Actual Composite rose to 63.8 from 59.4 in March. Strength is centred on a lift in new orders and output as well as increased. However employment moderated in June.
Manufacturing is benefitting from a rise in public infrastructure, non-mining business investment, and above par world growth with a relatively low AUD. However, there are likely to be spill-over effects from the drought in NSW and Queensland.
Aus Sep Westpac-MI Consumer Sentiment
- Sep 12 Last: 103.6
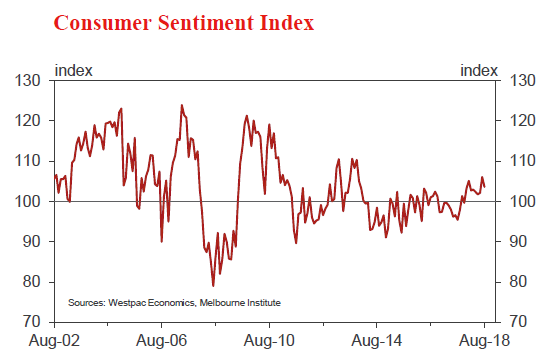
The Westpac Melbourne Institute Index of Consumer Sentiment declined 2.3% to 103.6 in August from 106.1 in July. The move gave back about half of the solid gains seen in June and July which look to have been partly a positive response to the tax cuts announced in the May Budget. The August reading was still positive overall, 5.5% above the average in 2014 to 2017 and the ninth successive month that above the 100 level, indicating optimists outnumber pessimists.
The Sep update may end that run. The survey is in the field from Sep 3-8 and is likely to be influenced by: the leadership change that saw a new PM announced in late August; and mortgage rate increases, with three of the four major banks lifting standard variable mortgage rates by 14-16bps. Continued slippage in house prices and financial markets – the ASX down 1.9% and the AUD down 1.6c vs the USD since the last survey – may also weigh on sentiment.
Aus Aug Labour Force Survey –Employment '000
- Sep 13, Last: –3.9k, WBC f/c: 18k
- Mkt f/c: 18k%, Range: -10k to 35k
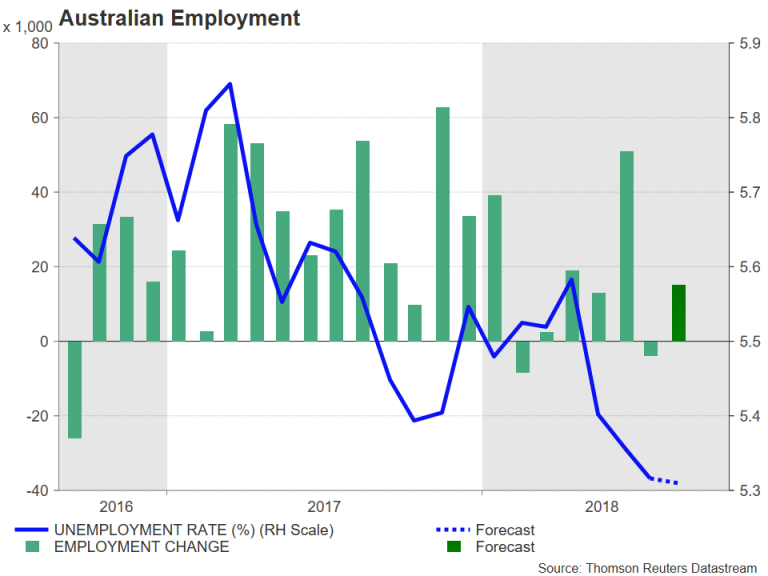
Employment fell –3.9k in July coming in below market consensus expectation of +15k and met Westpac's forecasts for –5k. The full-time employment recovery continued with a +19.3k gain in July (following +43.2 in June) while parttime fell –23.2k (it printed +15.0k in June). Hours worked increased by 0.2% in the month, which following on from the 0.6% lift in June, took the annual pace to 2.3%yr from 1.7%yr in June.
In July, the incoming rotation group has an employment to population ration lower than the group it replaced but on par with the sample as whole. We expected this and is why, in part, we forecast a small number. In August, the group rolling out is more like the sample overall so we will not speculate this month on the possible impact of sample rotation.
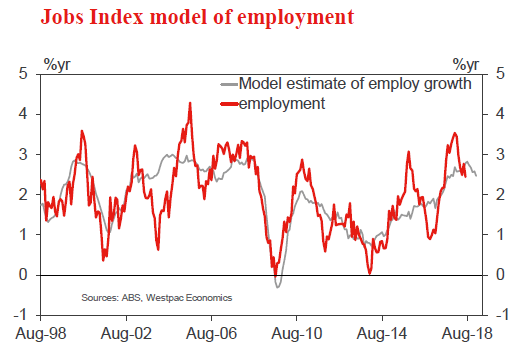
Our Jobs Index model suggests that labour demand may have eased but it still at a robust level. As such, we have forecast an around trend 18k for August.
Aus Aug Labour Force Survey –Unemployment %
- Sep 13, Last: 5.3%, WBC f/c: 5.3%
- Mkt f/c: 5.3%, Range: 5.2% to 5.5%
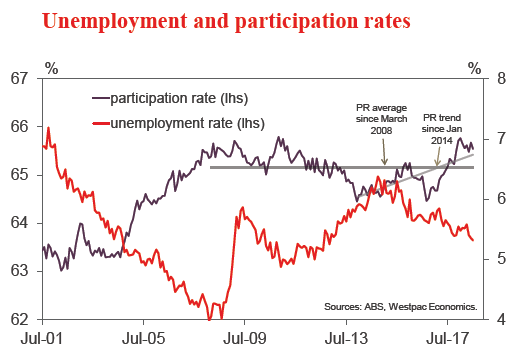
In the July Labour Force Survey, the fall in employment combined with fall in the participation rate (mostly due to the group rolling in being less attached to the labour force than the group rolling out) to 65.54% from 65.68% driving a –9.6k decline in the labour force.
As the decline in the labour force was slightly larger than the drop in employment, the unemployment rounded down to 5.3% (5.32%) from 5.4% (5.35%). So while it was reported a fall in unemployment, a 0.02ppt change as best described as flat.
Westpac's forecast for an around trend rise in employment of 18k, and with the participation rate rounding up to 65.6%, will see the unemployment rate hold flat at 5.3%.
NZ Aug retail card spending
- Sep 11, Last: +0.7%, Westpac f/c: +0.5%, Mkt f/c: +0.5%
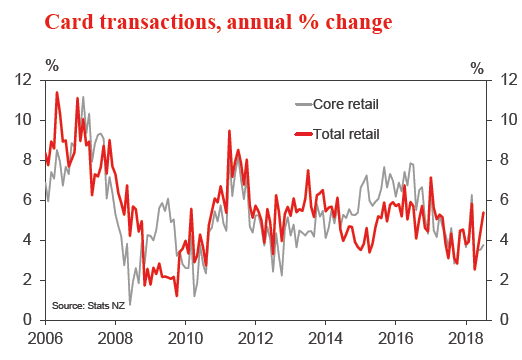
Retail spending levels rose by 0.7% in July, underpinned by increased spending on consumables (e.g. groceries), as well as an increase in fuel prices. Spending levels have been boosted by the Government's Families Package, which has added to the disposable incomes of many households.
We expect a 0.5% increase in retail spending in August. However, with fuel prices pushing upwards, core spending growth is expected to be more modest at around 0.3%. Increases in disposable incomes are adding to spending in some areas like consumables. But at the same time, the continuing slowdown in the housing market is dampening spending on items like household furnishings.
NZ Aug house sales and prices
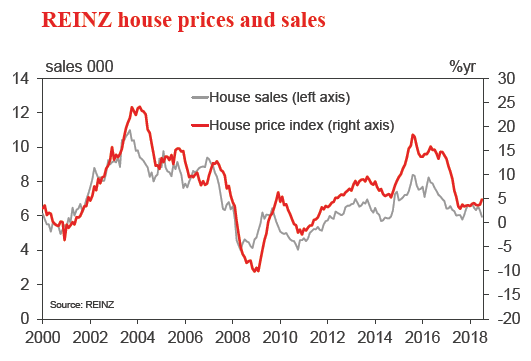
- Sep 14 (tbc), Sales last: -5.7%, Prices last: 4.9%yr
The housing market has generally been soft in recent months. Nationwide house sales have slowed, and prices in Auckland have drifted lower. However, prices continue to rise in most of the rest of the country, and there were signs that they gathered pace in July.
The outlook for house prices is caught between the Government and the RBNZ. Restrictions on overseas buyers were passed into law last month, and will take effect shortly. On the other hand, the RBNZ's statement that it is nearer the trigger point for reducing the OCR has led to a drop in mortgage rates, which may already be giving some life to the market. • We expect nationwide average house prices to remain fairly subdued over the remainder of the year, with Auckland underperforming the rest of the country due to the greater impact of investor restrictions.
UK Sep Bank of England policy decision
- Sep 13, Last: 0.75%, WBC f/c: 0.75%, Mkt f/c: 0.75%
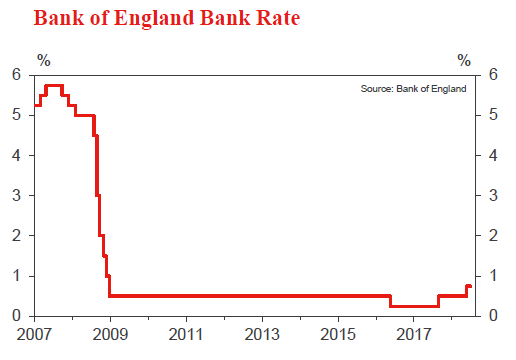
August saw the Bank of England raise the Bank Rate by 25bps to 0.75%. The BoE also maintained its very modest tightening bias, reiterating that future increases are likely to be "at a gradual pace and to a limited extent". But despite the increase in the Bank Rate, the BoE's discussion and comments from Governor Carney actually struck a mildly dovish tone.
With inflation contained, growth moderate, and Brexit casting a very long shadow over the economic outlook, the BoE is set to stand pat for an extended period. We expect no change at the September meeting. The accompanying statement is likely to retain the very gradual tightening bias from August, but more weight may be given to uncertainties around the economic outlook.
EA Sep ECB policy decision
- Sep 13, last –0.40%, WBC –0.40%
The ECB used the June policy meeting to affirm their forward guidance into 2019. It is very likely that the September meeting will continue the current stance with only minor changes to their activity forecasts.
In June, we were told that asset purchases will be tapered again from October before ending completely in December, and that interest rates are on hold until the end of next summer. Still-low core inflation and a continued reduction of slack in the labour market backs up this stance.
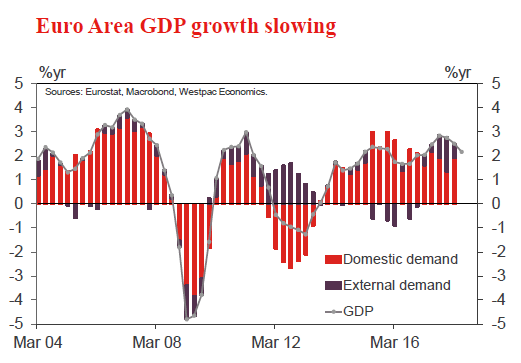
Since July's meeting, GDP growth printed at 0.4% in Q2, following Q1's 0.4% growth. Yet it is still a bit low relative to the ECB's 2.1% 2018 forecast, reflecting a faster than expected easing from 2017's brisk 2.5% year average pace as the boost from external demand fades.
In September, the ECB are likely to slightly reduce their growth forecast, but their view for unemployment and core inflation remains intact and consistent with June's guidance.
US Aug CPI and retail sales
- Sep 13, CPI, last 0.2%, WBC 0.3%
- Sep 14, retail sales last 0.5%, WBC 0.5%
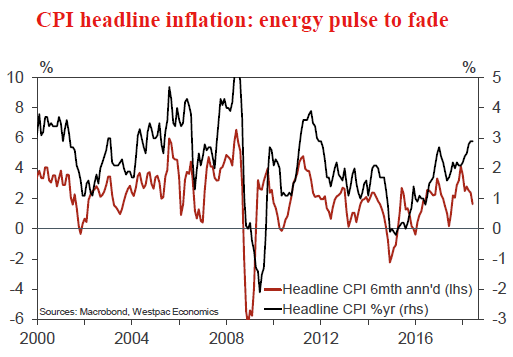
US inflation continues to print largely as expected, holding at its recent highs well above the FOMC's 2.0%yr inflation target. Of late, energy and rents have remained key supports, so too base effects from 2017's one-offs.
In Sep, energy will again be a factor, resulting in a 0.3% gain for headline prices against core inflation's 0.2%. As 2018 winds down, CPI inflation will tend towards (but remain above) 2.0%yr, bringing these measures back into line with the less volatile PCE measures.
On retail sales, Jul saw a bounce back in spending albeit only after Jun was revised down. Another 0.5% gain is anticipated in Aug. Spending should be broad based, though increasingly autos are a risk given the effect of higher interest rates.
Week Ahead – ECB and BoE Meet But No Fireworks Expected; China Data, Aussie Jobs and US Inflation Eyed...
Monetary policy will be back in focus next week as the European Central Bank and the Bank of England hold policy meetings. However, with both central banks expected to stick to their existing outlook, investors will likely turn to data for fresh direction. The highlights will include employment reports out of Australia and the United Kingdom, US inflation and retail sales figures, and key Chinese economic indicators. GDP numbers from the UK and Japan should also attract attention.
Chinese data could further pressure the aussie
Upbeat numbers on second quarter economic performance failed to do the Australian dollar any favours during the past week as RBA rate hikes look no nearer after the data. Ongoing trade uncertainty has also been weighing on the aussie and there could be more downside pressure for the currency should data from China point to a hit to the economy from the US tariffs. First out of China are the producer and consumer price indices on Monday. The producer price index (PPI) is seen as a good barometer for demand for raw materials and so an expected drop in the annual PPI rate from 4.6% to 4% in August would not bode well for market sentiment. On Friday, figures on industrial output, investment in urban areas and retail sales are published. Retail sales are forecast to moderate slightly in August, but industrial output and investment are expected to grow at the same pace as in July.
Moving to domestic data for the aussie, the NAB business conditions survey for August on Tuesday and the Westpac consumer sentiment gauge for September on Wednesday could provide some support if the numbers signal a steady third quarter outlook. But of more importance will be Thursday’s employment report. The Australian economy is forecast to have added 15k jobs in August after unexpectedly shedding 3.9k jobs in July. The jobless rate is projected to hold steady at 5.3%. A solid set of jobs figures could help put a floor to the aussie’s downslide.
Japanese growth could be revised up
Second quarter growth in Japan will likely be revised up to an annualized rate of 2.6% on Monday as quarterly capital expenditure data released this week showed business spending surged by an impressive 12.8% year-on-year during the period. The preliminary GDP estimate of 1.9% annualized growth was already above forecasts and an even stronger reading could boost the yen amid sluggish growth elsewhere (bar the United States). Later in the week, the focus will turn to the current quarter as corporate goods prices for August are due on Thursday, along with machinery orders for July. Also to watch is the revised industrial production number for July on Friday.
No surprises expected from ECB
The European Central Bank meeting on Thursday will undoubtedly be the highlight of the week for many euro traders even if nothing new is being anticipated from President Mario Draghi when he speaks at the subsequent press conference. The bank has already set its path for monetary policy for at least until summer 2019 and it would take a significant deterioration or improvement in economic conditions for policymakers to alter course. However, the meeting will still be watched closely as new quarterly staff projections will be published that could reveal some changes to the bank’s growth and inflation forecasts for the Eurozone for the next 2-3 years.
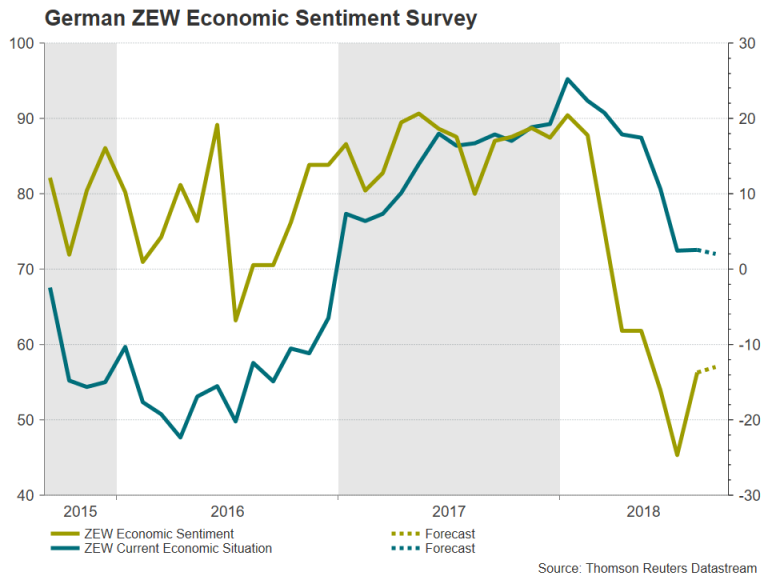
The euro could see some knee-jerk reactions to remarks by Draghi or to revised economic projections, but its medium-term picture will depend on incoming data. So far, there’s little evidence that growth in the region is picking up speed and Monday’s Eurozone sentix index and Tuesday’s ZEW economic sentiment survey for Germany aren’t expected to change that view. The ZEW economic sentiment index is forecast to increase slightly from -13.7 to -13.0 in September. On Wednesday, euro area industrial production figures for July are due, while on Friday, quarterly labour cost data will show whether there’s been any acceleration in Eurozone wage growth in the second quarter.
Bank of England meeting could be non-event
The pound posted a modest recovery in the past week on reports that the UK and the EU are close to resolving the remaining sticking points in the withdrawal agreement. Brexit-related headlines are set to intensify in the coming weeks as we approach the informal summit of EU leaders on September 20 ahead of the crucial European Council meeting on October 18-19, which is seen as the deadline for finalizing the divorce terms. But economic data will also be making the headlines in the coming week as a number of key releases are due out of the UK.
Starting with Monday, monthly output figures on industry, manufacturing and services will be released together with the latest GDP estimates and trade figures. Manufacturing output rebounded towards the end of the second quarter after contracting sharply between February and April. The sector is expected to have recovered further in July, with production rising by 0.2% month-on-month, while overall industrial output is thought to have expanded by 0.2% as well. Investors will also be able to look at the monthly GDP estimates for July for a wider gauge of the economy. The UK economy is forecast to have grown by 0.2% m/m in July, which would produce an annual figure of 1.4%. If confirmed, it would indicate a sound start to the third quarter.
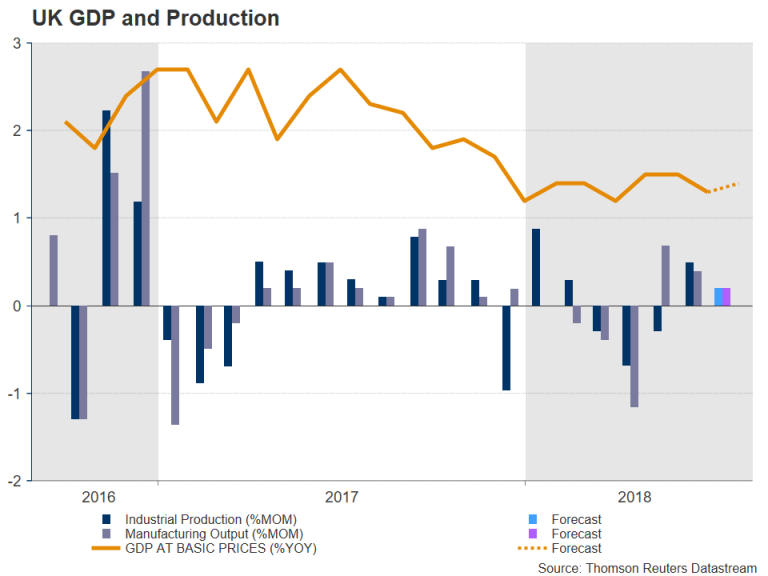
The barrage of data will continue on Tuesday with July jobs numbers. In the three months to June, jobs growth fell to its slowest since October 2017, though the unemployment rate edged down to 4.0% – a more than 43-year low. The jobless rate is expected to stay at 4.0% in the three months to July. Wage growth remains subdued, however, with average weekly earnings rising by 2.4% y/y in June, down from 2.8% at the beginning of the year. A further deceleration in wage growth in July could weigh on sterling as it would cast doubt on the need to raise interest rates.
For now, though, the Bank of England will likely keep to its existing guidance of further gradual and limited rate hikes in the coming years when it announces its latest policy decision on Thursday. The BoE last raised interest rates in August, lifting them above 0.50% for the first time since 2009. It is widely anticipated to hold rates unchanged at 0.75% next week. With no press conference and quarterly inflation report at the September meeting, the pound may struggle to get much reaction from the BoE’s decision.
US inflation and retail sales to be eyed
It will be a fairly packed week for US data with inflation, retail sales and industrial output numbers coming under the spotlight. However, none may be able to provide the US dollar with clear direction as trade-related safe-haven flows look set to remain the main driver of the greenback. The week will get off to a slow start with the JOLTS job openings on Tuesday being the only major release. Producer prices for August will follow on Wednesday. But things will only heat up on Thursday with the CPI report. Annual inflation as measured by the consumer price index is expected to ease marginally from 2.9% to 2.8% in August. The core rate is forecast to stay unchanged at 2.4%. While the Fed doesn’t pay too much attention to CPI inflation, it’s still considered a good indicator of inflationary pressures in the US economy.
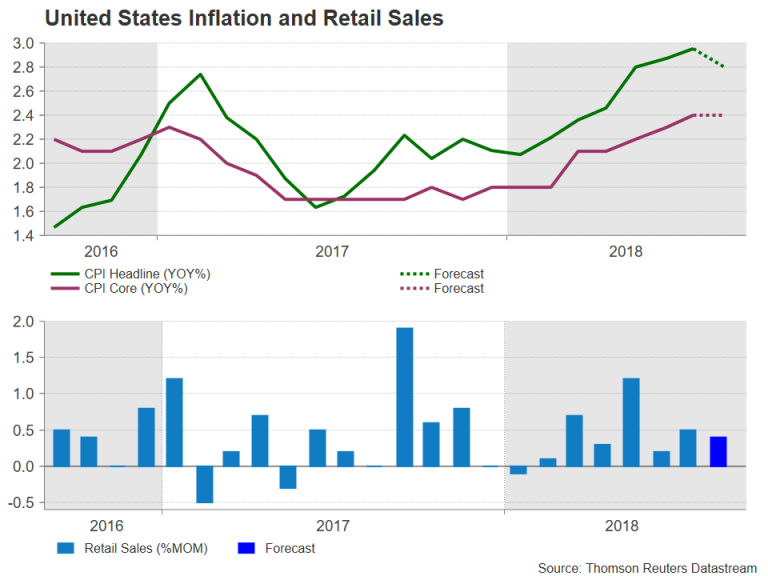
The biggest movers for the dollar though will probably come from Friday’s retail sales, industrial output and consumer confidence data. Retail sales are estimated to continue growing at a healthy pace in August, by 0.4% m/m, moderating slightly from the prior 0.5%. Industrial production is forecast to post a third straight month of gains in August, rising by 0.3% m/m. Finally, the University of Michigan’s preliminary reading of the consumer sentiment index is expected to see an improvement to 96.5 for September.
Weekly Focus: Will Trump Step Up the Trade War?
Market Movers ahead
- US President Trump to possibly announce US tariffs on an additional USD200bn of Chinese imports next week. Also CPI data will be released (Thu), where we expect 2.3%
- Emerging markets will continue to be in focus, in particular the Turkish central bank meeting where we expect a 300bp hike on the back of the weaker currency and looming inflation pressure.
- Euro area wage growth for Q2 (Fri) will give an indication of the strength of the underlying trend in inflation. Further, the ECB meeting on Thursday is not expected to carry new policy signals and mostly it's a meeting for the feinschmeckers.
- In the UK, the monthly GDP figure for July will give a first indication on how Q3 have fared. We expect a 0.1-0.2% growth (implying 0.3-0.4% q/q). Also, BoE meets on Thursday in a rather uneventful meeting with no updated projections and no press conference.
Global macro and market themes
- Trump is struggling with only two months before the midterm elections.
- European indicators are stabilising.