Sample Category Title
GBP/USD Daily Outlook
Daily Pivots: (S1) 1.2839; (P) 1.2889; (R1) 1.2922; More...
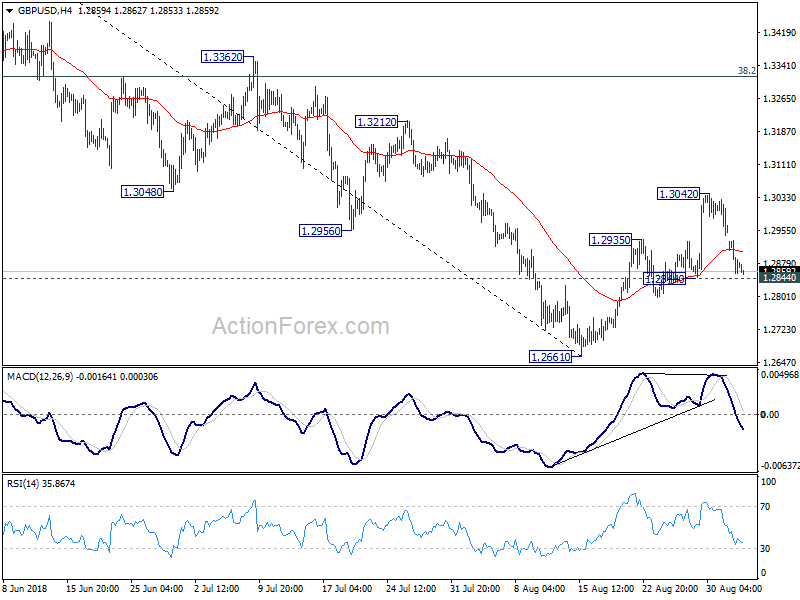
Focus in GBP/USD remains on 1.2844 support. Firm break there will confirm completion of the corrective rebound from 1.2661. In such case, deeper fall should be seen to retest 1.2661. Decisive break there will resume larger down trend from 1.4376. On the upside, above 1.3042 will bring another rise. But upside should be limited by 1.3316 fibonacci level to finish the rebound and bring near term reversal.
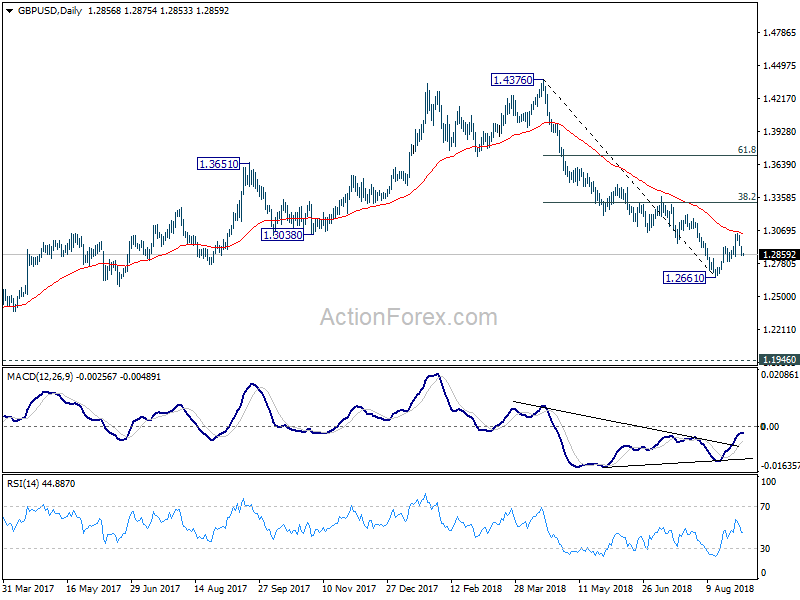
In the bigger picture, whole medium term rebound from 1.1946 (2016 low) should have completed at 1.4376 already, after rejection from 55 month EMA (now at 1.4099). The structure and momentum of the fall from 1.4376 argues that it's resuming long term down trend. And this will be the preferred case as long as 38.2% retracement of 1.4376 to 1.2661 at 1.3316 holds. However, firm break of 1.3316 would bring stronger rebound to 61.8% retracement at 1.3721. And, the eventual depth of the fall from 1.4376, and the chance of hitting 1.1946 low, will depend on the strength of the interim corrective rebound from 1.2661.
USD/CHF Daily Outlook
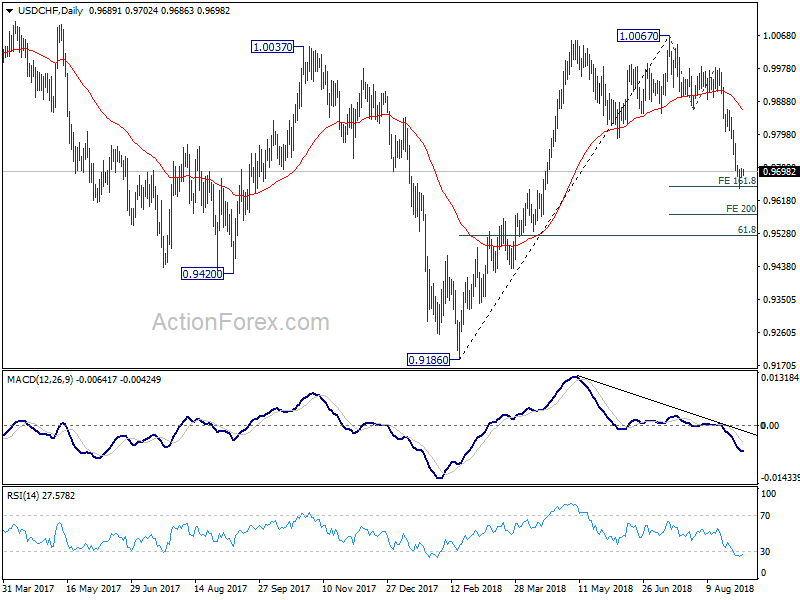
Daily Pivots: (S1) 0.9681; (P) 0.9695; (R1) 0.9706; More.....
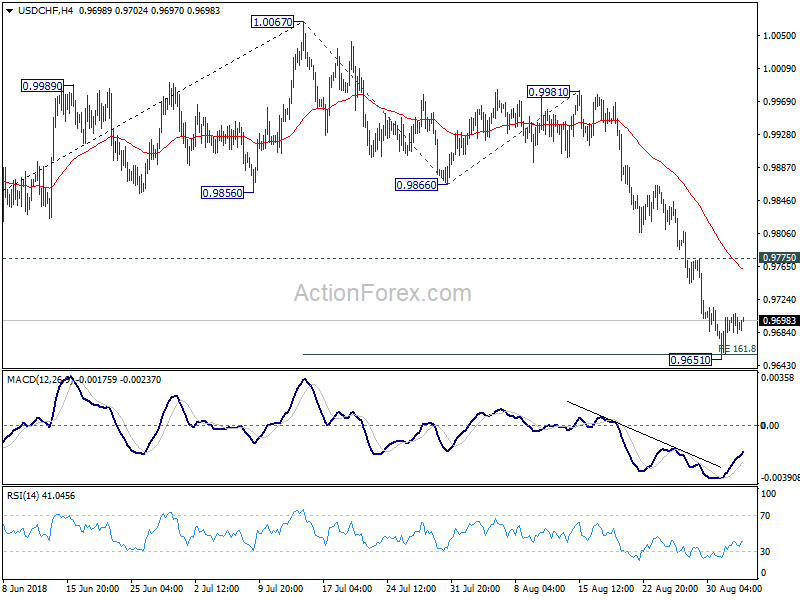
Intraday bias in USD/CHF remains neutral for consolidation from 0.9651 temporary low. Stronger recovery might be seen. But upside should be limited by 0.9775 minor resistance to bring another fall. On the downside, break of 0.9651 will extend the fall from 1.0067 and target 200% projection of 1.0067 to 0.9866 from 0.9981 at 0.8579 next.
In the bigger picture, current development suggests that rise from 0.9186 low has completed at 1.0067, after failing to sustain above 1.0037 resistance. Fall from 1.0067 could extend to 61.8% retracement of 0.9816 to 1.0067 at 0.9523 and below. But for now, we don't expect a break of 0.9186 low. On the upside, firm break of 0.9866 support turned resistance will suggests that fall from 1.0067 has completed and rise from 0.9186 is resuming.
USD/JPY Daily Outlook
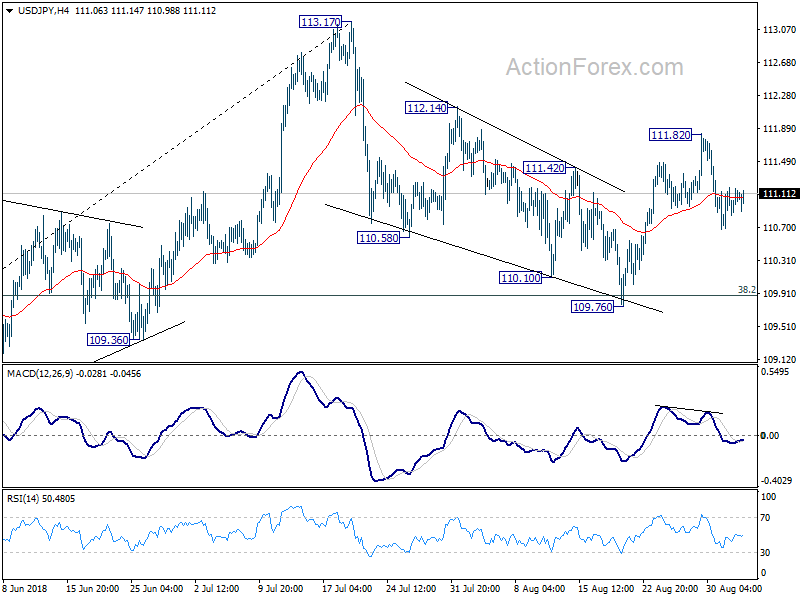
Daily Pivots: (S1) 110.90; (P) 111.04; (R1) 111.25; More...
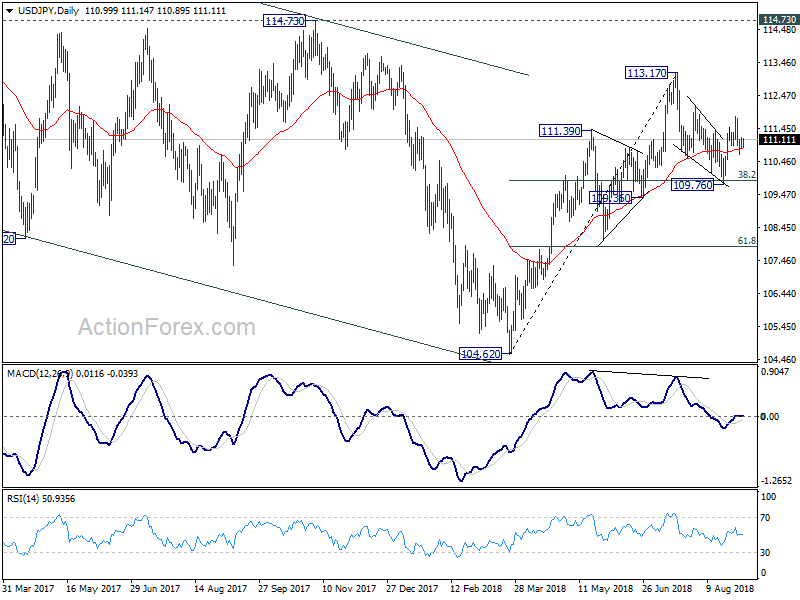
Intraday bias in USD/JPY remains neutral at this point and outlook is unchanged. While deeper pull cannot be ruled out, downside should be contained by 38.2% retracement of 104.62 to 113.17 at 109.90 to bring rebound. Price actions from 113.17 are viewed as a corrective pattern. Break of 111.82 will reaffirm the case that such correction has completed at 109.76. And in that case, further rise should be seen back to retest 113.17 high.
In the bigger picture, corrective fall from 118.65 (2016 high) should have completed with three waves down to 104.62. Decisive break of 114.73 resistance will likely resume whole rally from 98.97 (2016 low) to 100% projection of 98.97 to 118.65 from 104.62 at 124.30, which is reasonably close to 125.85 (2015 high). This will stay as the preferred case as long as 109.36 support holds. However, decisive break of 109.36 will mix up the outlook again. And deeper fall should be seen back to 61.8% retracement of 104.62 to 113.17 at 107.88 and below.
USD/CAD Daily Outlook
Daily Pivots: (S1) 1.3061; (P) 1.3082; (R1) 1.3119; More...
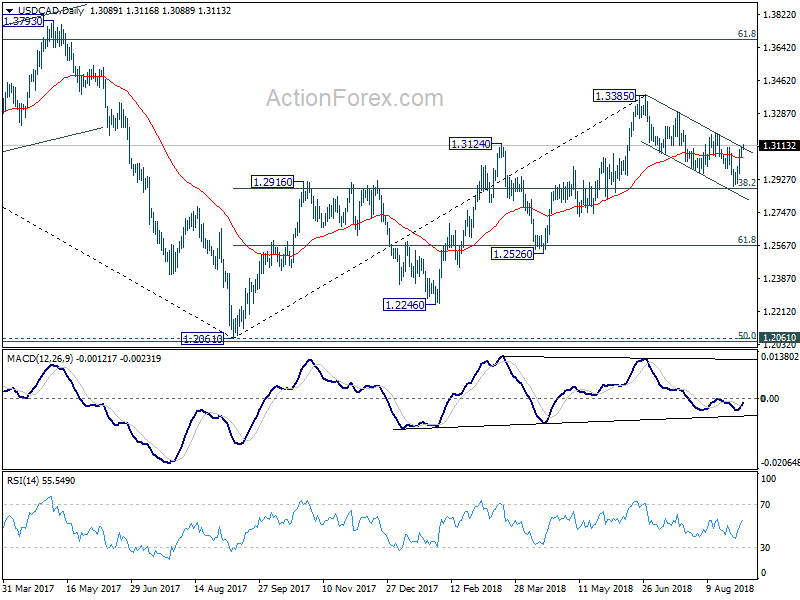
USD/CAD's rebound from 1.2886 extends further to as high as 1.3116 so far and broke near term channel resistance. Intraday bias remains mildly on the upside for 1.3173 resistance. Sustained trading above the channel is the first sign of bullish reversal and break of 1.3173 should confirm. In that case, further rally should be seen back to retest 1.3385 high. On the downside, however, below 1.3019 minor support will turn bias back to the downside for 1.2879 key fibonacci level again.
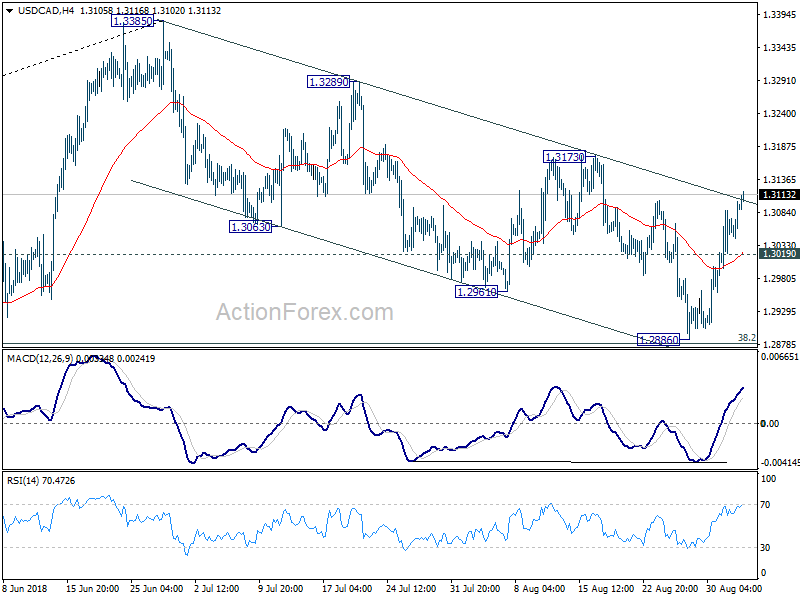
In the bigger picture, focus is now on 38.2% retracement of 1.2061 to 1.3385 at 1.2879. Decisive break there will affirm the case of medium term reversal and target 61.8% retracement at 1.2567 and below. That will also put key long term support at 50% retracement of 0.9406 (2011 low) to 1.4689 (2015 high) at 1.2048 into focus. On the upside, break of 1.3173 resistance will revive the bullish case and target 61.8% retracement of 1.4689 to 1.2061 at 1.3685 and above.
Market Morning Briefing: Dollar Yen Has Stayed Stable Near 111 After Dipping From 111.75 Last Week
STOCKS
Dow (25964.82, -0.085%) is holding below resistance on the 3-day candles. Dow was closed yesterday. As mentioned in the previous edition, Dow could come off towards 25500 before again resuming its rise. Medium term looks bullish while the current downward correction is expected to be short lived.
Dax (12346.41, -0.14%) has support on the daily candles at 12000 and while that holds, the index could bounce back towards 12600-12700 in the near term. Test of 12000 is possible in the next 1-2 sessions followed by the mentioned bounce.
Nikkei (22715.09, +0.034%) is almost stable just now. But while below 23000, there is scope of falling towards 22400 in the near term. Although the weekly line charts looks bullish for the longer term, a dip towards 22400 is likely before the price starts to move up.
Shanghai (2722.26, +0.056%) has moved up a bit but overall trade in the 2650-2750 zone looks possible for the near term.
Nifty (11582.35, -0.84%) broke sharply, below the daily candle support. The resistance on the 3-day candle chart has held well and could turn bearish for the index in the next few sessions. A fall towards 11400 could not be negated in the near term. Dollar-Rupee moved up sharply above 71 towards the close of the session yesterday and while the Rupee weakness continues, Nifty could possibly come off in the near term and limit further upside just now.
COMMODITIES
Brent (78.07) is trading at resistance levels on the daily candle chart and these levels are very important. A break above this, if seen, could take the price higher towards 80 in the near term. Else a rejection from current levels is more preferred with a fall towards 76-75 in the next 4-5 sessions.
Nymex WTI (70.06) is stable but also has resistance in the 70-71 zone. While that holds, a small dip towards 68 is possible. Else the longer term charts look bullish with scope of a break above 71 and a rise towards 74 in the medium term. We wait and watch if a fall in Brent materializes as that could drag the WTI price also within next week.
Gold (1206.70) could trade in the 1200-1230 region with a possible extension to 1190 on the downside. Overall ranged or sideways movement could be seen.
Copper (2.6610) could come down towards 2.60-2.55 in the near to medium term. Immediate view is bearish.
FOREX
After a quiet day yesterday due to holidays in USA, Dollar could begin strengthening against the Euro and the Pound from today's session.It might stay stable to weak against Yen. Dollar Rupee looks bullish towards 71.50-70 if 71.30 is breached.
Euro (1.1598): After seeing a quiet session yesterday (possibly due to holidays in USA), Euro might break below immediate support near 1.16 on 3 day line chart in today's session. Lower support near 1.155 might be tested in the next couple of sessions, followed by a test of 1.15 later in the week/early next week.
Dollar Index (95.25) : After a quiet day yesterday, Dollar Index might rise towards interim resistance near 95.5 in today's session - a breach of 95.5 is preferred in the next couple of sessions , which could thereby lead to levels near 96-97 in the next 1-2 weeks.
Dollar Yen (111.12): Dollar Yen has stayed stable near 111 after dipping from 111.75 last week. It could gradually drop towards crucial support near 110.5. If it breaks that, the 110.0-109.5 zone is also a crucial support zone. Only on a break below 109.5 will we abandon the view of bullishness towards 113 in the next couple of weeks.
Euro Yen (128.89): Euro Yen also stayed stable just below support on daily candles. As mentioned yesterday, it looks bearish towards lower support near 127.5-127.0 in this week. A test of levels near 1.155 by Euro-Dollar and 110 by Dollar Yen in the next couple of sessions implies a target near 127 for Euro Yen.
Pound (1.2861): Pound has dipped below 1.29 again, thereby negating chances of a rise towards 1.31. The break below 1.29 suggests it could be bearish towards support near 1.27 in this week.
Dollar-Yuan (6.8214) has crucial resistance near 6.83-84 and support near 6.80. While above 6.80, the resistance near 6.83 could be breached in the near term.
Dollar Rupee (71.215): Immediate resistance near 71.25-30 and higher resistance near 71.50 (could even extend to 71.70). Next 1-2 sessions look bullish. Correction after 71.50-70 likely (maybe next week).
INTEREST RATES
The Indian 10 year GOI (7.99%) saw a significant rise yesterday, breaking above crucial resistance near 7.95% - it now looks bullish in the near term.
Due to a holiday in USA yesterday, US yields have stayed stable near yesterday's levels. Repeating yesterday's commentary pertaining to US yields: USA and Canada couldnt reach a trade deal by the Friday deadline thereby dampening sentiments slightly. Moreover, there are murmurs that the US could impose trade sanctions worth $200 bn on China sometime this week itself. If that happens, it could be an extremely significant event -the impact on yields should most certainly be bearish, due to an enhancement of the 'risk off' sentiment.
We have been saying that chances of a Dec '18 rate hike have slightly reduced over the past couple of weeks - this could imply that the May high of 3.125% for the US 10 year yield was the year's top.
US 10 Year Yield (2.86%) : A breach above 2.9% would be required to negate the possibility of a downmove below 2.82% in this move. Current preference remains bearish for the near term.
The German-US 10 Year spread (-2.53%) has dipped from resistance near -2.45% and now looks bearish towards -2.6%. The German-US 2 Year spread (-3.22%) has also dipped from resistance near -3.20% and looks bearish towards -3.3% in the near term.
Japan 10 year bond yield (0.12%) is staying below important resistance near 0.13%-0.14% - if this resistance is breached, it would be a very important event and could lead to further bullishness in Japanese yields.
BoE Carney’s future to be asked in inflation report hearing
BoE Governor Mark Carney will appear in the Parliament for Inflation Report hearing today. While his views on the economy and interest rates will be scrutinized as usual, there's another topic to watch. That is, whether Carney will extend his term or not.
The BBC reported yesterday that Treasury is in talks for extending Carney's term once more. Carney, started the job in 2013, originally planned to just serve just five years and has already extended the term once to mid 2019. On the other hand, the government's spokesman James Slack reiterated that "the governor has said that he intends to step down in 2019. That is still the plan,"
To stay or not to stay is definitely a questions to be asked by lawmakers today.
For now, it's uncertain who will succeed Carney. It appears that Andrew Bailey the chief executive of Britain's Financial Conduct Authority and a former BoE deputy governor, is a front-runner. But the government could look abroad again for the candidate.
Reuters poll showed chance disorder Brexit at 25%
According to a Reuters poll conducted between August 29 and September 3, chance of disorderly Brexit stood at 25%, unchanged from a month ago. Opinions were divided as nine of the 34 contributors raised the chance, but four lowered the odds. Highest prediction was 60% chance.
Nevertheless, chance of a recession in the year post-Brexit was seen at 15%, down from July's 20%. Chance for recessions within two year of Brexit was at 25%.
On BoE policies, the poll suggested that the central bank would have a 25bps rate hike soon after March 2019 Brexit date. Then, another 25bps would be added in 2020.
Japan PM Abe to raise retirement age beyond 65
Japan Prime Minister Shinzo Abe said in a Nikkei Asian Review interview that while, BoJ hasn't reached the 2% inflation target yet, Japan is "no longer in deflation". And Abe emphasized "what we are really focused on is employment." He outlined a plan to overhaul the social security system for the new three years.
Abe intend to raise retirement age beyond 65. And he said "more labor participation would boost economic growth, raise tax revenue and generate more social security premium receipts." The first year of his next three year term will focus on labor issues. Pension and medical care system will be tackled in the following two years.
Additionally, Abe pledged to ease the impact of the planned sales take hikes, from 8% to 10% with "bold countermeasures".
He also played down the threats of US trade policy and said "the U.S. and Japan share a broader goal of expanding bilateral trade and investment for the benefit of both countries and achieving a free and open Indo-Pacific based on fair trade."
Abe will compete with former Defense Minister Shigeru Ishiba in a ruling party leadership contest on September 20.
GBP/USD Turns South, Could Test 1.2800 Support
Key Highlights
- The British Pound faced a strong resistance near 1.3050 and declined against the US Dollar.
- There was a break below a major ascending channel with support at 1.2930 on the 4-hour chart of GBP/USD.
- The UK Manufacturing PMI in August 2018 declined from the last revised reading of 53.8 to 52.8.
- Today, the UK Construction PMI for August 2018 will be released, which is forecasted to decline from 55.8 to 54.9.
GBPUSD Technical Analysis
The British Pound traded higher nicely this past week above the 1.2920 resistance against the US Dollar. The GBP/USD pair traded as high as 1.3043 before facing a strong resistance.
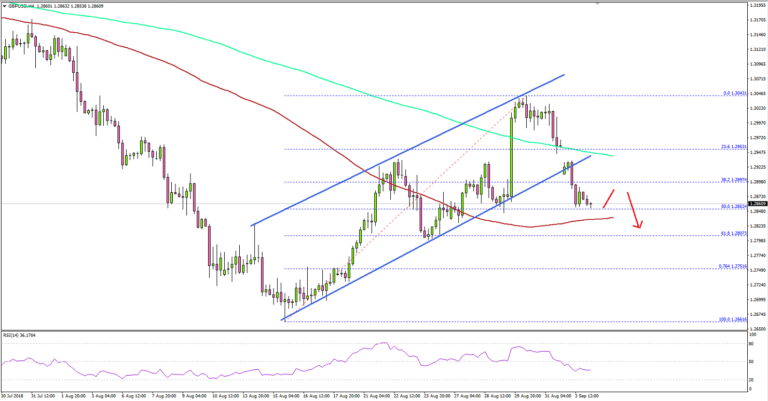
Looking at the 4-hours chart, the pair started a downside move and broke the 1.2950-60 support area. There was also a break below the 23.6% Fib retracement level of the last leg from the 1.2661 low to 1.3043 high.
More importantly, there was a close below a major ascending channel with support at 1.2930 and the 200 simple moving average (green, 4-hours). There are clear bearish moves visible on the chart and if the pair slides below 1.2840 support and the 100 simple moving average (red, 4-hours), it could test the 1.2800 support.
An intermediate support is the 61.8% Fib retracement level of the last leg from the 1.2661 low to 1.3043 high 1.2807. On the upside, the pair is facing the key resistance at 1.2940-50 and the 200 SMA. Only a close back above 1.2950 may perhaps decrease selling pressure on cable in the near term.
Fundamentally, the UK Manufacturing PMI for August 2018 was released by both the Chartered Institute of Purchasing & Supply and the Markit Economics. The market was looking for a minor decline from the last reading of 54.0 to 53.8.
The actual result below the market forecast as the PMI declined to 52.8. Moreover, the last reading was revised down from 54.0 to 53.8. Moreover, as per the report, job creation slowed to near-stagnation.
The GBP/USD pair remained under pressure and if sellers remain in control, the pair could trade towards 1.2800 in the near term.
Economic Releases to Watch Today
- UK Construction PMI for August 2018 – Forecast 54.9, versus 55.8 previous.
- US Manufacturing PMI for August 2018 – Forecast 54.5, versus 54.5 previous.
- US ISM Manufacturing Index for August 2018 – Forecast 57.7, versus 58.1 previous.
Dollar Index Dominates – British Pound Faces More Selling Pressure
Brexit deadlock and the strength of the dollar index is keeping the pressure on the sterling-dollar pair.
In the currency market, the dollar index is on the surge again and it traded mostly near enough to its one week high yesterday. We expect this momentum to continue as investors seek safe haven in the green back. The two currency pairs which do stand in a prominent position are Canadian dollar and the British dollar. The strength of the dollar index is more prominent here and this is because both currencies have some serious issues going on; in Canada, it is about the trade agreement with the US and over in Britain, it is the rollercoaster Brexit ride. It seems like no deal may be a scenario which has more odds stack in its favour.
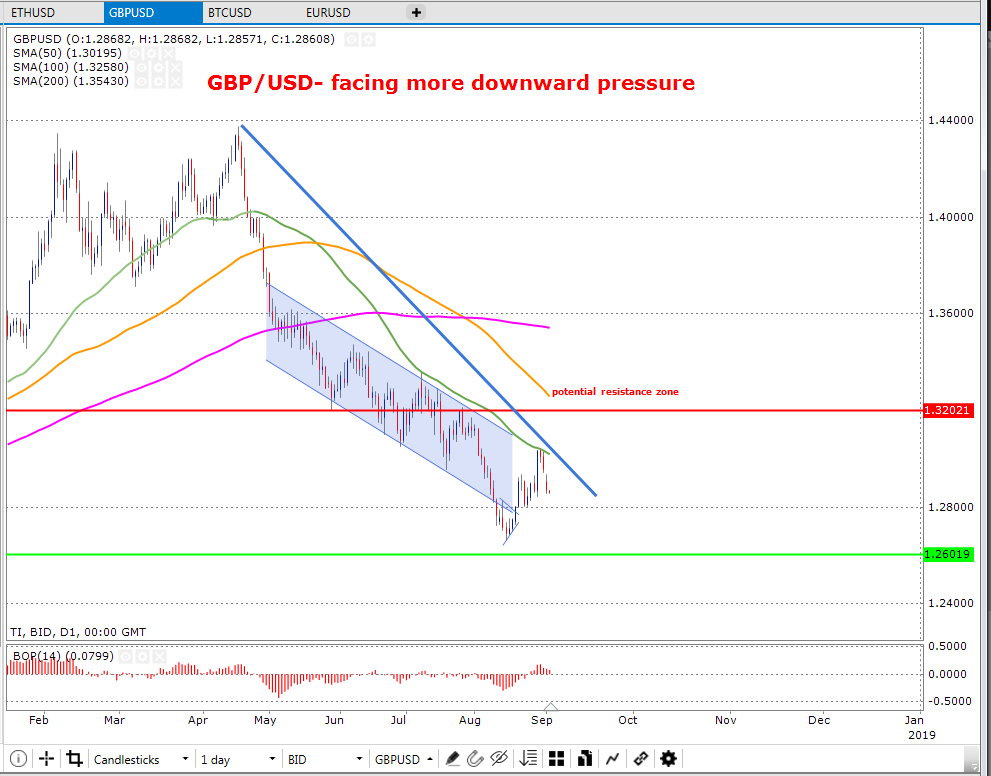
GBP/USD- facing more downward pressure
The chart below on a dily time frame shows that the price failed to break above the 50-day moving average (showin in green). This confirms that the bears are in more control of the price and the further confirmation of the downward trend comes from the fact that the price is trading below the downward trend line. In order for us to have any kind of confirmation that the downward trend may be changing, we need to see the price to break above the 50-day moving average.