

Sample Category Title
EUR/CHF Daily Outlook
Daily Pivots: (S1) 1.1406; (P) 1.1431; (R1) 1.1444; More...
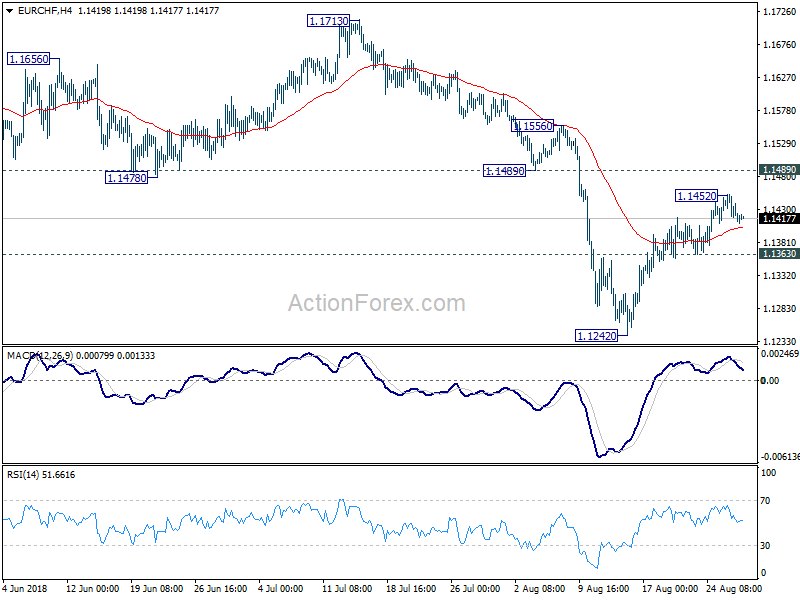
A temporary top is in place at 1.1452 in EUR/CHF with 4 hour MACD crossed below signal line. Intraday bias is turned neutral first. For now, further rise is expected as long as 1.1363 minor support holds. Above 1.1452 will extend the rebound from 1.1242 short term bottom to 1.1489 support turned resistance first. Decisive break there will add to the case of trend reversal ahead of key support zone between 1.1154/98. However, on the downside, below 1.1329 minor support will turn bias to the downside for retesting 1.1242 low instead.
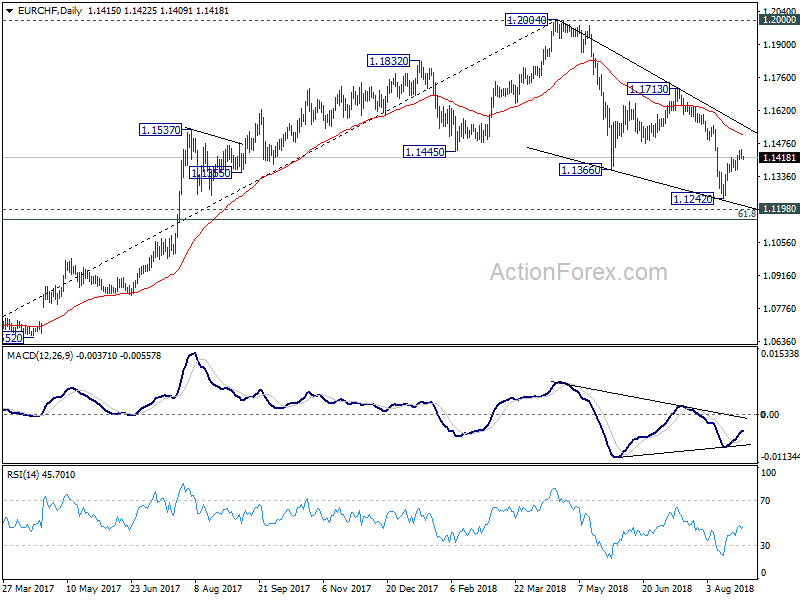
In the bigger picture, for now, the price actions from 1.2004 medium term top is seen as a correction only. Downside should be contained by 1.1198 (2016 high), 61.8% retracement of 1.0629 to 1.2004 at 1.1154 to complete it and bring rebound. This cluster level is in proximity to long term channel support (now at 1.1189) too. A break of 1.2 key resistance is still expected in the medium term long term. However, sustained break of the mentioned support zone will mark reversal of the long term trend.
EUR/USD Daily Outlook
Daily Pivots: (S1) 1.1661; (P) 1.1698; (R1) 1.1732; More.....
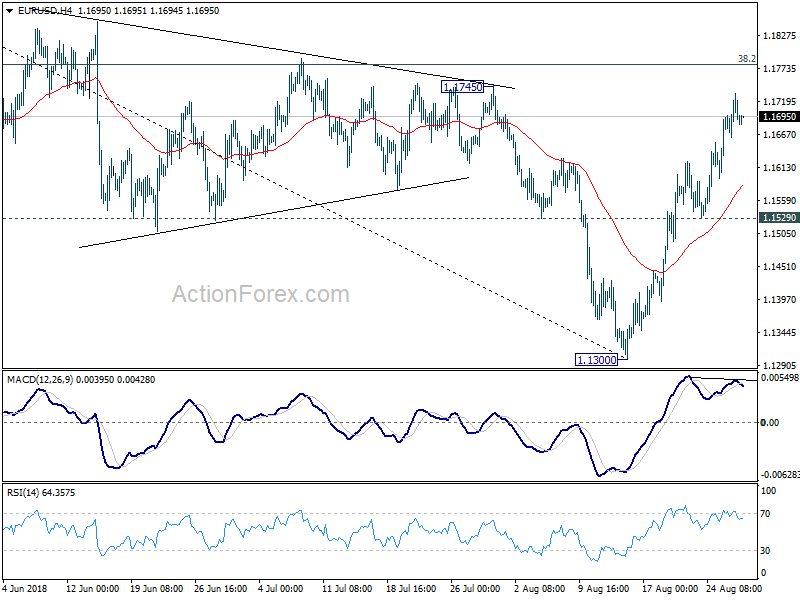
At this point, the rebound from 1.1300 is still in progress and further rise would be seen. But we'd expect strong resistance from 38.2% retracement of 1.2555 to 1.1300 at 1.1779 to limit upside, at least on first attempt, to bring near term reversal. On the downside, break of 1.1529 minor will indicate completion of the rebound and turn bias to the downside for retesting 1.1300 low. After all, consolidation from 1.1300 will extend for a while before completion.
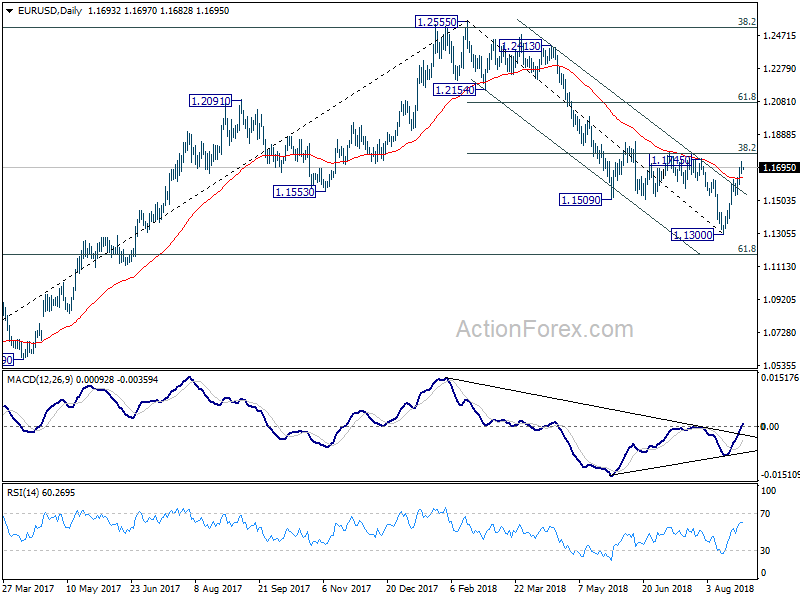
In the bigger picture, a medium term bottom should be in place at 1.1300, on bullish convergence condition in daily MACD and some consolidations would be seen. But still, note that EUR/USD was rejected by 38.2% retracement of 1.6039 (2008 high) to 1.0339 (2017 low) at 1.2516. That carries some long term bearish implications. Thus, we'd expect fall from 1.2555 high to resume after consolidation completes. Below 1.1300 should send EUR/USD through 61.8% retracement of 1.0339 to 1.2555 at 1.1186. And, in that case, EUR/USD would head to retest 1.0339 (2017 low).
GBP/USD Daily Outlook
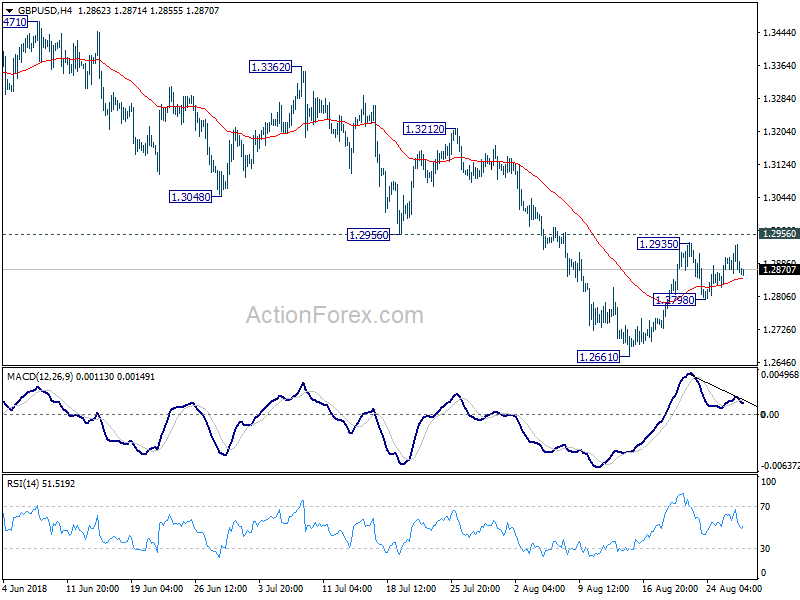
Daily Pivots: (S1) 1.2844; (P) 1.2888; (R1) 1.2914; More...
Intraday bias in GBP/USD stays neutral for the moment. Also, outlook remains bearish with 1.2956 support turned resistance intact. On the downside, below 1.1798 minor support will target 1.2661 low first. Break will resume larger fall from 1.4376. However, considering bullish convergence condition in daily MACD, break of 1.2956 will indicate medium term bottoming. And stronger rebound would be seen back to 55 day EMA (now at 1.3054) and above.
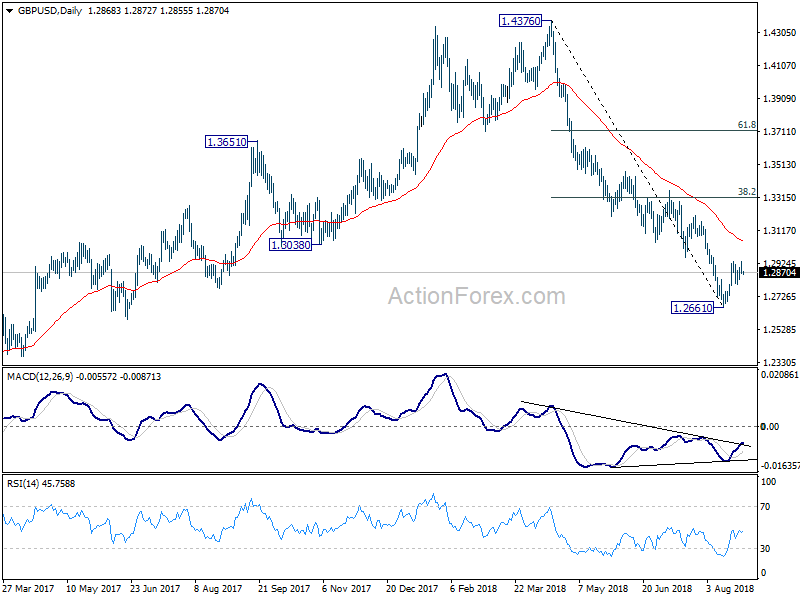
In the bigger picture, whole medium term rebound from 1.1946 (2016 low) should have completed at 1.4376 already, after rejection from 55 month EMA (now at 1.4091). Current downside acceleration argues that it's possibly resuming long term down trend. In any case, outlook will stay bearish as long as 38.2% retracement of 1.4376 to 1.2661 at 1.3316 holds. Retest of 1.1946 should be seen next.
USD/CHF Daily Outlook
Daily Pivots: (S1) 0.9736; (P) 0.9773; (R1) 0.9801; More.....
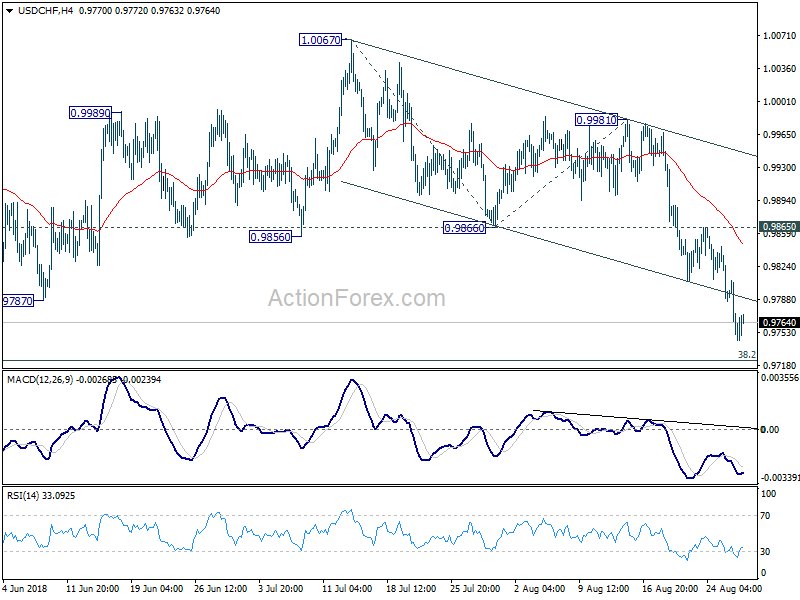
Intraday bias in USD/CHF remains on the downside and current decline should target 38.2% retracement of 0.9186 to 1.0056 at 0.9724. At this point, we're still view price actions from 1.0056 as a consolidation pattern. Thus, downside should be contained by 0.9724 to bring rebound. Nonetheless, break of 0.9865 resistance is needed to indicate short term bottoming. Otherwise, further decline will remain in favor even in case of recovery. Meanwhile, sustained break of 0.9724 will carry larger bearish implications.
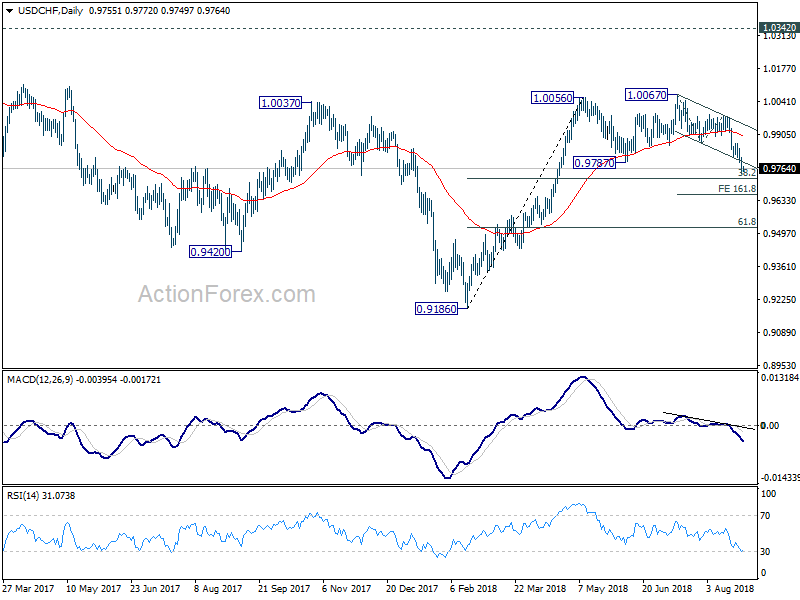
In the bigger picture, current development suggests that the consolidation pattern from 1.0056 is extending. As long as 38.2% retracement of 0.9186 to 1.0056 at 0.9724 holds, we'd expect rise from 0.9186 to resume at a later stage to retest 1.0342 key resistance (2016 high). However, sustained break of 38.2% retracement of 0.9186 to 1.0056 at 0.9724 will at least bring deeper fall to 61.8% retracement at 0.9518 before completion.
USD/JPY Daily Outlook
Daily Pivots: (S1) 110.98; (P) 111.17; (R1) 111.39; More...
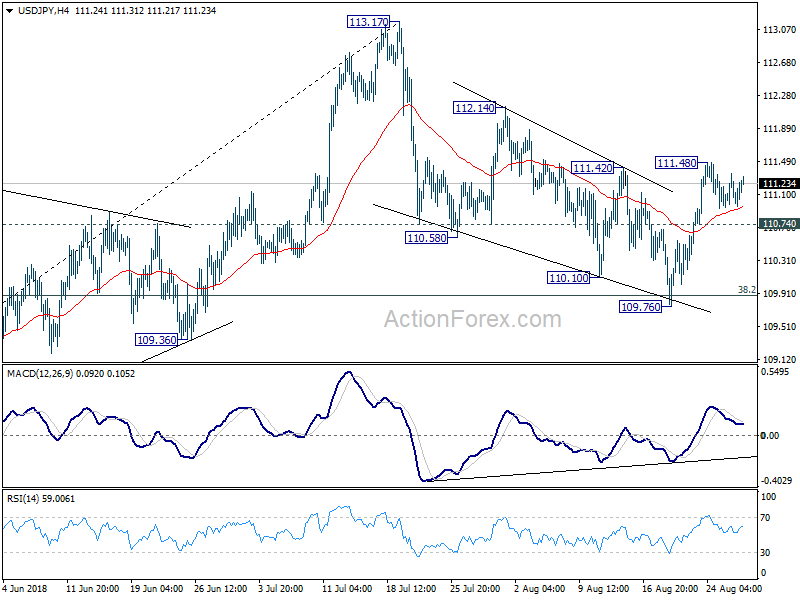
USD/JPY is staying in tight range below 111.48 temporary top and intraday bias remains neutral. We maintains the view that correction from 113.17 should have completed at 109.76 already. Above 111.48 will turn bias to the upside for 112.14. Break will pave the way to retest 113.17 high. Meanwhile, below 110.74 minor support will dampen the bullish case and turn focus back to 109.76 instead.
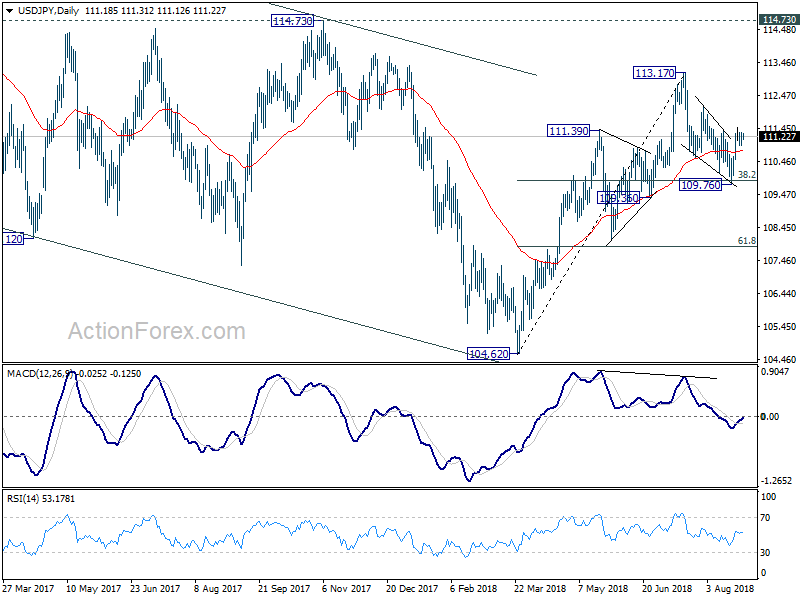
In the bigger picture, corrective fall from 118.65 (2016 high) should have completed with three waves down to 104.62. Decisive break of 114.73 resistance will likely resume whole rally from 98.97 (2016 low) to 100% projection of 98.97 to 118.65 from 104.62 at 124.30, which is reasonably close to 125.85 (2015 high). This will stay as the preferred case as long as 109.36 support holds. However, decisive break of 109.36 will mix up the outlook again. And deeper fall should be seen back to 61.8% retracement of 104.62 to 113.17 at 107.88 and below.
AUD/USD Daily Outlook
Daily Pivots: (S1) 0.7318; (P) 0.7340; (R1) 0.7360; More...
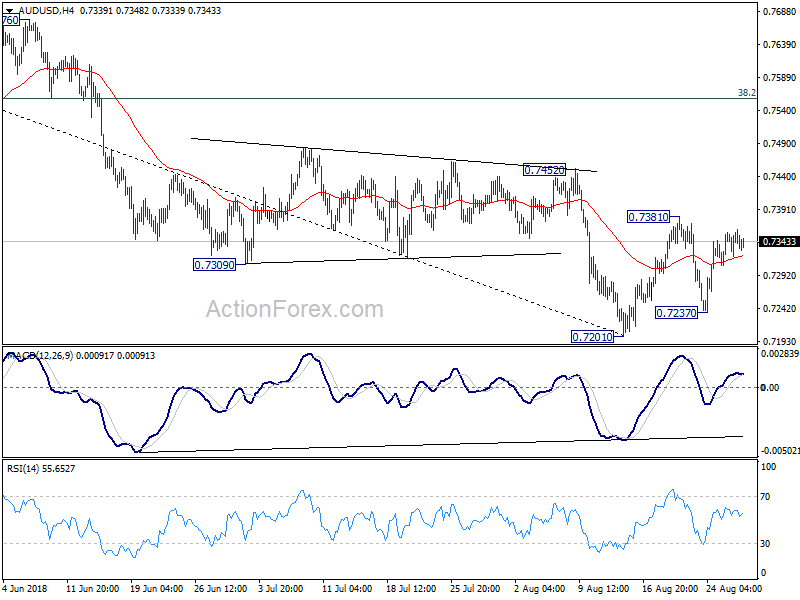
Intraday bias in AUD/USD remains neutral as it's staying in range of 0.7237/7381. More consolidation is likely in near term. In case of stronger rise through 0.7381 we'd expect upside to be limited by 0.7452 resistance to bring larger down trend resumption eventually. On the downside, below 0.7237 will target a test on 0.7201 low first.
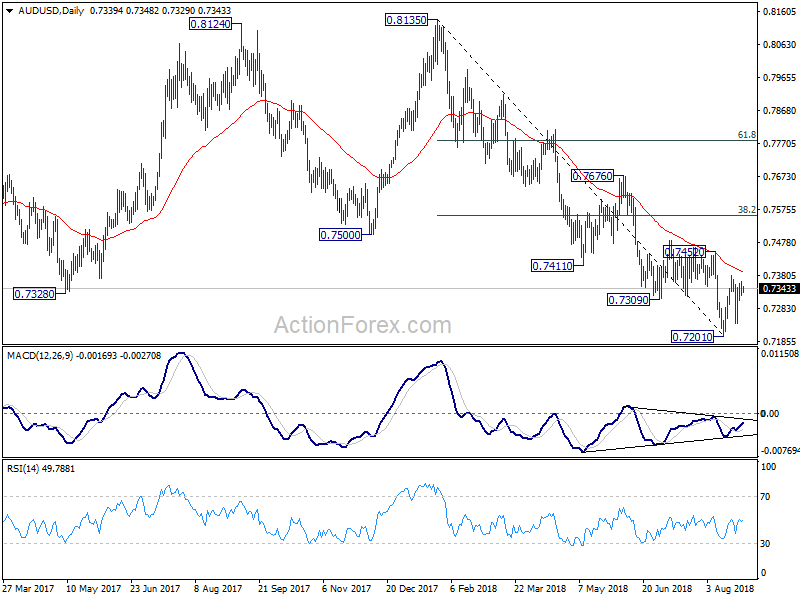
In the bigger picture, rebound from 0.6826 (2016 low) is seen as a corrective move that should be completed at 0.8135. Fall from there would extend to have a test on 0.6826. There is prospect of resuming long term down trend from 1.1079 (2011 high). But we'll look at downside momentum to assess at a later stage. On the upside, break of 0.7452 resistance, however, will indicate medium term bottoming, on bullish convergence condition in daily MACD. In that case, a correction should be seen first, with stronger rebound would be seen to 38.2% retracement of 0.8135 to 0.7201 at 0.7558. The down trend from 0.8135 will resume after the correction completes.
USD/CAD Daily Outlook
Daily Pivots: (S1) 1.2884; (P) 1.2934; (R1) 1.2979; More...
USD/CAD reaches as low as 1.2886 so far and intraday bias stays on the downside. Sustained break of 1.2879 fibonacci level will add to the case of medium term reversal and target next fibonacci level at 1.2567. On the upside, above 1.2981 minor resistance will turn intraday bias neutral first. But for now, near term outlook will stay cautiously bearish as long as 1.3173 resistance holds.
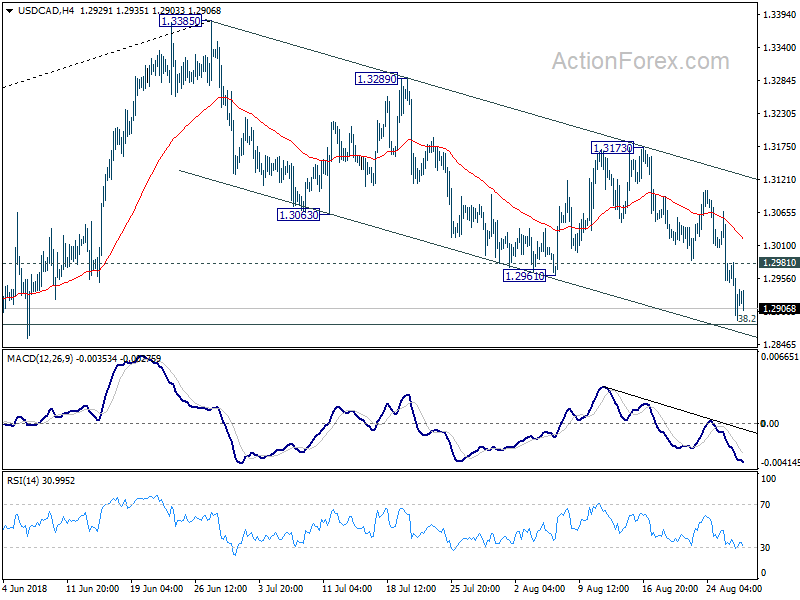
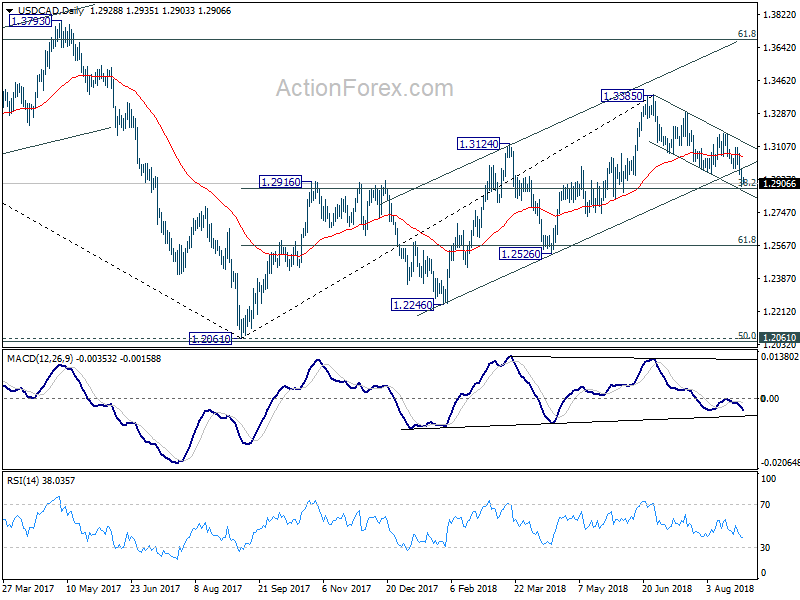
In the bigger picture, the break of channel support (now at 1.2988), argues that rise from 1.2246, as well as that from 1.2061, has completed at 1.3385. Focus is back on 38.2% retracement of 1.2061 to 1.3385 at 1.2879. Decisive break there will affirm the case of medium term reversal and target 61.8% retracement at 1.2567 and below. That will also put key long term support at 50% retracement of 0.9406 (2011 low) to 1.4689 (2015 high) at 1.2048 into focus. On the upside, break of 1.3173 resistance will revive the bullish case and target 61.8% retracement of 1.4689 to 1.2061 at 1.3685 and above.
Canadian Dollar Firm as Trade Talk Restarts, Risk Appetite Losing Momentum
Canadian Dollar remains firms today as Canada-US trade negotiation restarted. Initial signs are positive but more work is needed to be done, swiftly. Australian and New Zealand Dollar follow as Asians stocks strengthen mildly. Yen is trading as the weakest one on risk appetite, followed by Sterling as there is no progress on Brexit talks. For the weak, Canadian Dollar is the strongest one, followed by Swiss Franc. Dollar is in red across the board, followed by Yen.
In other markets, Nikkei is up 0.68% at 22968.18 at the time of writing, still off key resistance at 23050.39. Hong Kong HSI is up 0.14% and Singapore Strait Times is up 0.17%. China Shanghai SSE continues to lag behind other Asian indices and is down -0.35%. The development suggests that the US is softening its stance on trade with key allies. But it's not even time for a talk with China yet. Overnight, DOW closed up 0.06%. S&P 500 and NASDAQ were up 0.03% and 0.15% respectively. Gold lost some momentum after hitting 1214 and has turned into consolidation, back pressing 1200.
Technically, the first thing to note is the lost of momentum in stocks. Despite making new record highs, both S&P 500 and NASDAQ were bounded in tight range overnight. Both have also closed down yesterday's open. Similarly, DAX and CAC also reversed gains yesterday despite trade optimism, with DAX down -0.09% and CAC 0.11%. Nikkei is feeling some strong resistance ahead of 23050 resistance. Hence, barring any drastic news, we'd probably see risk appetite eases a bit.
Secondly, Sterling and Aussie are both rather weak indeed even though the headlines are on Dollar and Yen. As risk appetite recedes, there's a chance for Dollar and Yen to have a mild come back. And in that case, GBP/USD, AUD/USD, GBP/JPY and AUD/JPY could face some pressure.
Canada Freeland had very constructive meeting with Lighthizer, but MILK is the word
Canadian Dollar trades firmer in Asian session today and remains the strongest one for the week. All eyes are on the trade negotiations between Canada and the US. Canadian Foreign Minister Chrystia Freeland, who cut short a European trip to Washington, said she had "very constructive meeting" with US Trade Representative Robert Lighthizer yesterday, and the meeting will continue today. She failed that Mexico had made some "significant concessions" in the are of labor and auto rules of original. And that has "really paved the way for what Canada believes will be a good week".
Dairy products is believed to be a key area that the US will press Canada on. White House top economic adviser Larry Kudlow said in a TV interview that "there's a word that Canada has trouble with and it's M-I-L-K. Milk. Anything to do with milk and dairy — they have this government-run, centrally planned system and some tariffs run upwards of 300 per cent. They're going to have to fix that." And, Kudlow warned that "the president did say if he cannot satisfactorily negotiate with [Canada] he may have to go to a large 20 to 25 per cent tax on Canadian automobiles headed for the U.S." Trump also imposed a Friday deadline for Canada to join the U.S, and Mexico, which is when the administration plans to give Congress its mandatory 90-day notification of the new trade deal.
According to a report by the Globe and Mail, Canada is ready to make a major concession on Diary products.
UK in shop price inflation for the first time in five years
UK BRC shop price index rose 0.1% yoy in August, up from July's -0.3% yoy fall. More importantly, that's the first rise in over five years, breaking a deflation cycle of 63 months. BRC noted in the release that "both higher food price inflation and lower non-food price deflation contributed to the return of Shop Prices to inflation". However, Shop Price inflation remains well below headline CPI as a result of "high levels of competition".
BRC Chief Executive Helen Dickinson noted that for now, "retailers are keeping price increases faced by consumers to a minimum". However, "current inflationary pressures pale in comparison to potential increases in costs retailers will face in the event the we leave the EU without a deal". And if that happens, "retailers will not be able to shield consumers from price increases." She also urged that "the EU and UK negotiating teams must deliver a Withdrawal Agreement in the coming weeks to avoid the severe consequences that would result from such a cliff edge scenario next March."
IMF: Substantial time lag in transmission of Eurozone labor market improvements to inflation
In an IMF blog article titled "Euro Area Inflation: Why Low For So Long?", the puzzle of the broken relationship of core inflation and unemployment was discussed. The study found that the key is "strong persistence of euro area inflation". That is, for example, "coefficient on past inflation is high, much higher than for US inflation". Also, "coefficient on inflation expectations is much lower for the euro area than for the US".
In layman terms, the implication is that "in the euro area, following a period of weak demand and low inflation, it will take a much longer period of strong demand to get inflation back to the inflation objective". Or in more technical term, " there is a substantial time lag in the transmission of improving labor market developments to prices."
The implication to ECB's monetary policy is that it reinforces the case for being "patient, prudent and persistent". And, that will "support the slow process of returning inflation to its objective, through both stronger demand and well anchored inflation expectations."
Looking ahead
German Gfk consumer sentiment and French Q2 GDP will be featured in European session. Later in the day, US will release Q2 GDP revision and pending home sales. Canada will release current account for Q2.
USD/CAD Daily Outlook
Daily Pivots: (S1) 1.2884; (P) 1.2934; (R1) 1.2979; More...
USD/CAD reaches as low as 1.2886 so far and intraday bias stays on the downside. Sustained break of 1.2879 fibonacci level will add to the case of medium term reversal and target next fibonacci level at 1.2567. On the upside, above 1.2981 minor resistance will turn intraday bias neutral first. But for now, near term outlook will stay cautiously bearish as long as 1.3173 resistance holds.
In the bigger picture, the break of channel support (now at 1.2988), argues that rise from 1.2246, as well as that from 1.2061, has completed at 1.3385. Focus is back on 38.2% retracement of 1.2061 to 1.3385 at 1.2879. Decisive break there will affirm the case of medium term reversal and target 61.8% retracement at 1.2567 and below. That will also put key long term support at 50% retracement of 0.9406 (2011 low) to 1.4689 (2015 high) at 1.2048 into focus. On the upside, break of 1.3173 resistance will revive the bullish case and target 61.8% retracement of 1.4689 to 1.2061 at 1.3685 and above.
Economic Indicators Update
| GMT | Ccy | Events | Actual | Forecast | Previous | Revised |
|---|---|---|---|---|---|---|
| 23:01 | GBP | BRC Shop Price Index Y/Y Aug | 0.10% | -0.30% | ||
| 5:00 | JPY | Consumer Confidence Index Aug | 43.4 | 43.5 | ||
| 6:00 | EUR | German GfK Consumer Confidence Sep | 10.6 | 10.6 | ||
| 6:45 | EUR | French GDP Q/Q Q2 P | 0.20% | 0.20% | ||
| 12:30 | CAD | Current Account Balance (CAD) Q2 | -18.0B | -19.5B | ||
| 12:30 | USD | GDP Annualized Q/Q Q2 S | 4.00% | 4.10% | ||
| 12:30 | USD | GDP Price Index Q2 S | 3.00% | 3.00% | ||
| 14:00 | USD | Pending Home Sales M/M Jul | 0.60% | |||
| 14:30 | USD | Crude Oil Inventories | -5.8M |
Market Morning Briefing: Dollar Yen Has Traded Quietly In The 111.0-111.5 Zone
STOCKS
Dow (26064.02, +0.055%) has moved up. It is in an upward channel on the daily candles and could test resistance near 26250-26300 in the near term. Only on a break above 26300, we may consider higher levels of 26600. On the longer term charts also, there is resistance above current levels which may hold in the near term.
Dax (12527.42, -0.087%) also has crucial resistance near 12650-12700 region. A break above 12700 could take it higher towards 12900. For now, a dip from 12700 could be expected.
Nikkei (22928.04, +0.50%) saw a dip yesterday instead of moving higher but is currently trading above 22850. While above 22850, there is still some scope of the upmove to continue towards 23200-23400 in the medium term.
Shanghai (2775.63, -0.085%) is almost stable. Unless a clear break above 2800 is seen, there could be some dip from current levels towards 2700. Channel resistance on the daily candles suggests a possible dip from here in the next 1-2 sessions.
Nifty (11738.50, +0.40%) has been moving up as expected. The index could test 11800 or higher in the near term.
COMMODITIES
Crude prices dipped a bit after news of unexpected gains in the US stockpiles was reported (API data). Overall medium term looks bullish while above current support levels.
Brent (75.99) and Nymex WTI (68.58) both look bullish towards 78 and 70-71 levels in the near term while immediate support near current levels hold.
Gold (1209.50) tested an intra-day high near 1220 yesterday but has dipped from there. Trade in the 1230-1200 region could be possible in the near term with some chances f testing 1190 on the downside. Overall medium term looks bullish.
Copper (2.7285) is bullish towards 2.85 while above 2.70. There could be a slight dip before the price rises towards 2.85 in the medium term.
FOREX
Crucial resistances on Euro and on GBPUSD are holding, suggesting that Dollar strength might resurface in the sessions ahead.
Euro (1.1695) As expected, Euro is coming off from resistance provided by previous support trendline on weekly candles near 1.175 (after having seen a high near 1.173 yesterday). While below 1.175, it could dip below 1.165 by end of this week.
Dollar Index (94.72) saw a low near 93.43 yesterday and has again come up from there. As mentioned yesterday, levels near 94.4-94.3 might restrict the downside in the near term. We might see an upmove towards 95 by end of the week.
Dollar Yen (111.29): Dollar Yen has traded quietly in the 111.0-111.5 zone for the last 4 sessions. Moreover, the last 6 weeks has seen movement in the narrow 110-112.2 zone. On a break above 111.5 and then above 112.2, bullishness towards 113-115 in the weeks ahead could get confirmed. Maybe our target of 112 for this week needs to be reduced to 111.5.
Euro Yen (130.17): Given that Euro has already dipped from resistance and could move down to 1.165 and the Dollar Yen could stay close to 111.5, Euro Yen might not breach the 130-131 resistance zone this week.
Pound (1.2858) is continuing to respect resistance provided by the 21 days MA and by the channel trendline on daily line chart near 1.287. If it breaches this resistance decisively, we could see an upmove towards higher resistance near 1.3000-3050 by next week. A dip from here could initiate a fresh bearish move towards 1.27-1.26. Currently, preference is divided equally between both alternatives.
Dollar Rupee (70.1050) : Rupee might still be ranged against US Dollar and might see 69.90 tomorrow. But, it is weakening against other currencies like the Euro and Yuan, which limits its strength against the US Dollar.
INTEREST RATES
Repeating yesterday's comment: Progress on a trade deal between US-Mexico has led to a rise in US yields. Earlier last week, the US Fed Chairman's comments in the Jackson Hole Conference led some analysts to interpret that a December rate hike by the US Fed might get delayed to 2019. We need to watch out for whether this belief grows stronger in the markets – if it does, then the May high of 3.125% for the US 10 year yield would be confirmed as the year's top.
US 10 Year Yield (2.87%) : Although the 10 year yield is rising, we would wait for a breach above 2.9% before we abandon the possibility of a downmove below 2.82% in this move. Current preference remains bearish for the near term. A breach above 2.9% could however lead to another upmove to 3% and then, a dip from there.
Japan 30 year yield (0.85%) has risen to crucial resistance @ 0.85%. If breached, it would be bullish for long term bond yields of Japan, USA and Germany.
German 10 year yield (0.38%): As expected, it is rising towards resistance near 0.4% on medium term chart (current preference is for 0.4% to not be breached – probably a gradual downtrend towards 0.18% could happen).
German-US 10Yr Spread (-2.49%) has crucial resistance level at -2.45%, which if breached, could make the spread bullish in the medium term – current preference is for the resistance to not be breached.
Gold Price Gaining Momentum Above $1,200, US GDP Next
Key Highlights
- Gold price climbed higher recently and broke the $1,200 and $1,205 resistances against the US Dollar.
- There was a break above a major bearish trend line with resistance near $1,198 on the 4-hours chart of XAU/USD.
- The US Wholesale Inventories in July 2018 (Preliminary) increased 0.7%, more than the +0.1% forecast.
- The US Gross Domestic Product for Q2 2018 (Preliminary) will be released today, which is forecasted to grow 4.0%.
Gold Price Technical Analysis
After a significant decline below $1,180 earlier this month, gold price found support near $1,160 against the US Dollar. The price started a nice upward move and broke the $1,180 and $1,200 resistance levels.
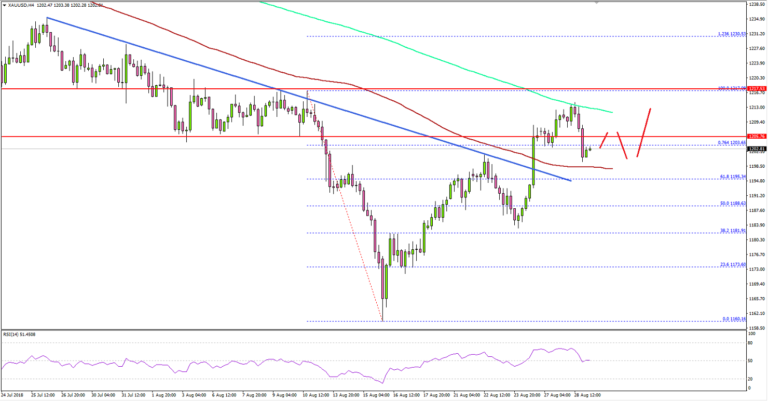
The 4-hour chart of XAU/USD indicates that the price formed an intermediate low at $1,182 and surged higher. During the upside move, it broke the $1,200 and $1,205 resistance levels. More importantly, there was a break above a major bearish trend line with resistance near $1,198.
The price settled above the $1,200 level and the 100 simple moving average (red, 4-hours). Additionally, there was a clear break of the 76.4% Fib retracement level of the last decline from the $1,217 high to $1,160 low.
The price is now trading nicely in a bullish zone and it could continue to move higher towards the $1,220 resistance. Above $1,220, the price may possibly test the 1.236 Fib extension level of the last decline from the $1,217 high to $1,160 low at $1,230.
On the flip side, if the price corrects lower, the broken resistance near $1,200 and the 100 SMA are likely to act as strong supports in the near term.
Recently, the US Wholesale Inventories report for July 2018 (Preliminary) was released by the US Census Bureau. The market was looking for a rise of 0.1% in the Wholesale Inventories, similar to the last 0.1% increase.
The result was negative as there was a sharp rise in the Wholesale Inventories by 0.7%. Additionally, the international trade deficit increased $4.3 billion to $72.2 billion. The report added that:
Exports of goods for July were $140.0 billion, $2.5 billion less than June exports. Imports of goods for July were $212.2 billion, $1.8 billion more than June imports.
Overall, there was a slight increase in selling pressure on the US Dollar. Major pairs like EUR/USD and GBP/USD also gained bullish momentum recently and traded above 1.1680 and 1.2850 respectively. However, today’s GDP release in the US could impact the market sentiment since the forecast is slated for a solid 4.0% growth in Q2 2018.
Economic Releases to Watch Today
- US Gross Domestic Product Q2 2018 (Preliminary) – Forecast 4.0% versus previous 4.1%.
- US Personal Consumption Expenditures Prices for Q2 2018 (Preliminary) (QoQ) – Forecast +1.8%, versus +1.8% previous.
- US Core Personal Consumption Expenditures for Q2 2018 (Preliminary) (QoQ) – Forecast +2.0%, versus +2.0% previous.
- US Pending Home Sales for July 2018 (MoM) – Forecast +0.4%, versus +0.9% previous.