

Sample Category Title
Eco Data 7/26/18
[php_everywhere instance="1"]
Japanese Yen Edges Lower, Inflation Report Next
The Japanese yen has posted slight gains in the Wednesday session. In the North American session, USD/JPY is trading at 110.97, down 0.21% on the day. On the release front, U.S New Home Sales dropped sharply to 631 thousand, well off the estimate of 669 thousand. This marked a 4-month low. Later in the day, Japan releases SPPI, which is expected to remain unchanged at 1.0%.
Recent trade tensions between the U.S and its trading partners have shaken investors worldwide, but the safe-haven Japanese yen has not reaped the benefits of nervous market sentiment. Investors are not rushing to buy Japanese assets when Japanese interest rates remain close to zero. At the same time, if the tariff battle intensifies and the Trump administration makes good on its threats to impose further tariffs, we could see a move towards the Japanese currency.
The yen has posted slight gains this week and touched a 2-week high in response to a report that the Bank of Japan was considering changes to its monetary policy, in particular, its interest rate targets. This has raised speculation that the Bank could be making plans to reduce its massive stimulus program. Japan’s 10-year yield climbed to 5-month high on Monday in response to the report. If there are further signals from the BoJ that policymakers are considering reducing stimulus, the yen could move higher.
Trump to insist on auto tariffs, Euro bothered but not too bothered
Euro seems to be troubled by a Washington Post story that Trump insists on, ignoring the outcries from Republicans and business executives, pushing through 25% auto tariffs. That came just ahead of the meeting with EU Juncker. Earlier today, there was an ABC story saying that Juncker is bringing offers to Trump to avert a trade war. But that's on condition that Trump has to drop tariffs on steel and aluminum first.
As we pointed out before, there is no common ground for negotiation between Trump and the EU. From his recent tweets and talks, Trump will continue to play victim and request EU to act before he drops the tariff threats. EU, on the other hand, will insist on Trump dropping the gun first before starting the talk.
But most importantly, Trump, and to a certain extent his supporters, views BOTH EU and China as threat to the US hegemony. When national security can be used as an excuse to impose tariffs on the closest allies in Canada, tariffs can be also used as a excuse for some agenda other than trade. It's widely known that tariffs won't solve global imbalances. The economists know it. Trump's advisors and himself certainly know it. So, it's totally unsurprising for Trump to insist on auto tariffs.
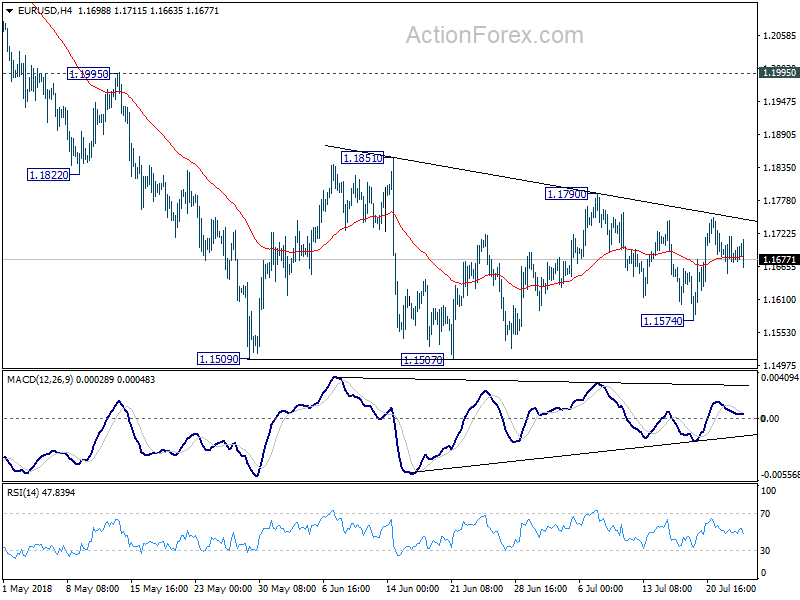
But after all, we'd like to emphasize that while EUR/USD's dip may look wild in a 1 min chart, but it's peanut, nothing, in an hourly chart, not to mention a 4H chart. Always look at the big picture. EUR/USD is in consolidation. And anything goes inside a corrective pattern.
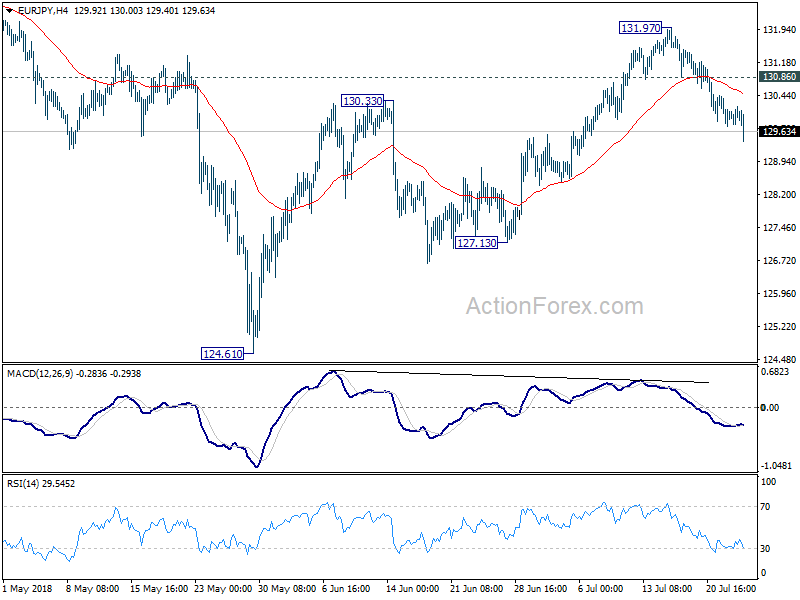
EUR/JPY's is an extension of the decline from 131.97. We've mentioned in the technical outlook that EUR/JPY is heading back towards 127.13 support because the rebound form 124.61 has completed with three waves up to 131.97, on bearish divergence condition in 4 hour MACD. So the decline is not a surprise neither.
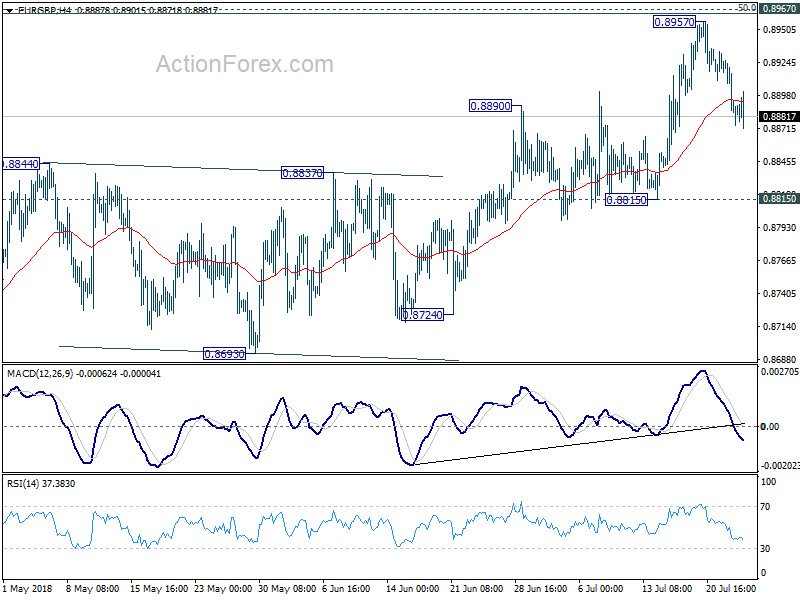
And, EUR/GBP is just having some jitters!
A Beginner’s Guide to the Japanese Yen
Did you know that over 80% of the trading volume in the FX market is dominated by only a handful of currencies?
According to the Bank for International settlements, the Japanese yen is the third largest currency in motion, behind the US dollar and the euro.
Japan is also a highly developed and market-orientated economy, which, according to research, controls the third largest economy in the world by nominal GDP.
The purpose of the following piece is to explore some of the unique factors surrounding the Japanese yen, and more importantly, what generally causes it to stir in the FX market.
The Bank of Japan
The Bank of Japan, or more commonly referred to as the BoJ, is the sole banking facility that issues yen currency. Established under the Bank of Japan Act (promulgated in June 1882), the BoJ plays an important role in determining and enforcing the government’s economic and financial policies. Like other major central banks, its chief mandate is to encourage growth, minimize inflation and set short-term interest rates.
The central bank carries a lot of clout in the FX market. Dovish/hawkish rhetoric from the bank’s governor Haruhiko Kuroda and other members of the policy board are watched closely by traders all around the world, as oftentimes this excites the yen.
Bank events to keep a watchful eye on are as follows:
- Interest rate decisions.
- Press conferences.
- Policy board member speeches.
- The bank’s monthly report.
- Monetary policy meeting minutes.
Intraday movements
Alongside the BoJ, several economic indicators frequently cause short-term exchange rate fluctuations.
Data reports such as Gross Domestic Product (GDP), which measures the annualized change and inflation-adjusted value of all goods and services produced by Japan, and the Consumer Price Index (CPI) that measures the change in prices of a basket of goods and services, tend to have the most notable effect. Also worth noting, though, is Industrial Production. This economic event measures the change in total inflation-adjusted value of output produced by manufacturers, mines and utilities.
While the Tankan survey is not listed as a high-impacting event, it is still worthy of a read. Released quarterly, the survey is considered to be the most complete report of Japan’s economic health.
An important correlation between the Japanese yen and gold
The Japanese yen and gold are two assets that experience similar movements. Proof of this can be seen on the following chart:
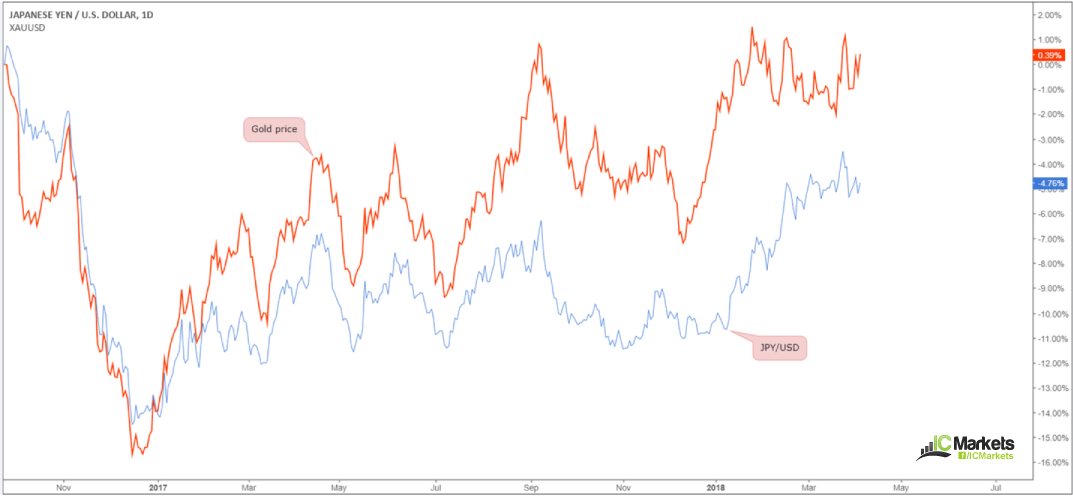
As you can see, both markets mirror each other’s movements, almost to the point.
Overall, there is no clear explanation as to why this correlation exists, other than several theories. One such theory is the fact that gold and yen both share the status as a safe haven.
Given the closely mirrored action, this, from a trader’s perspective, is simply not a correlation one can ignore. For example, the XAU/USD has around a 90% inverse correlation with the USD/JPY market, meaning that when the price of gold rallies, the USD tends to sag against its Japanese counterpart. We touched on how to use these types of correlations here: Identifying Correlations
Another correlation to be aware of is the yen and the price of oil. It should not really come as much of a surprise since Japan imports 99% of its oil! This dependence would suggest an inverse correlation between the yen and oil prices, meaning that the yen would logically be expected to increase in value should oil price decrease.
The Japanese yen as a safe-haven currency
During risk-off scenarios, the Japanese yen, on average, tends to appreciate.
The yen, Swiss franc and gold, are widely considered safe-haven assets. This means that in times of economic uncertainty, invertors’ behaviour typically favour the aforementioned assets.
Safe-haven assets tend to have low interest rates, a strong net foreign asset position and deep liquid financial markets. Japan meets all of these conditions.
A few things to keep in mind
- Keep tabs on BoJ movement. As highlighted above, the central bank has a habit of stirring JPY-related currency pairs.
- High-impacting economic releases out of Japan should also be taken into consideration should you look to interact with the currency. Should you consider a trade at a time the central bank is due to make an appearance or a high-impacting event is scheduled for release, it may be best to consider holding fire until the event has passed.
- The yen is a safe-haven asset, boasting a strong correlation with the price of gold. This can be used to confirm trade ideas.
Exploring the Trend Line
As humans we love to overcomplicate things!
While an elaborate trading strategy may impress your family and friends, it is unnecessary to succeed.
For those that have been involved in the markets for a while will know that keeping things simple is a MUST in trading. And that's why the trend line remains a favourite among the technical community.
By definition, trend lines are linear and are constructed by linking two or more price points that extends into the future to be used as support or resistance. We will not go into too much detail here regarding form since we already covered that here: How to Identify Trendlines. Our objective in this piece is to demonstrate the many uses the trend line possesses.
What happens when your trusted trend line fails?
As with all technical methods, nothing is guaranteed to work 100% of the time. Trend lines WILL fail from time to time, and when they do this tends to give way to a retest play.
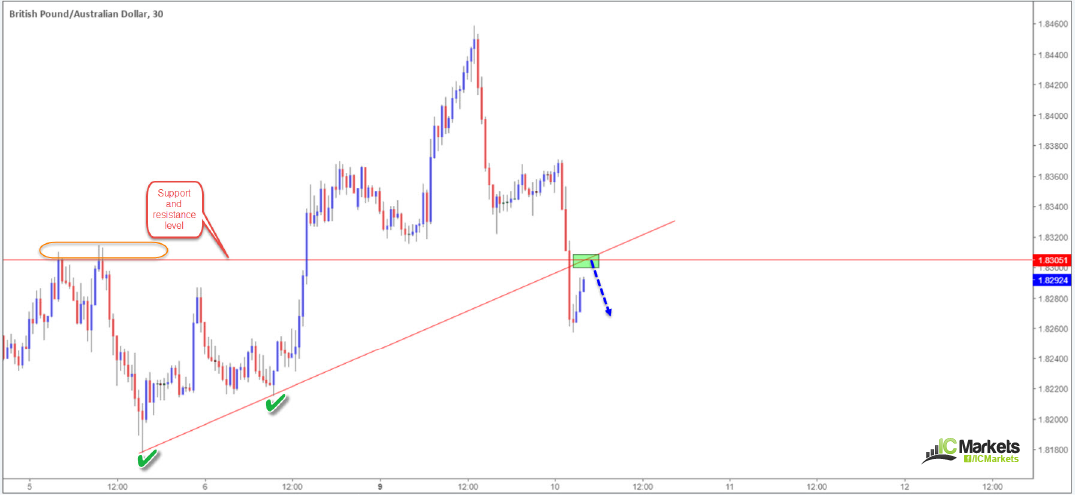
As you can see on the M30 GBP/AUD chart depicted below, the trend line support recently experienced a somewhat aggressive breach to the downside. In one fell swoop the barrier was wiped out. While a loss may have been incurred, trading the underside of this level as (in this case) resistance is now a plausible option.
What causes a response on the retest of a broken trend line?
Well, from an order-flow perspective one could put it down to supply and demand.
One way of potentially looking at order flow here is through the eyes of pro money (generally thought to be institutional traders with particularly deep pockets):
- Those that entered into a long position off of the trend line support pictured above likely had stop-loss orders sited 10-15 pips beneath the barrier.
- Given the recent move lower, stop-loss orders have, therefore, been filled and thus become sell orders.
- Using these sell orders pro money buys into this liquidity, lifting price action higher. They do this in order to reach the unfilled sell orders left at the break of the trend line. As the initial break was strong, it's unlikely that pro money were able to fill all of their sell orders. Remember, we are not talking 10 lots here!
- So, in order to fill these unfilled sell orders, price is bid higher and as soon as the sell orders have been triggered, pro money liquidates its initial buy orders, thus letting price push its way south.
The RSI indicator also loves a trend line!
An often overlooked, yet highly effective, method of using the RSI indicator is combining trend lines. The RSI indicator typically finds its use when the oscillator reads an overbought or oversold signal. It is also great at finding divergences. However, drawing trend lines directly over the oscillator itself is also highly effective. Connecting rising swing lows in an uptrend or lower swing highs in a downtrend, traders are able to find excellent trading opportunities.
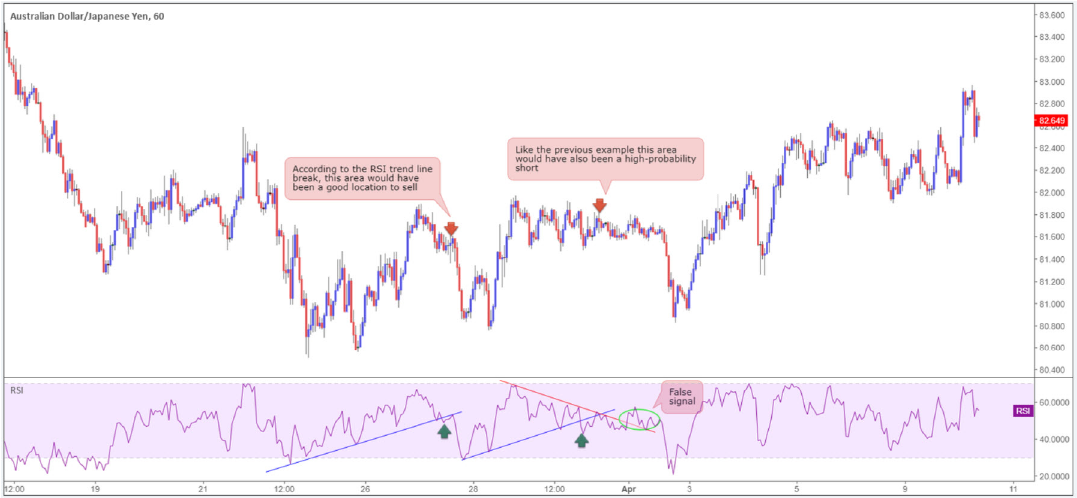
There are two solid examples of potential short trades posted on the AUD/JPY H1 chart above. Note how the break of the two ascending trend lines indicated a downside move was likely in the making, before the candles actually set off lower.
As we highlighted above, though, nothing is guaranteed in trading. As you can see, there was a false signal to the upside marked with a green circle. This is why we believe one should never trade any technical tool in isolation. Combining RSI trend lines with candlestick structure is recommended.
Not only does the RSI indicator work well with trend lines on any timeframe, it might be worth noting that it is also particularly fond of support and resistance levels as well!
Additional points to consider
- Trend lines can be great tools for trade management, potentially leading to huge gains if handled correctly. For example, imagine you're long the EUR/USD and price has moved nicely away from the entry point and printed a higher low. At this point, you could extend a trend line using the initial reaction and newly-formed higher low as a basis for a trend line to manage the trade. A close beneath the trend line would be considered a signal to exit the position.
- Trend lines are also exceptionally good at confirming areas of interest. By way of illustration, let's assume you have spotted a nice-looking resistance level on the H1 timeframe. You've noted that it has good history, but lacks technical confluence. Do you just ignore the level or trade in hope? Well, trading in hope is not how professionals approach this business! An alternative, therefore, is to wait for additional confirmation, rather than passing on what could be a profitable resistance. A trend line support break/retest play is something traders could look for. Generally, though, you'll have to drill down to the lower timeframes in order to catch this.
As a reminder, broken trend lines are BEST traded in combination with additional technical tools. The more reasons there are to trade an area, the more likely it'll hold.
Dollar Turns its Gaze to US Durable Goods and GDP Data
The latter part of this week promises to be exciting for the dollar, as US durable goods orders for June will hit the markets on Thursday, and the first look at GDP for Q2 is released on Friday, both at 1230 GMT. Forecasts point to robust figures, particularly for economic growth, which could enhance speculation for two more Fed rate hikes this year and potentially provide another lift to the dollar.
US durable goods orders are expected to have risen by a notable 3.0% in June, a rebound following a 0.4% drop in the preceding month. That said, most of the recovery appears to have been driven by a surge in volatile components like airplanes, as the core figure that excludes transportation equipment is only projected to rise by 0.5%, after stagnating in May.
Turning to GDP growth, the preliminary number is expected to show the US economy expanded by a remarkable 4.1% in Q2 on an annualized basis, much faster than the modest 2.0% recorded in Q1. Beyond economists’ forecasts, models like the Atlanta Fed GDPNow place their estimates even higher, at 4.5%. The anticipated robust print appears to be owed to a combination of the recent fiscal stimulus kicking in, as well as some one-off factors, like a surge in soybean exports before retaliatory tariffs from China took effect.
Still, such a solid GDP print would likely reinforce expectations that the Fed is set to raise interest rates twice more this year. At the time of writing, investors have fully priced in one more 25bps rate increase by year-end, while they also assign a 61% probability for a second one, Fed fund futures suggest.
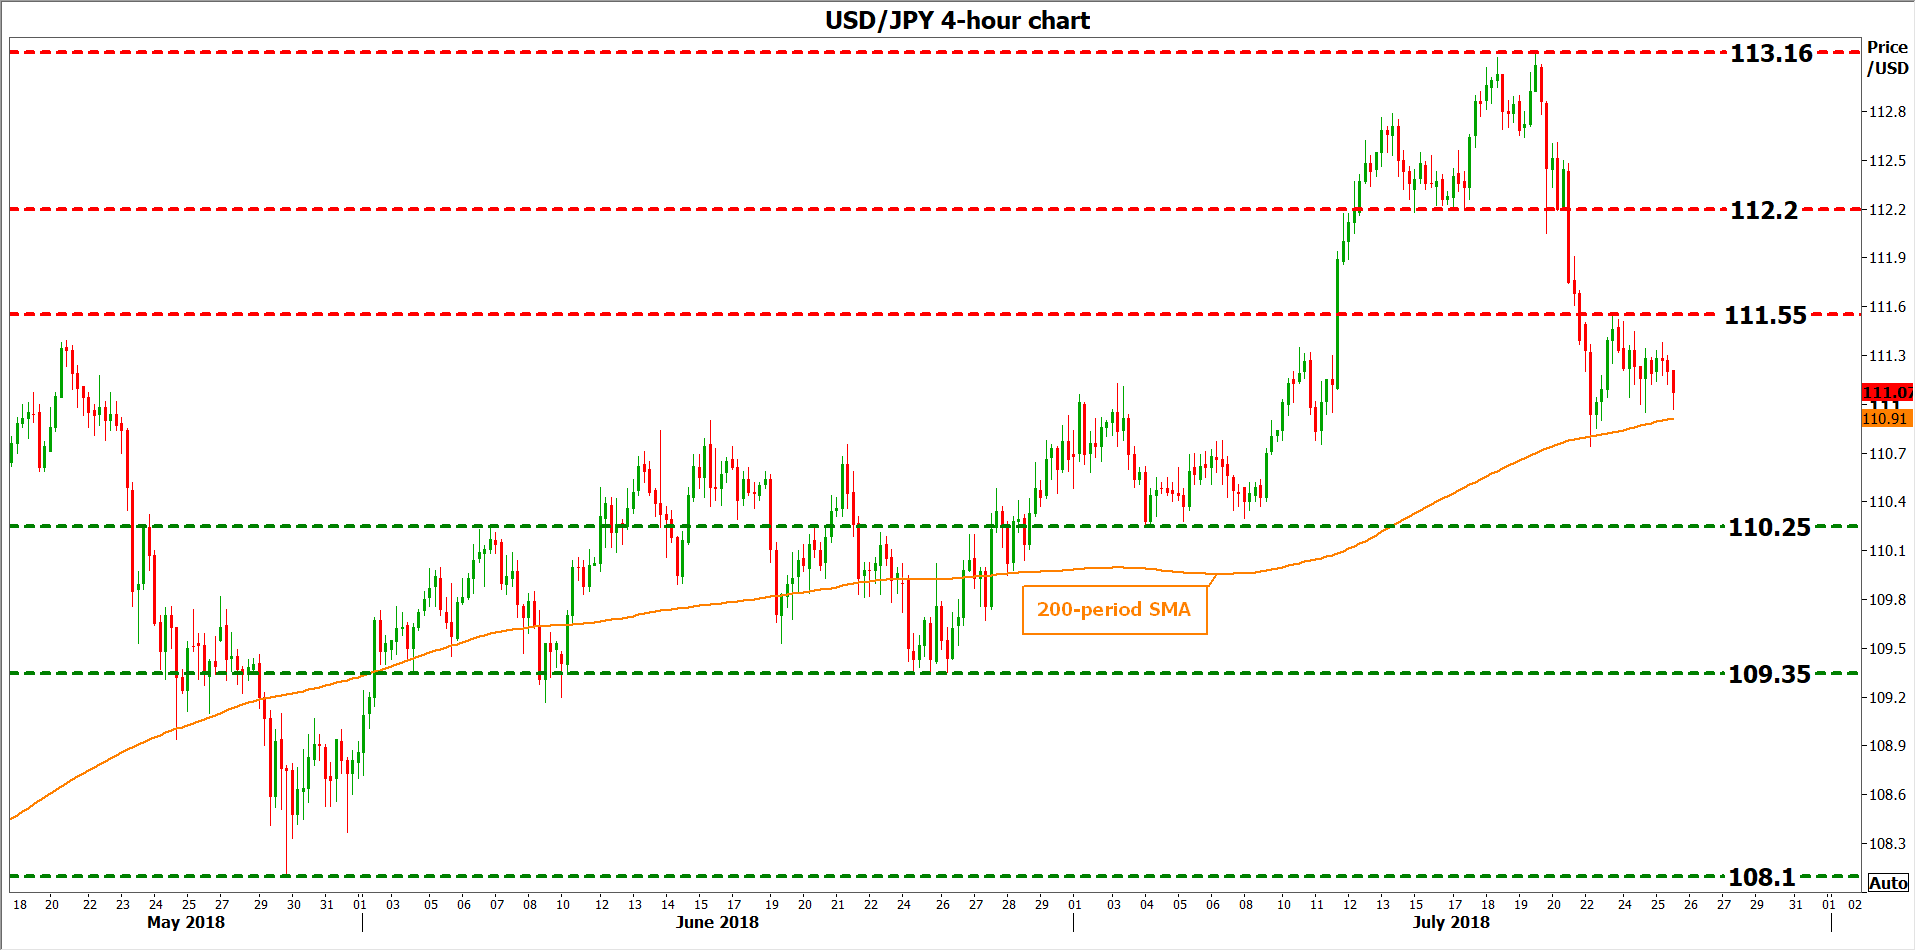
Stronger-than-projected data could push the likelihood for a second hike even higher and thereby, bring the dollar under renewed buying pressure. Looking at dollar/yen technically, immediate resistance to advances may be found near the 111.55 zone, defined by the July 23 peaks. Even higher, attention would turn to 112.20, defined by the inside swing low on July 16, before the seven-month high of 113.16 comes into view.
On the downside, initial support to declines may be found near 110.25, the July 4 low. A clear break below it could open the way for the 109.35 territory, marked by the trough of June 25. Even steeper bearish extensions could see scope for the 108.10 area, this being the low of May 29.
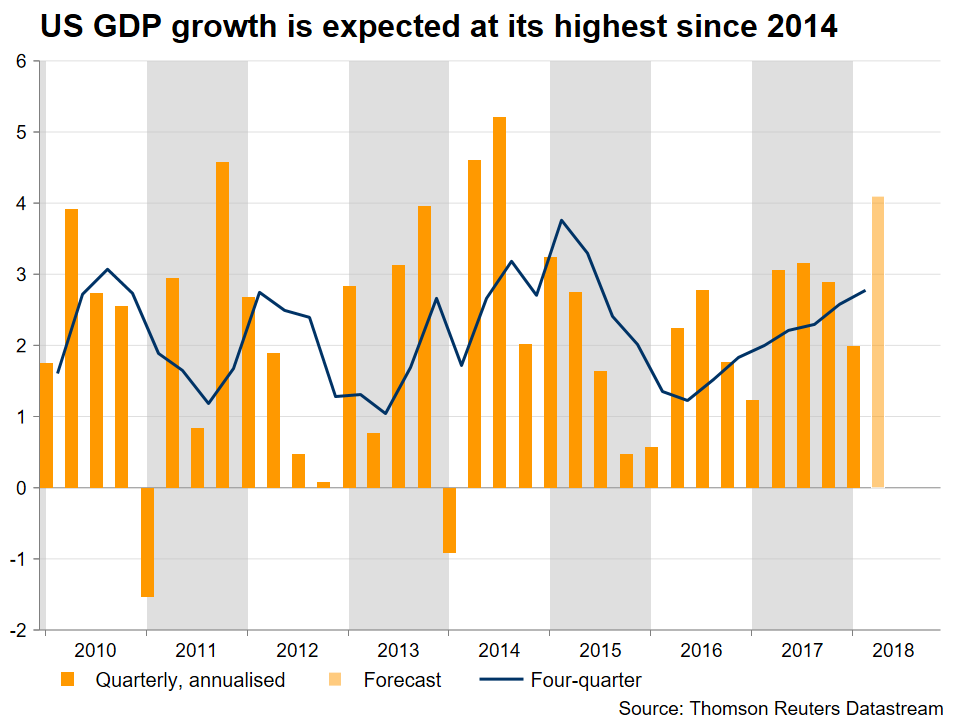
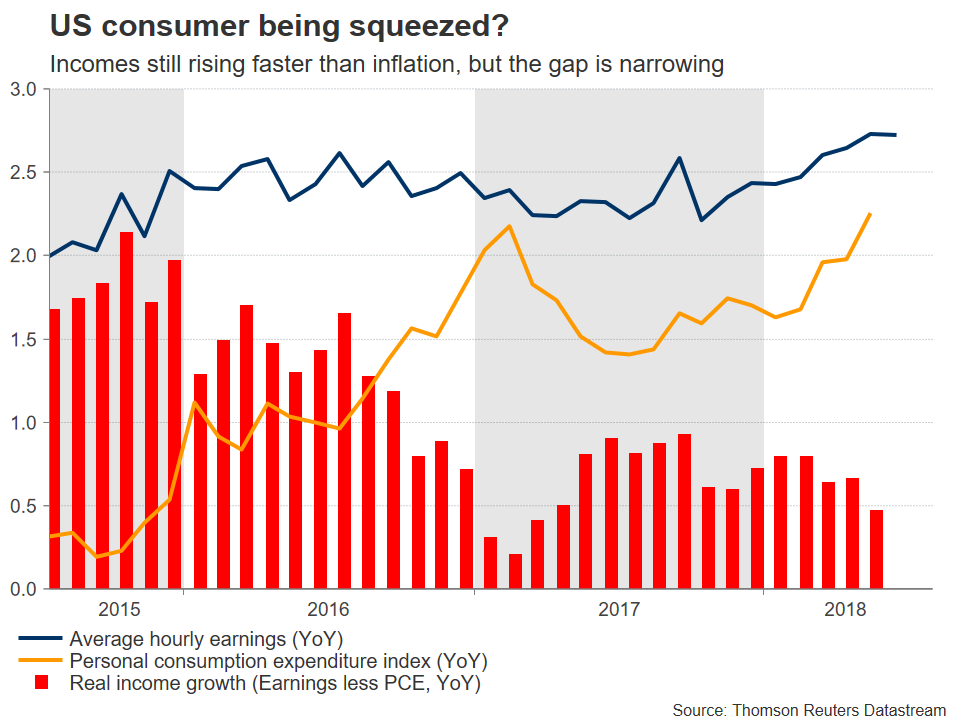
Finally, it’s worthy to note that the financial community appears to be almost unanimous that even though the Q2 GDP print will probably be very strong, such numbers are unlikely to be sustained in the coming quarters. The effects of the tax cuts are set to fade moving forward, while real incomes in the US appear to be gradually but steadily squeezed, potentially pressuring consumers. Meanwhile, the adverse effects of trade tensions may be set to manifest themselves, with Fed Chairman Powell saying last week that there are increasing signs firms are putting expenditure plans “on ice” amid trade worries.
ECB Research: Whatever Iit Took – In Charts
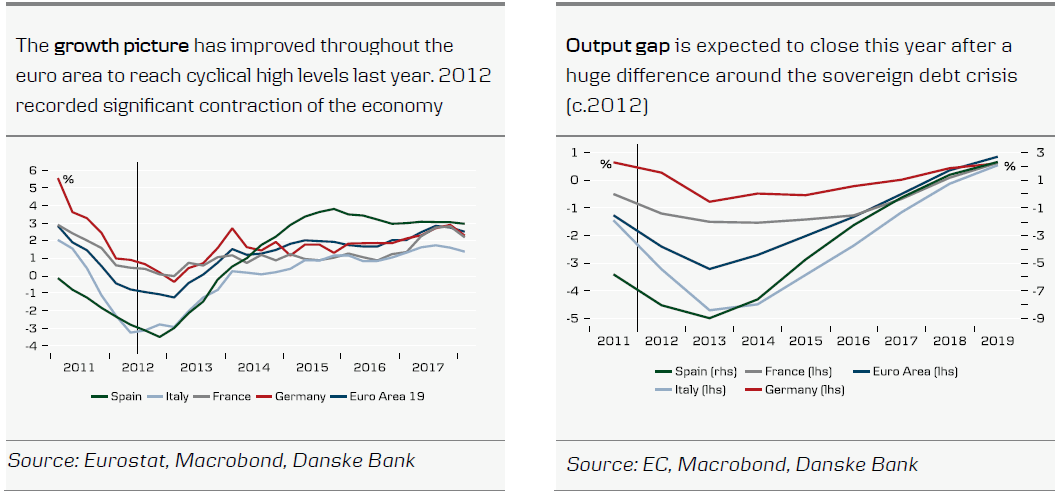
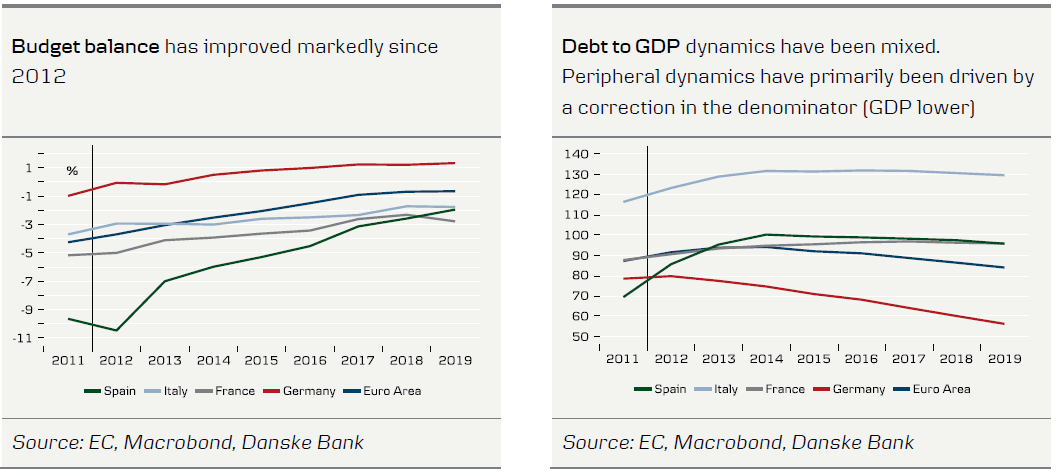
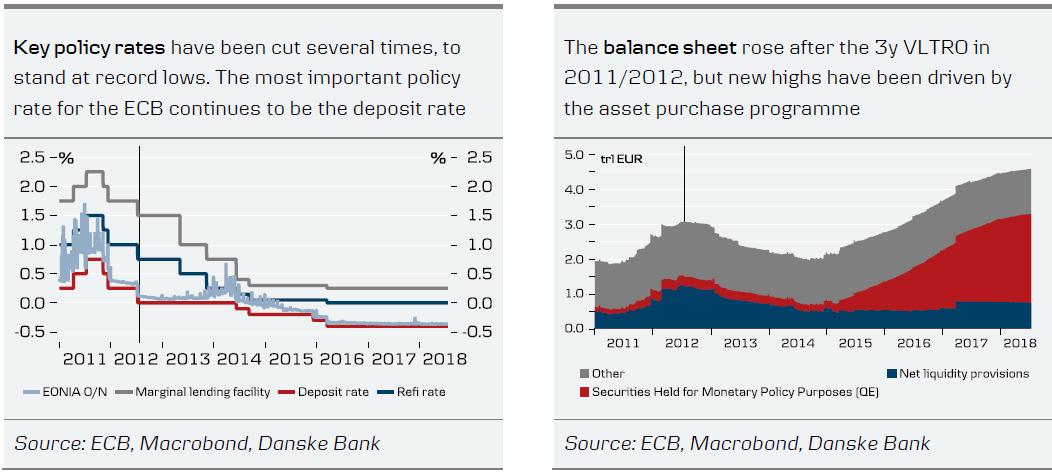
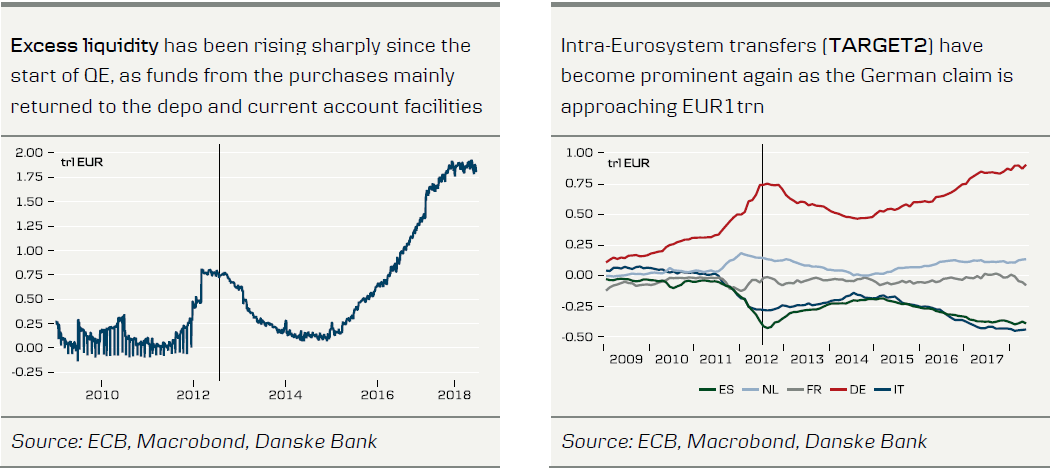
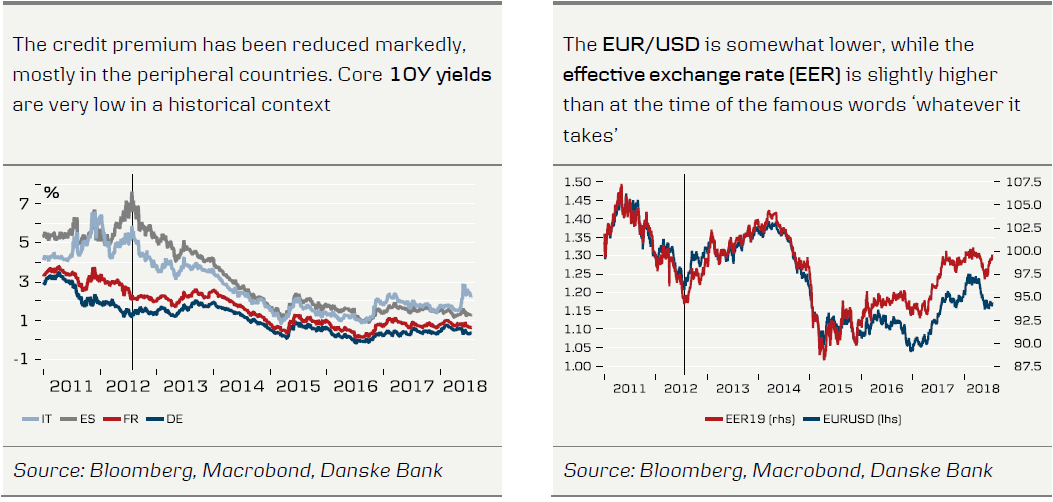
Tomorrow, 26 July, the ECB's governing council will gather for a rather uneventful meeting according to almost all market participants including us. What some people may have forgotten is that on this exact day, six years ago, 26 July 2012, ECB president Mario Draghi said what is likely to be the most important words in recent European monetary policy history: 'Within our mandate, the ECB is ready to do whatever it takes to preserve the euro. And believe me, it will be enough.'
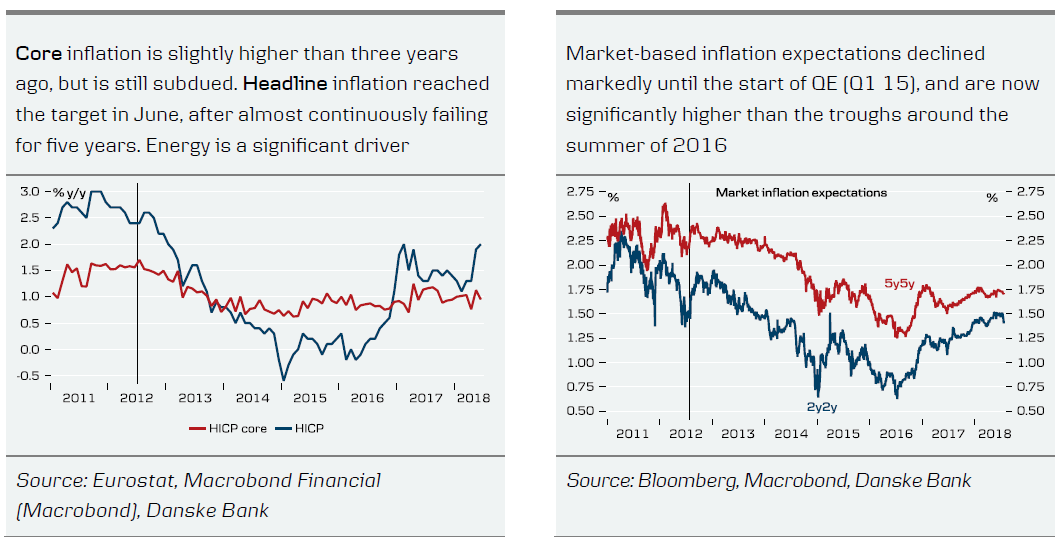
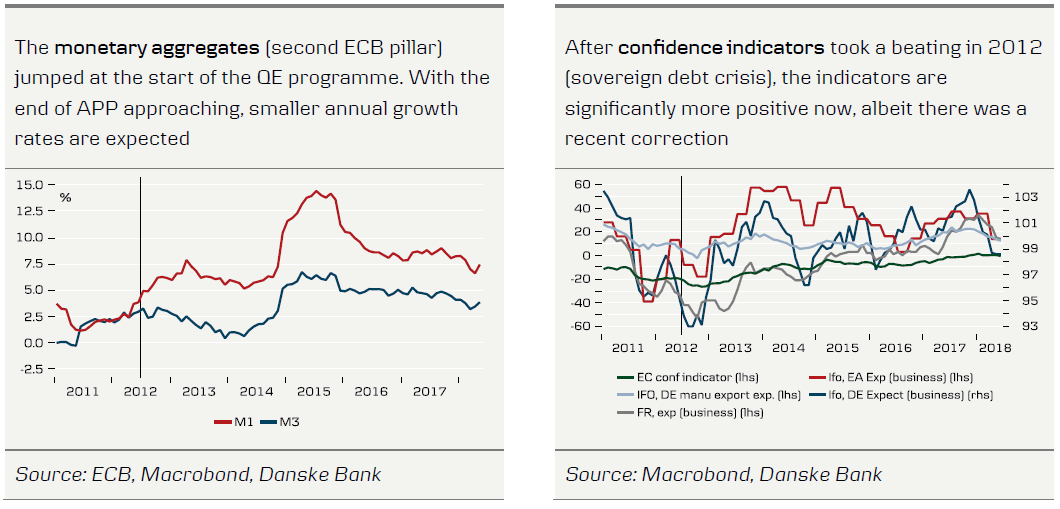
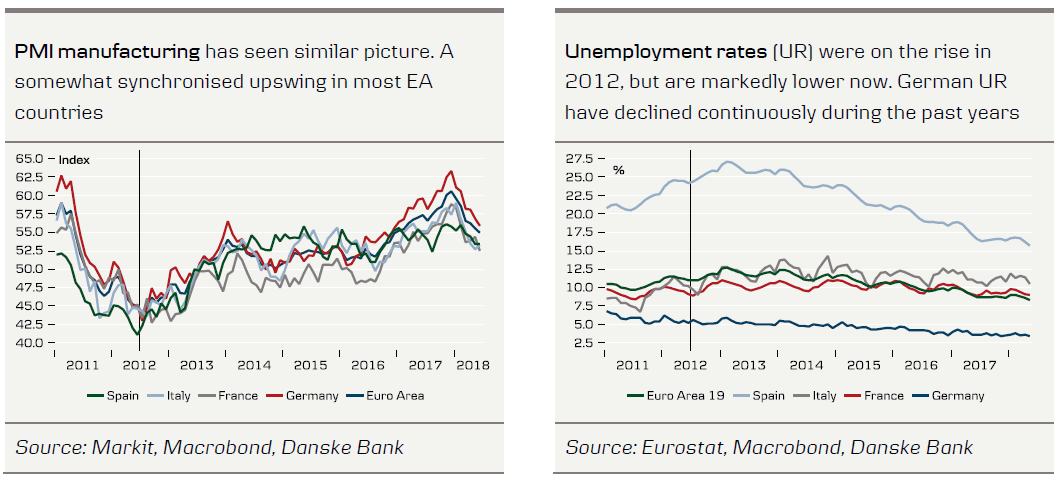
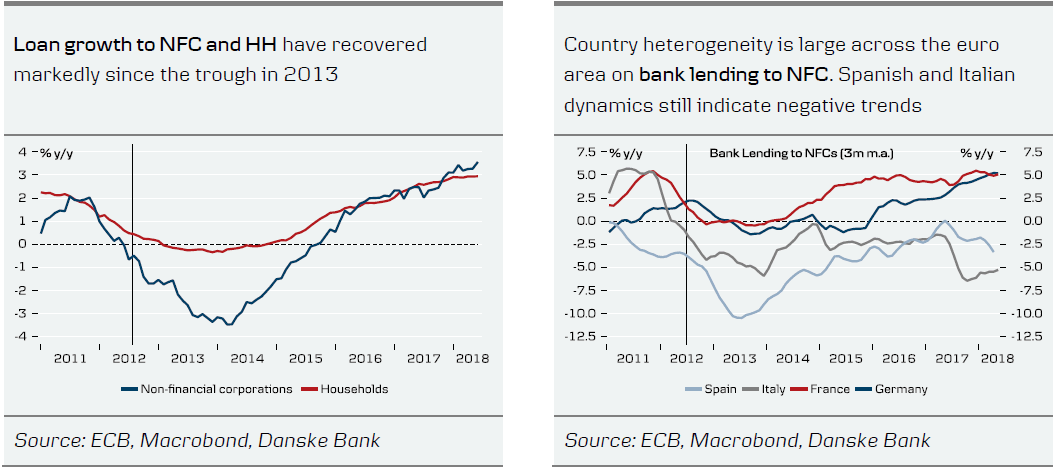
Since the famous words, ECB has taken a number of initiatives, and with its boldest project, the asset purchase programme, anticipated to conclude by the end of the year, we present key charts on how the economy has evolved and how ECB has fared since then (key events on the right). The vertical line on each chart indicate the timing of the famous words.
Whatever it took – key GC meetings
- July 2012: 'whatever it takes'.
- September 2012: OMT presented.
- July 2013: Forward guidance on rates introduced.
- June 2014: Deposit rate is lowered to -10bp.
- January 2015: PSPP announced. Starts in March 2015 and runs at least until September 2016.
- December 2015: PSPP extended to March 2017; reinvestments of principals announced.
- March 2016: Deposit rate cut to - 40bp; corporate bond purchase programme announced; TLTRO2 announced; APP purchase rate EUR80bn/m.
- December 2016: PSPP extended until December 2017; APP purchase rate EUR60bn/m from April.
- October 2017: APP extended to September 2018. Purchase rate EUR30bn/m.
- June 2018: APP 'anticipated' to end in December 2018. Purchase rate EUR15bn/m in Q4 18; strengthens rates forward guidance.
US500 Stock Index Increasingly Bullish as it Approaches All-Time High
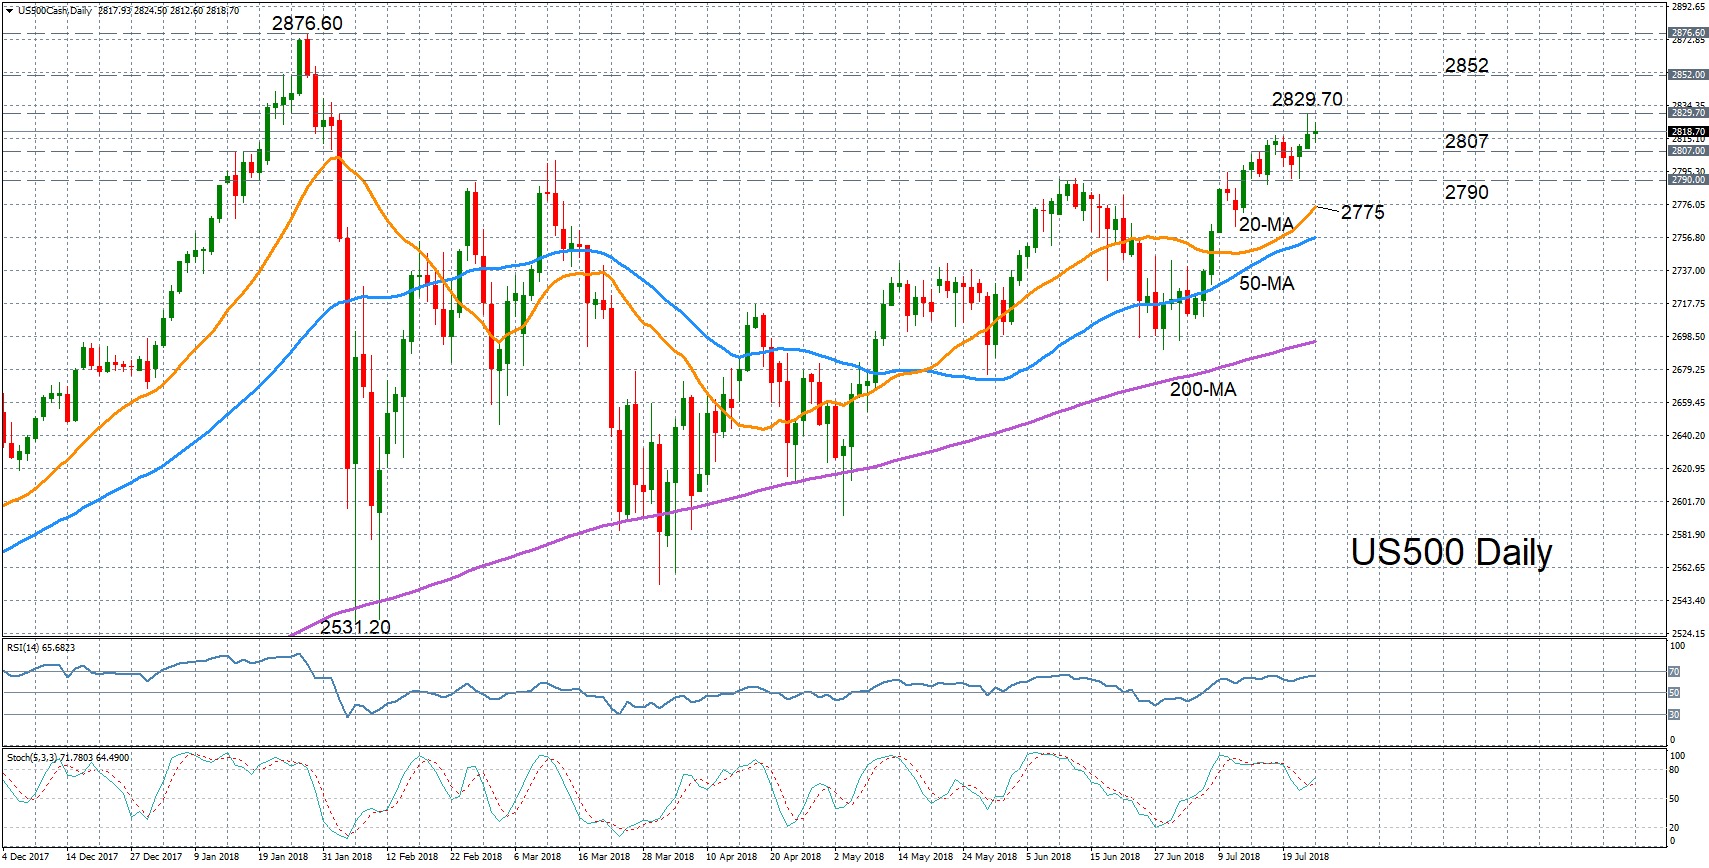
The US 500 stock index (cash) reached a near 6-month high of 2829.70 on Tuesday, with the index now having retraced about 80% of its January/February losses. The near-term bias remains strongly bullish according to the momentum indicators. The RSI is climbing and has yet to rise into overbought territory, while the %K line of the stochastic oscillator recorded a bullish crossover with the slower moving %D line. Both indicators suggest there is scope for additional gains in the short term.
The nearest obstacle for price action to move higher is yesterday’s high of 2829.70. A climb above this level could see the next resistance coming at around the 2852 level. Clearing this hurdle would set the index on path to beat its all-time high of 2876.60 achieved in January. Breaking above this top would take prices into record territory and signal the end of the medium-term consolidation phase, shifting the outlook to bullish.
However, should disappointing earnings results trigger a downside correction, immediate support should come from around 2807. A drop below this mark could see the index heading back towards the recent support area of 2790. A steeper sell-off would push prices towards the 20-day moving average at 2775. A breach of this support would risk switching the near-term bias from bullish to bearish.
Ending Diagonal on S&P500 Suggests a Bearish Reversal
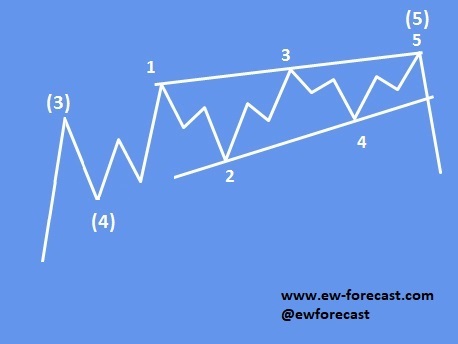
S&P500 is now trading in late stages of wave c of 5 of a big Elliott wave ending diagonal so traders have to be aware of an upcoming bearish turn, probably around 2815/2835 region. However, only a five wave fall may confirm a top in place. In our case we would have to see a drop below 2750 area.
That being said, we can also see a divergence on the RSI, which indicates an upcoming bearish turn.
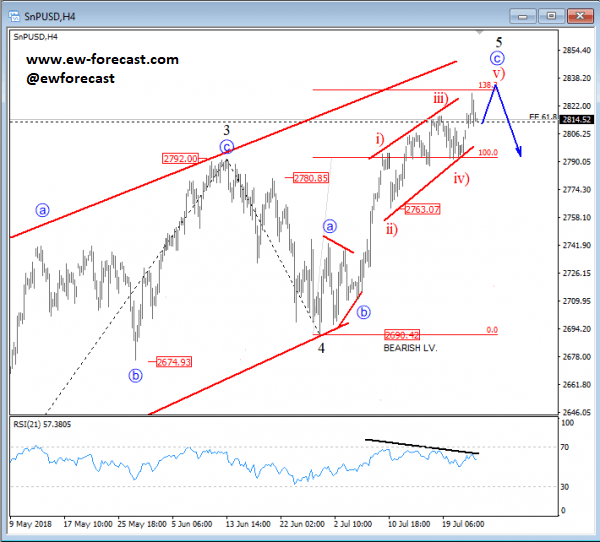
An ending diagonal is a special type of pattern that occurs at times when the preceding move has gone too far too fast, as Elliott put it. A very small percentage of ending diagonals appear in the C wave position of A-B-C formations. In double or triple threes, they appear only as the final “C” wave. In all cases, they are found at the termination points of larger patterns, indicating exhaustion of the larger movement. Also the indicate a sharp reversal, once completed.
Elliott wave ending diagonal example:
Sunset Market Commentary
Markets
Global core bond trading was confined to very narrow ranges today. US Treasuries marginally underperform ahead of tonight’s 5-yr Note auction. The eco calendar only contained German Ifo, which printed near consensus. Details added a negative accent with the expectations component slightly underperforming the current situation index. Investors await the outcome of tonight’s encounter between Trump & Junckers, tomorrow’s ECB meeting and Friday’s US Q2 GDP release. Will last week’s hypothesis that investors start demanding a higher US risk premium hold in case of an adverse outcome of tonight’s meeting? The German yield curve bull flattens with yields up to 1.2 bps lower (30-yr). The US curve flattens as well with yield changes ranging between +1.2 bps (2-yr) and -1.4 bps (30-yr). 10-yr yield spread changes vs Germany narrow up to 3 bps.
Global FX traders kept a cautious wait-and-see approach. There is too much upcoming ‘binary’ event risk in the hours and days to come for investors to place big directional bets in the dollar or on other markets. In line with yesterday’s German PMI, the Ifo business climate was not too bad. The index declined marginally (101.7), mirroring uncertainty on global trade tensions. Even so, the index remains at a decent level. EUR/USD tried to regain the 1.17 level after the publication of the release, but the move had no strong legs. Whatever, the price action was overshadowed by the meeting between US President Trump and EU Commission President Juncker later today. The meeting is a possible pivotal point in the US-EU trade conflict. Investors turned a bit more cautious as the meeting is coming closer. Core bond yields and EUR/USD drifted sideways. Equities and USD/JPY are trading with a tentative negative bias. EUR/USD hovers near 1.17. USD/JPY is testing the 111 area. However, it is highly likely that both cross rates will close at different levels this evening, whatever the outcome of the Trump-Juncker meeting.
Sterling gained further ground yesterday after UK PM May said that she will take control of the Brexit negotiations. Hard-line Brexiteers evidently will still try to push the Brexit process in their own direction. Even so, the move of the UK PM potentially raised chances on a rather soft Brexit. Today , there was little important additional news on Brexit. CBI retail data (July) were stronger than expected. UK loans for housing finance also picked up in June. The data add to other recent evidence that the UK economy regained enough momentum in Q2 for the BoE to implement a cautious rate hike at next week’s meeting. Even so, sterling wasn’t able to extend yesterday’s rebound. EUR/GBP holds a very tight range just below the 0.89 big figure. Cable gained a few more ticks and trades in the 1.3175 area.
News Headlines
European Union trade commissioner Cecilia Malmström said that the European Commission is drawing up a list of $20 billion of U.S. goods that could be hit with import tariffs in retaliation against possible US levies on car import from the EU. Later today, Trump and Juncker will meet in Washington to discuss possible solutions.
Euro zone business lending growth rose 4.1% in June compared with 3.7% the month before. That’s the fastest growth since May 2009, backing the European Central Bank’s judgment that the economy in the euro area is in the right condition to withstand the end of the bond purchases at the end of this year.
The German IFO business climate for July lost ground for a second month in a row and declined to 101.7, compared to 101.8 in June, though a bigger drop to 101.5 was expected. Germany’s economy is fearing a growing threat of US import tariffs on European cars, pushing the index to its lowest level in 16 months.