Sample Category Title
DAX Trading Sideways As Investors Look For Cues
The DAX index is almost unchanged in the Friday session. Currently, the DAX is at 12,679, down 0.06% on the day. On the release front, German PPI dipped to 0.3%, matching the estimate. The eurozone current account surplus dropped sharply to 22.4 billion. This was well short of the forecast of 27.2 billion and the lowest surplus since June 2017.
After years of monetary stimulus to boost the eurozone economy, the ECB is close to phasing out its asset-purchase program. The ECB plans to trim its monthly purchases from EUR 30 billion to 15 billion in September and wind up the program in December. Is a rate hike next on the menu? Any clues of a change in monetary policy are bound to affect the euro, as the ECB has not raised rates since 2011. Many analysts are predicting a rate hike in the second half of 2019. However, growing global trade tensions could put a wrinkle in plans to raise rates. The European Commission and the International Monetary Fund have lowered 2018 growth forecasts for the eurozone and for Germany. If the tariff slugfest continues, the euro will likely continue to lose ground.
The eurozone economy is in good shape and stronger growth has resulted in higher inflation levels. In June, euorozone CPI improved to 2.0%, reaching this symbolic level for the first time since February 2017. On an annualized basis, Final CPI also came in at 2.0%. If inflation levels continue to rise, there will be pressure on the ECB to consider raising interest rates, although this is an unlikely scenario before next year. The DAX has enjoyed a strong July, posting gains of 4.3%.
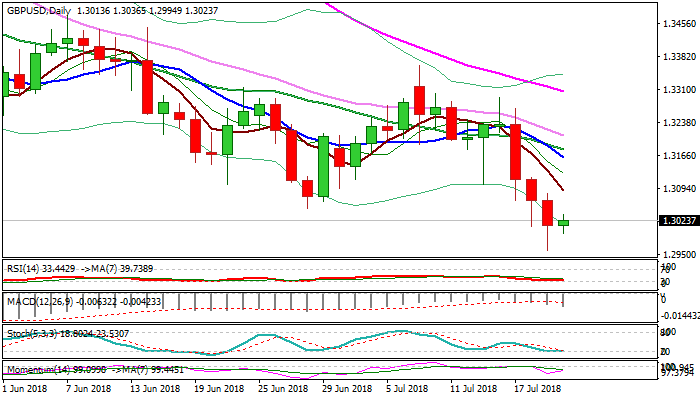
GBPUSD Outlook: Consolidation May Precede Clear Break Below 1.30
Cable is holding within tight consolidation on Friday after steep three-day fall spiked to 1.2957 (the lowest since early Sep 2017).
Initial attempt below psychological 1.30 support failed to close below on Thursday, but sentiment remains weak, following a series of downbeat UK data released this week.
Bears may show stronger hesitation at 1.30 support, with the notion being supported by oversold slow stochastic, but upside action is expected to be limited and seen as positioning for fresh weakness.
The pair is on track for strong bearish weekly close (the second consecutive week in red) and probes below weekly cloud base (1.3026).
Strong bearish signal could be expected on close below weekly cloud and 1.30 handle, for extension towards 1.2905 (05 Sep 2017 low), with stronger acceleration lower, expected to attack next pivotal support at 1.2865 (Fibo 61.8% of 1.1930/1.4376, 2016/2018 uptrend).
Broken former low of 28 June and weekly 100SMA mark solid barriers at 1.3049/77, which should ideally cap and keep intact falling 10SMA (1.3162).
Res: 1.3036, 1.3049, 1.3077, 1.3090
Sup: 1.2994, 1.2957, 1.2929, 1.2905
GBPJPY Remains Bearish As Recent Bounce Runs Out Of Steam In Short Term
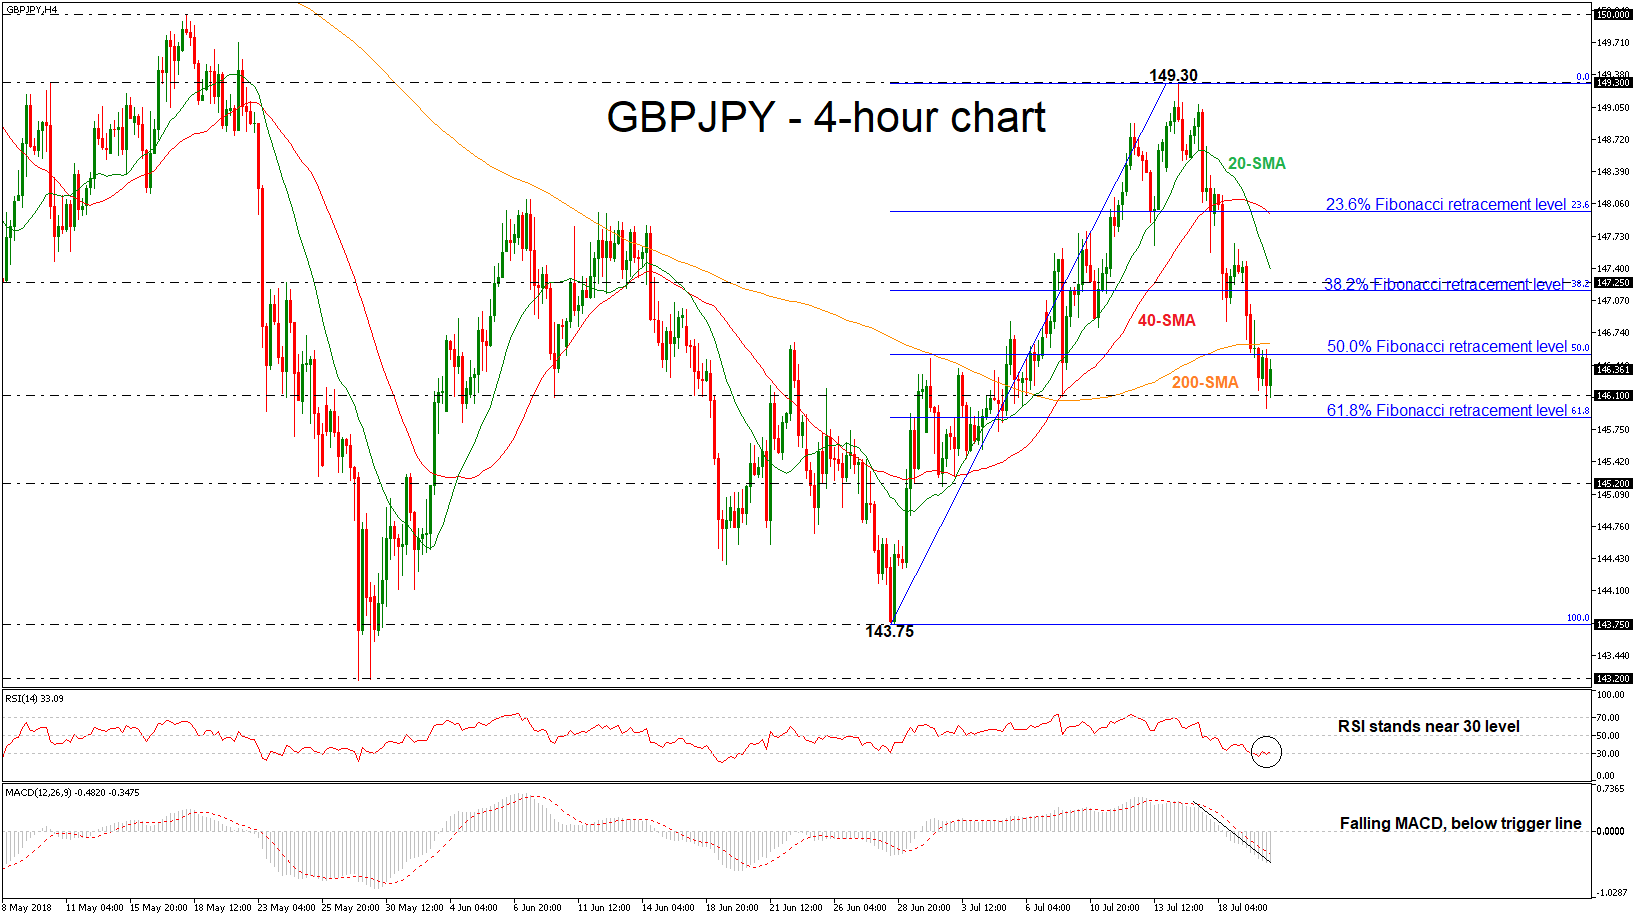
GBPJPY has reversed back down again after finding resistance on the 149.30 high achieved on Monday and completed three straight bearish days. Furthermore, the price tumbled below the 200-simple moving average in the medium-term as well as below the 50.0% Fibonacci retracement level of the upleg from 143.75 to 149.30, near 146.50.
In the 4-hour chart, the momentum indicators are pointing to a negative bias, with the RSI sloping to the downside near the threshold of 30. The MACD oscillator is moving lower in the negative area below its red-trigger line.
In the event of an upside reversal, the 50.0% Fibonacci (146.50) could act as a barrier before being able to re-challenge the 38.2% Fibonacci, which stands slightly below the 147.25 resistance obstacle. A break above this level would shift the short-term bearish outlook to a more neutral one as it would take the price until the 23.6% Fibonacci of 148.00, which holds near the 40-SMA.
On the flip side, further losses should see the 61.8% Fibonacci of 145.87, which it failed to touch early this morning. A drop below this significant hurdle would endorse the bearish picture and push the pair until the 145.20 support.
Overall, GBPJPY seems to be in bearish correction rally and holds well below the short-term moving averages (20 and 40).
However, we have seen the dollar index pulling back from this level on the back of the news that US president isn't happy with the situation. If the president does start to press hard on this issue, we would have a major problem for the dollar index. One thing is for certain, it is in president's favour that the interest rates should remain low given the fiscal policy his team is adopting.
Trump Shows No Respect For The Fed
- Chinese authorities may intervene to stem the weakness in Yuan
- Donald Trump is being vocal again about the Yuan
- Trump extended an invitation to Vladimir Putin
US futures are trading lower on the back of the Trump comments on the Chinese Yuan weakness. The Chinese authorities have shown signs that they may intervene to stem the weakness in the currency. But the fact that Donald Trump is being vocal again about the Yuan weakness is a matter of concern for traders and this is dragging the stock futures lower.
Moreover, there are also concerns about Trump and Putin's meeting. There is very little detail in relation to what both leaders discussed in their first meeting which lasted nearly two hours. The uproar about this meeting has intensified even further after Donald Trump's conflicting statements about this meeting. Investors want clarity and this is far from this. And, now, Trump has extended an invitation to Vladimir Putin for the second summit in Washington.
Another major factor which is also weighing on the market is the independence of the central bank and the tradition of avoiding comments on monetary policy.
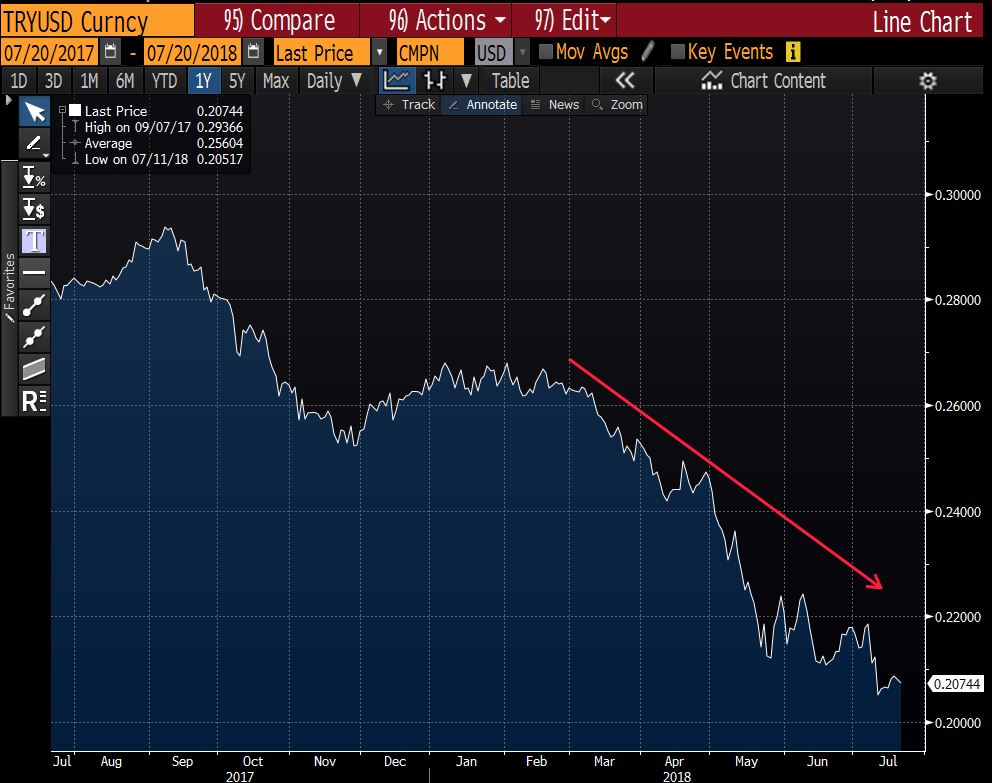
It wasn't a long when we heard the Turkish president, Tayyip Erdogan, showing his discomfort about the central bank's policies. Investors took full action against the currency and traders witnessed the massive sell-off in Turkish Lira. His policy was disliked and criticised not only among institutional investors but also by many other stakeholders around the globe.
Now it is the president of the United States of America, Donald Trump, who has decided that he needs to be vocal about the role that the Federal Reserve Bank is playing. Increase in the interest rate at this pace isn't something that he is going to tolerate.
For the record, the current Fed President, Jerome Powell, is chosen by him. The Fed thinks that they can raise interest rate by two more times this year alone. Jerome Powell, the Fed President, was confident in his latest testimony about the health of the US economy, inflation and the policy which the Fed has adopted.
Obviously, he failed to factor in the fact if the president of the United States is happy or not. Another indicator which perhaps they should put on their dashboard. After Jerome's testimony, the dollar kissed the highest point for the year once again.
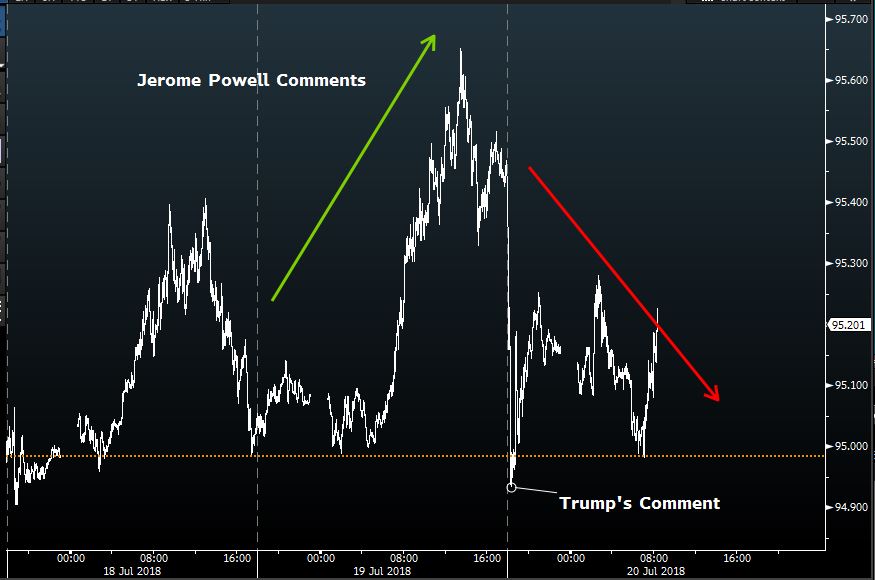
However, we have seen the dollar index pulling back from this level on the back of the news that US president isn't happy with the situation. If the president does start to press hard on this issue, we would have a major problem for the dollar index. One thing is for certain, it is in president's favour that the interest rates should remain low given the fiscal policy his team is adopting.
EUR/USD – Euro Trading Sideways As German Inflation Matches Forecast
EUR/USD almost unchanged in the Friday session. Currently, the pair is trading at 1.1645, up 0.05% on the day. On the release front, German PPI dipped to 0.3%, matching the estimate. The eurozone current account surplus dropped sharply to 22.4 billion. This was well short of the forecast of 27.2 billion and the lowest surplus since June 2017. There are no US events on the schedule.
With the ECB on its way to phasing out its asset-purchase program, the markets are focusing on the timing of a rate hike. After years of monetary stimulus to boost the eurozone economy, the ECB plans to trim its monthly purchases from EUR 30 billion to 15 billion in September, and wind up the program in December. Any clues of a change in monetary policy are bound to affect the euro, as the ECB has not raised rates since 2011. Many analysts are predicting a rate hike in the second half of 2019. However, growing global trade tensions could put a wrinkle in plans to raise rates. The European Commission and the International Monetary Fund have lowered 2018 growth forecasts for the eurozone and for Germany. If the tariff slugfest continues, the euro will likely continue to lose ground.
Trade tensions between the U.S and its major trading partners have raised serious concerns not just with investors, but with Federal Reserve policymakers as well. The Federal Reserve Beige Book for July, released on Wednesday, was rife with references to ‘tariffs’. This trend started in the April Beige Book after President Trump threatened in March to impose tariffs on China. Most of the twelve Fed regional districts referred to tariffs in their individual reports, which make up the Beige Book. Some Fed policymakers have also voiced their concern over the impact that tariffs could have on the U.S economy and is an issue the Fed will have to take into consideration, as it mulls over rate policy for the next six months.
GBPUSD Triangle Pattern Instrumental For Bull Or Bear Break
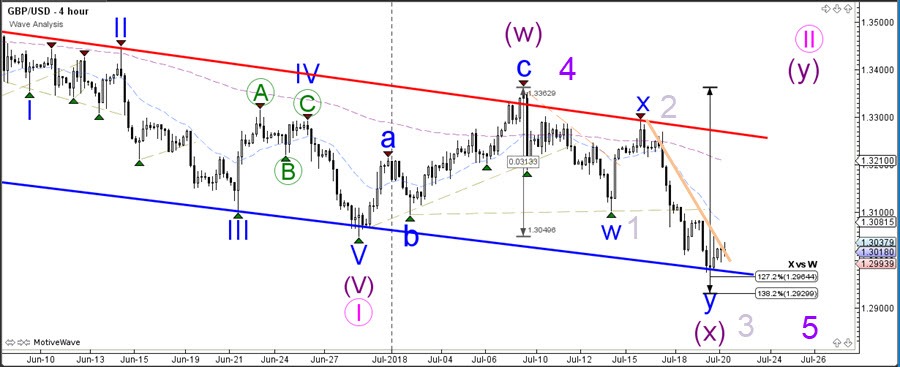
The GBP/USD has reached a key decision zone, which is the support line (blue) of the downtrend channel. The GU will either make a bullish bounce to confirm an expanded WXY (purple) correction or price will break for a continuation of the downtrend via a potential wave 3 (purple).
The GBP/USD break below the 138.2% Fibonacci level would invalidate the wave X (pattern) and confirm an impulsive price swing and wave pattern.
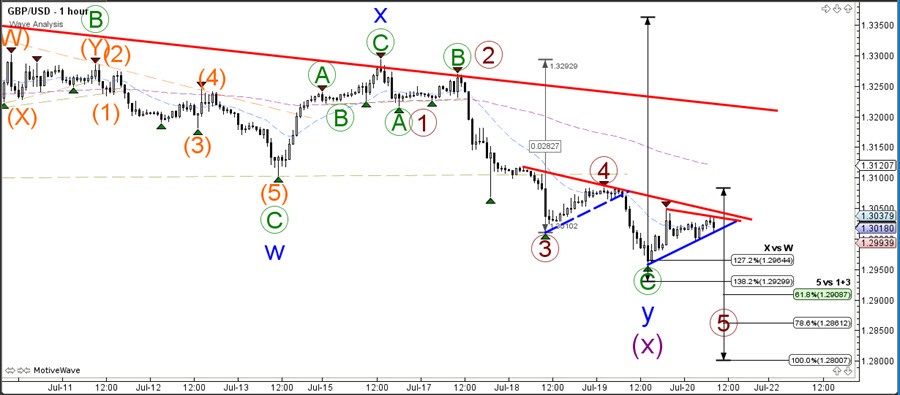
The GBP/USD is building a triangle chart pattern which lends itself for a renewed breakout potential. A bullish break indicates space towards the next resistance level (red) whereas a bearish breakout below support (blue) could indicate a downtrend continuation.
EURUSD Outlook: Bears On Hold After Thursday’s Long-Legged Doji
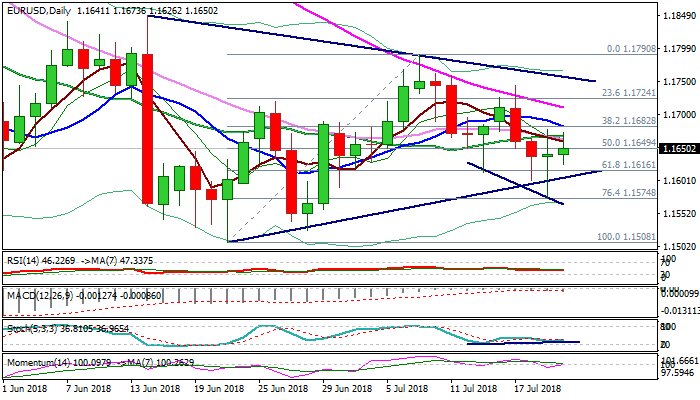
The Euro holds in directionless mode in early Friday's trading after previous day's action ended in long-legged Doji, which signaled strong indecision of past two-day bearish action.
Thursday's dip was contained by Fibo 76.4% of 1.1508/1.1790 (1.1574) but also failed to close below cracked Fibo 61.8% (1.1616), suggesting that bears may be running out of steam.
Fresh bullish momentum supports today's action, together with bullish divergence on daily chart slow stochastic, which could keep the downside protected for the time being.
Recovery needs extension above falling 10SMA (1.1681) to sideline downside risk and open way towards key near-term barrier, provided by falling 55SMA (1.1710).
Bearish scenario requires close below Fibo 61.8% (1.1616) to weaken near-term structure for retest of Thursday's spike low at 1.1574, break of which would signal continuation of bear-phase from 1.1790 towards key support at 1.1508 (1.1508).
Res: 1.1681, 1.1710, 1.1744, 1.1790
Sup: 1.1616, 1.1574, 1.1527, 1.1508
The Analytical Overview of the Main Currency Pairs
The EUR/USD currency pair
Technical indicators of the currency pair:
Prev Open: 1.16366
Open: 1.16417
% chg. over the last day: +0.13
Day's range: 1.16262 – 1.16736
52 wk range: 1.0571 – 1.2557
On the EUR/USD currency pair, an ambiguous technical pattern has occured. The quotes are in a sideways trend. The trading instrument is testing local support and resistance levels: 1.16350 and 1.16750, respectively. Investors expect additional drivers. We recommend opening positions from the key levels.
The news feed on 2018.07.20:
Today, the publication of important economic reports from the US and the eurozone is not planned.
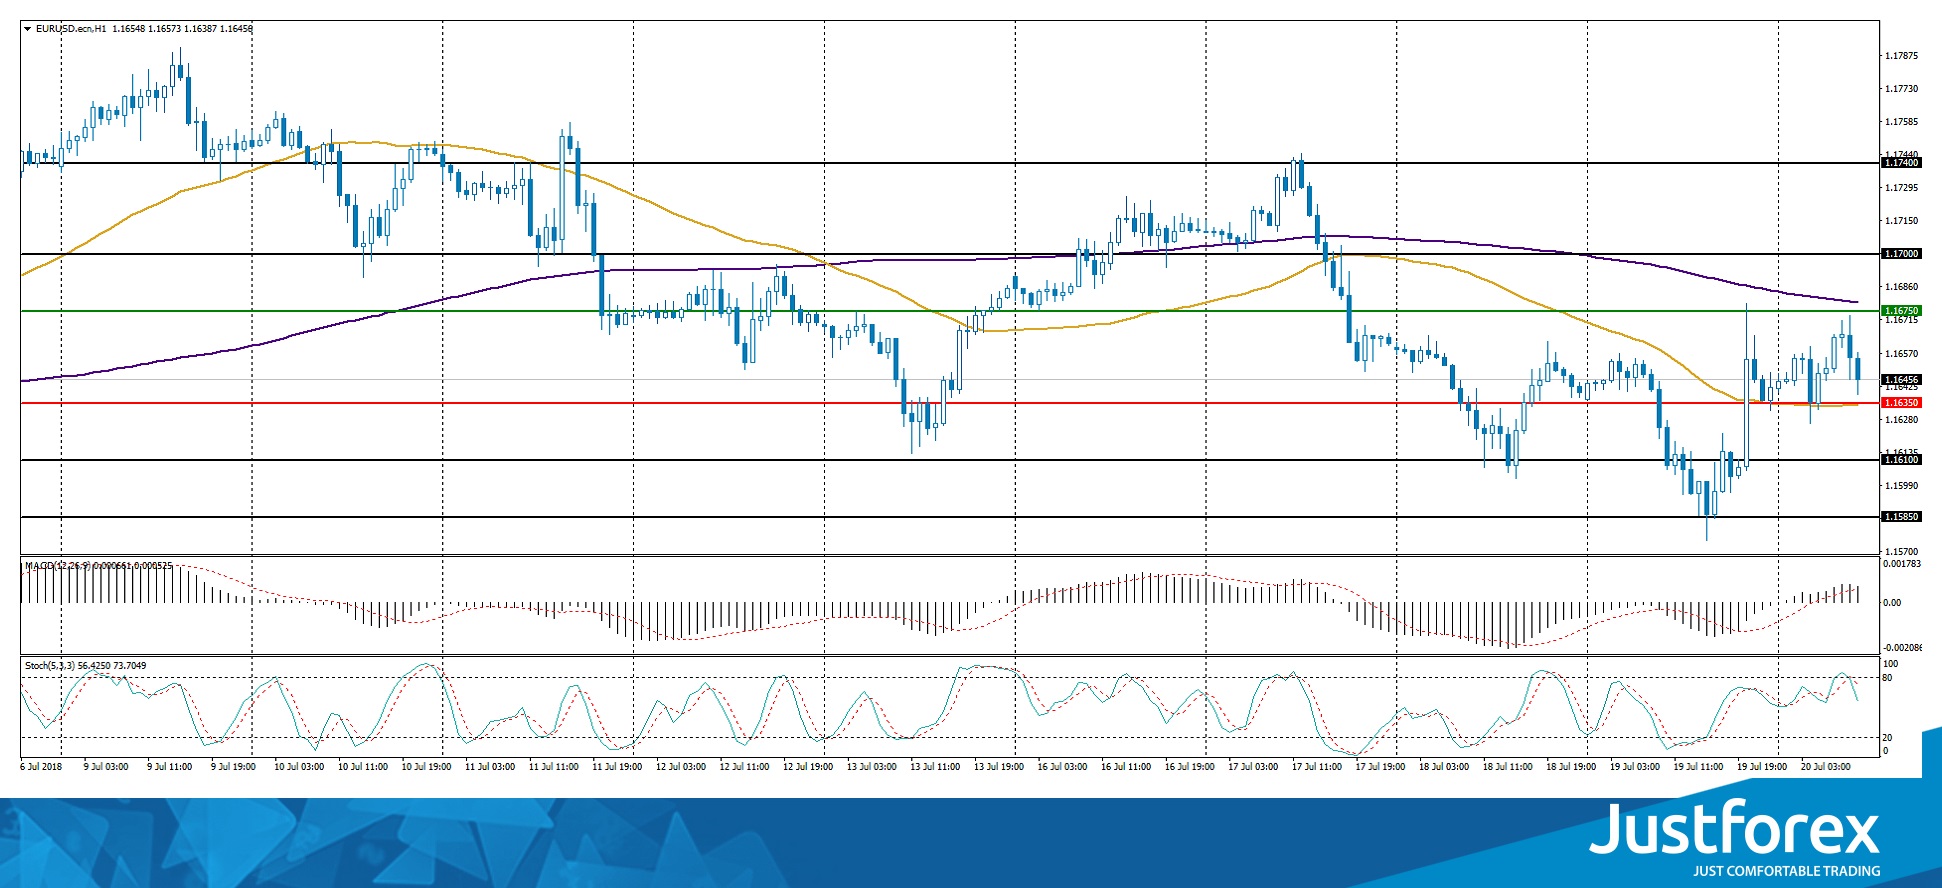
Indicators do not send accurate signals. The price has fixed between 50 MA and 200 MA.
The MACD histogram is located in the positive zone and above the signal line, which indicates the bullish sentiment on the EUR/USD currency pair.
Stochastic Oscillator is in the neutral zone, the %K line is below the %D line, which sends a signal to sell EUR/USD.
Trading recommendations
Support levels: 1.16350, 1.16100, 1.15850
Resistance levels: 1.16750, 1.17000, 1.17400
If the price fixes below 1.16350, EUR/USD is expected to fall. The movement is tending to 1.16100-1.15850.
Alternative option. If the price above fixes the resistance level of 1.16750, it is necessary to consider buying EUR/USD. The movement is tending to 1.17000-1.17400.
The GBP/USD currency pair
Technical indicators of the currency pair:
Prev Open: 1.30659
Open: 1.30131
% chg. over the last day: -0.36
Day's range: 1.29949 – 1.30366
52 wk range: 1.2361 – 1.4345
Currently, GBP/USD is consolidating. The technical pattern is ambiguous. The key support and resistance levels are 1.30000 and 1.30400, respectively. Pressure on the pound is put by a weak report on retail sales in the UK. In June, retail sales in the country fell by 0.5%. Experts expected the growth rate of 0.1%. Positions must be opened from the key levels.
The news feed on the UK economy is calm.
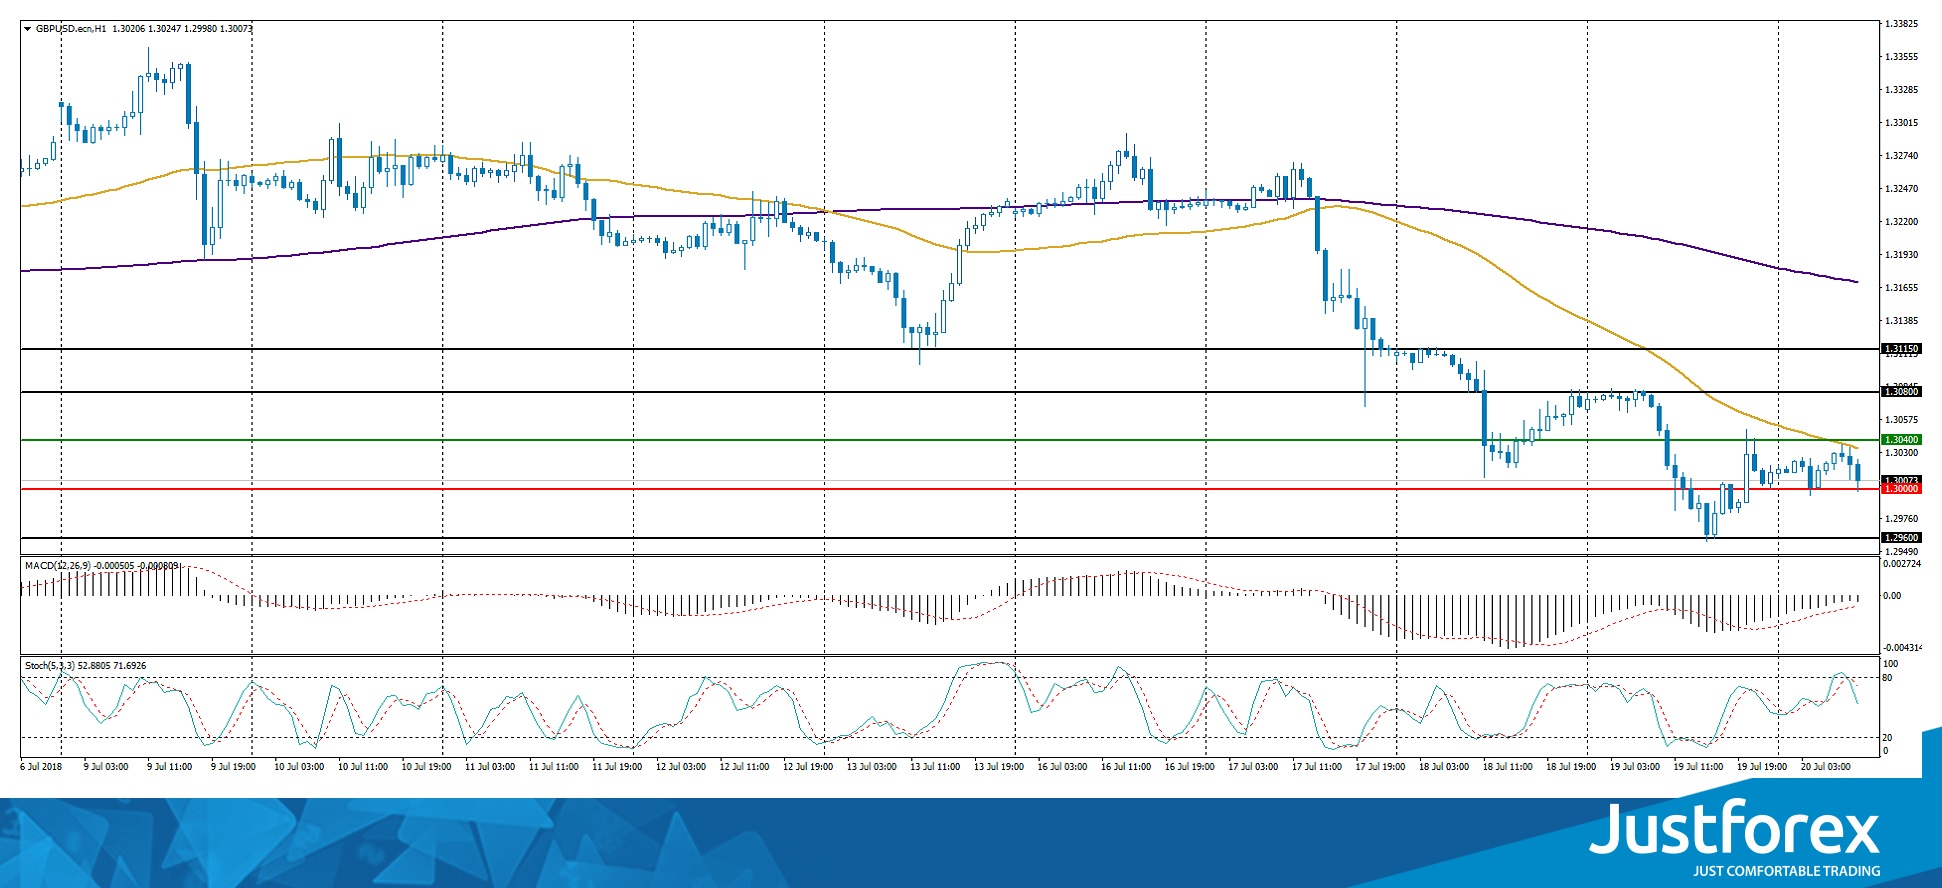
Indicators point to the power of sellers. The price has fixed below 50 MA and 200 MA.
The MACD histogram is in the negative zone, but above the signal line, which gives a weak signal to sell GBP/USD.
Stochastic Oscillator is located in the neutral zone, the %K line is below the %D line, which also sends a signal to sell GBP/USD.
Trading recommendations
Support levels: 1.30000, 1.29600
Resistance levels: 1.30400, 1.30800, 1.31150
If the price falls below the round level of 1.30000, a further drop in GBP/USD is expected. The movement is tending to 1.29600-1.29500.
Alternative option. If the price fixes above 1.30400, it is necessary to consider buying GBP/USD. The movement is tending to 1.30750-1.31000.
The USD/CAD currency pair
Technical indicators of the currency pair:
Prev Open: 1.31654
Open: 1.32706
% chg. over the last day: +0.68
Day's range: 1.32461 – 1.32897
52 wk range: 1.2059 – 1.3795
At the moment, the USD/CAD currency pair is consolidating near the monthly highs. A unidirectional trend is not observed. The key trading range is 1.32500-1.32800. In the near future, a technical correction is not ruled out. Investors are awaiting the publication of important economic reports from Canada. Positions must be opened from the key levels.
At 15:30 (GMT+3:00) data on inflation and retail sales in Canada will be published.
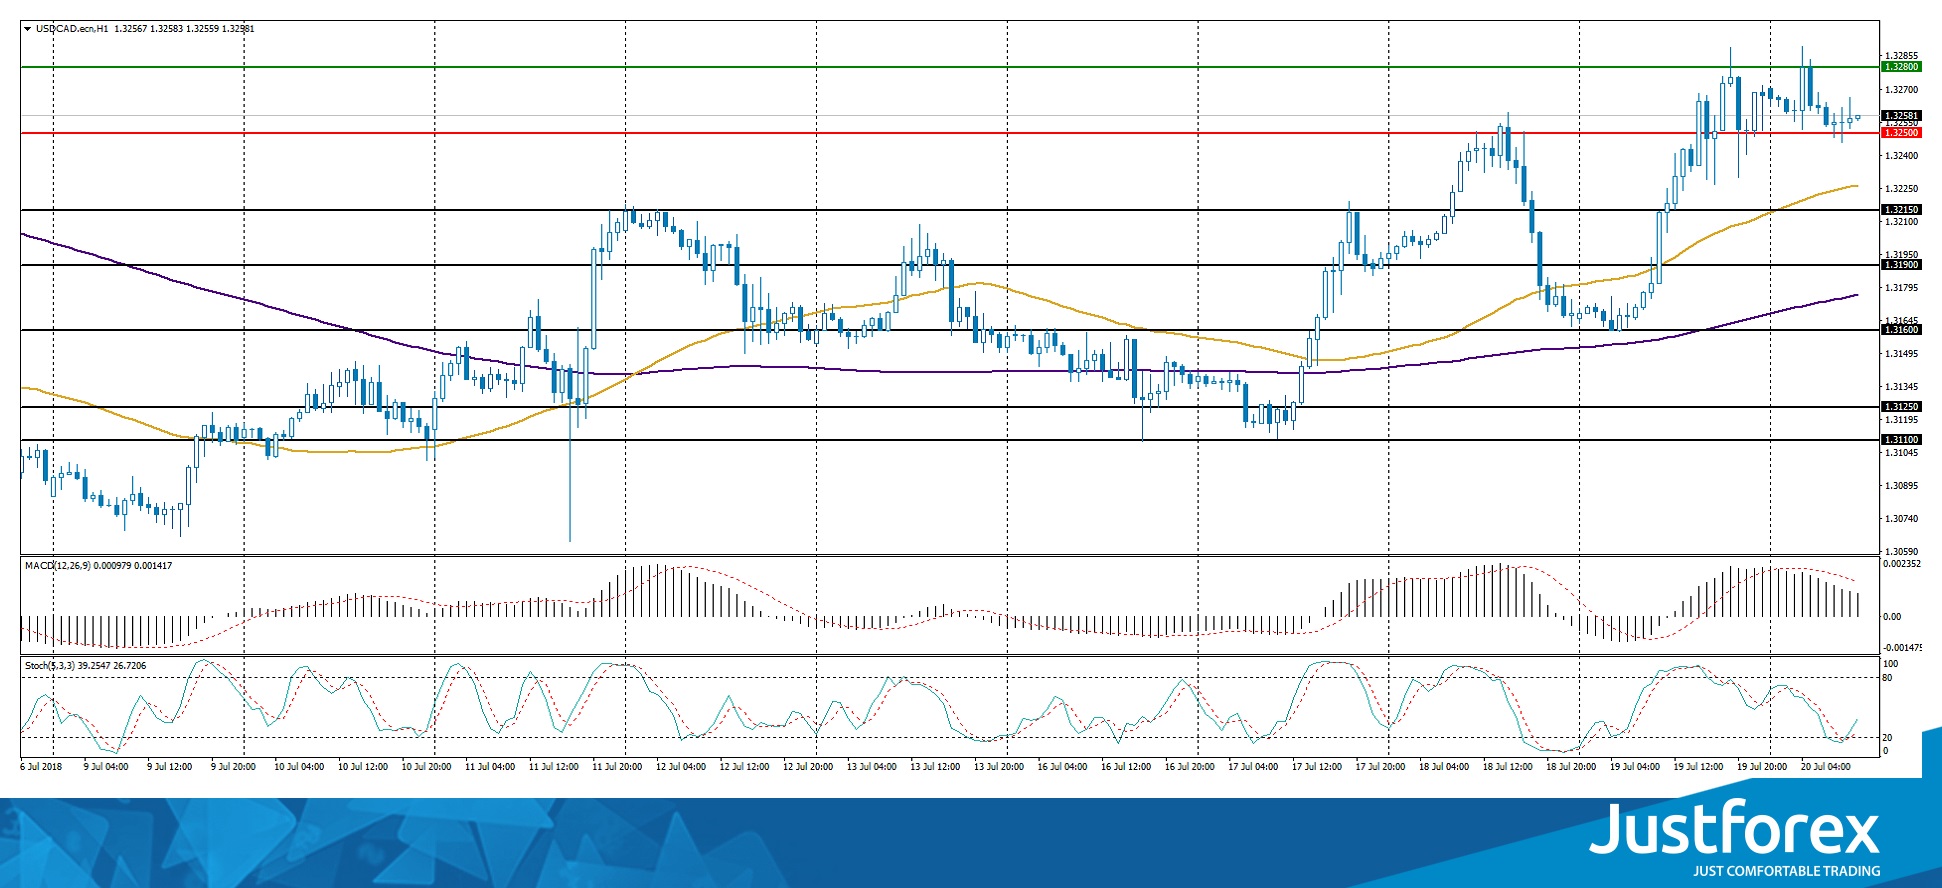
The price has fixed above 50 MA and 200 MA, which indicates the power of buyers.
The MACD histogram is in the positive zone, but below the signal line, which gives a weak signal to buy USD/CAD.
Stochastic Oscillator is located in the neutral zone, the %K line is above the %D line, which indicates the bullish sentiment.
Trading recommendations
Support levels: 1.32500, 1.32150, 1.31900
Resistance levels: 1.32800, 1.33250
If the price fixes below the support level of 1.32500, correction movement is expected. The movement is tending to 1.32150-1.32000.
If the price fixes above 1.32800, you need to look for entry points to the market to open long positions. The target movement level is 1.33000-1.33250.
The USD/JPY currency pair
Technical indicators of the currency pair:
Prev Open: 112.829
Open: 112.430
% chg. over the last day: -0.43
Day's range: 112.208 – 112.622
52 wk range: 104.56 – 114.74
Yesterday, the bearish sentiment prevailed on the USD/JPY currency pair. The trading instrument updated local extremes. At the moment the quotations are consolidating in the range 112.200-112.550. Further correction of the USD/JPY quotes is expected. We recommend opening positions from the key support and resistance levels.
The news feed on the economy of Japan is calm.
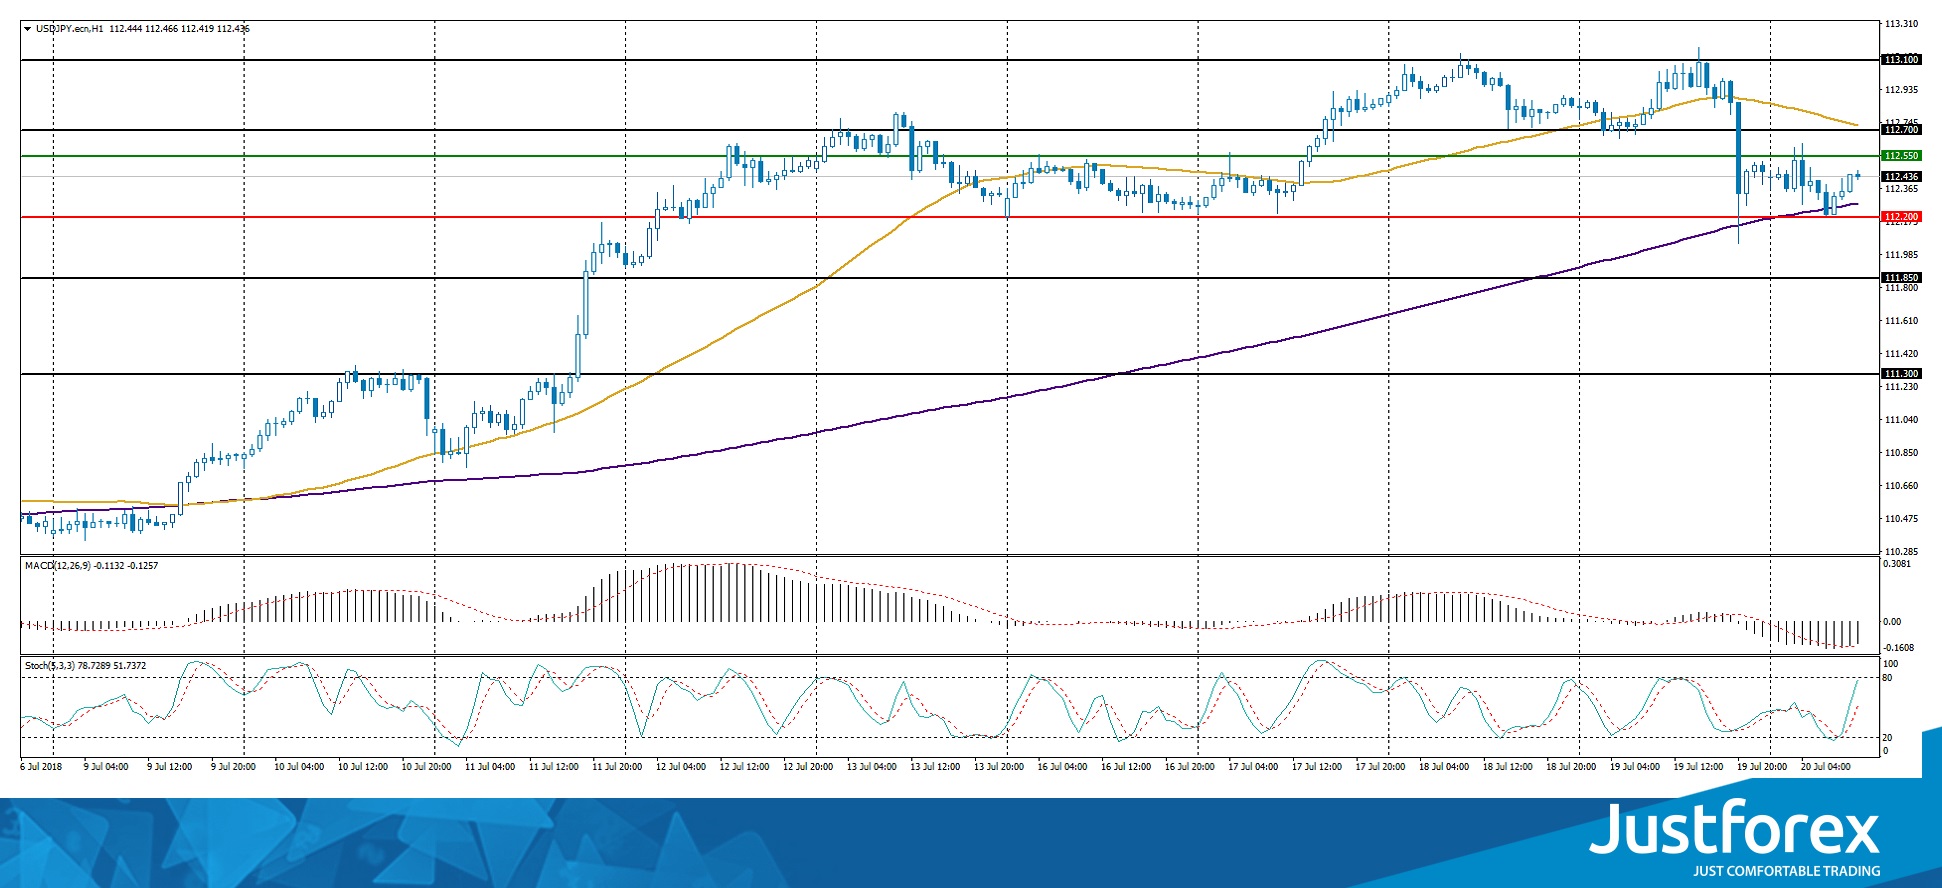
Indicators do not send accurate signals. The price has fixed between 50 MA and 200 MA.
The MACD histogram is in the negative zone, but above the signal line, which gives a weak signal to sell USD/JPY.
Stochastic Oscillator is located in the neutral zone, the %K line is above the %D line, which indicates the growth of USD/JPY.
Trading recommendations
Support levels: 112.200, 111.850, 111.300
Resistance levels: 112.550, 113.100
If the price fixes below 112.200, further correction of the USD/JPY currency pair is expected. The movement is tending to 111.850-111.500.
Alternative option. If the price fixes above the 112.550 level, one should consider buying USD/JPY. The movement is tending to the round level of 113.000.
USD/JPY Ascending Trend Line Holds The Trend In Place
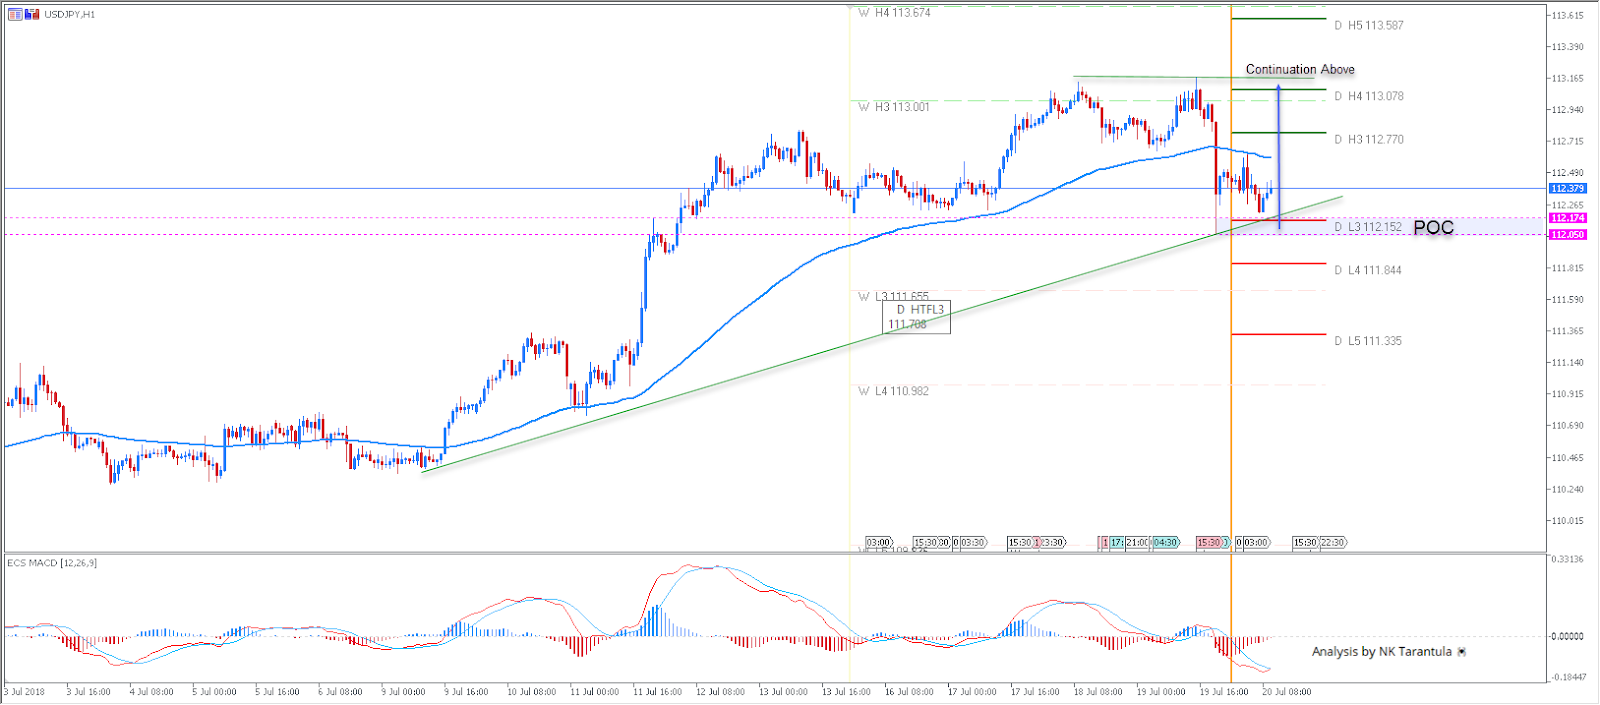
The USD/JPY lost its ground above 113.00 after US president Trump's comments regarding rate hikes. Currently, the POC zone is 112.05-17. There is also an ascending trend line that is holding the trend in place and serves as the additional confluence. A bounce from the POC targets 112.77 and 113.07. Only above 113.20 we might see 113.60.
W L3 - Weekly Camarilla Pivot (Weekly Interim Support)
W H3 - Weekly Camarilla Pivot (Weekly Interim Resistance)
W H4 - Weekly Camarilla Pivot (Strong Weekly Resistance)
D H4 - Daily Camarilla Pivot (Very Strong Daily Resistance)
D L3 – Daily Camarilla Pivot (Daily Support)
D L4 – Daily H4 Camarilla (Very Strong Daily Support)
POC - Point Of Confluence (The zone where we expect price to react aka entry zone)
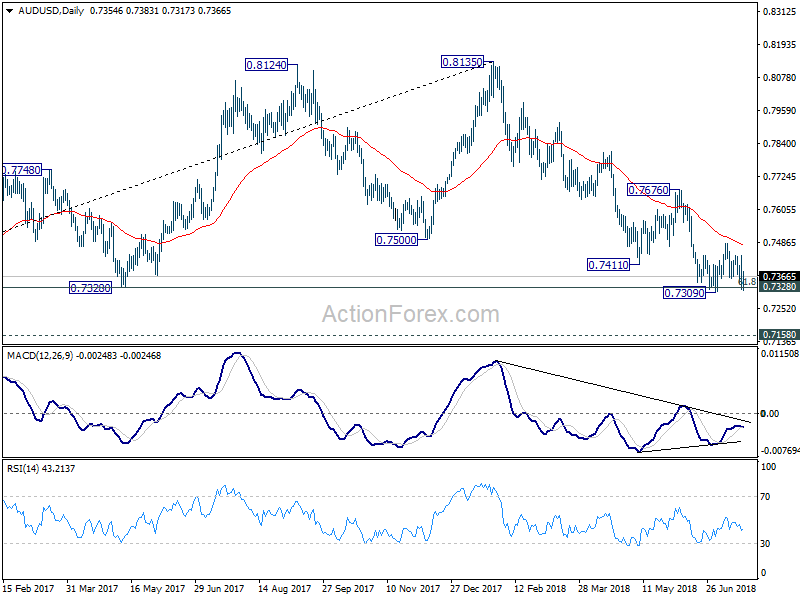
AUD/USD Daily Outlook
Daily Pivots: (S1) 0.7306; (P) 0.7374; (R1) 0.7425; More...
AUD/USD failed to break 0.7309 low and recovered. Intraday bias is turned neutral first. Outlook remain bearish though and downside breakout is expected sooner or later. Decisive break of 0.7309 and sustained trading below 0.7328 cluster support (61.8% retracement of 0.6826 to 0.8135 at 0.7326) will extend the fall from 0.8135 to 0.7158 support next. On the upside, in case of another rise, upside should be limited below 0.7676 resistance to bring larger fall resumption eventually.
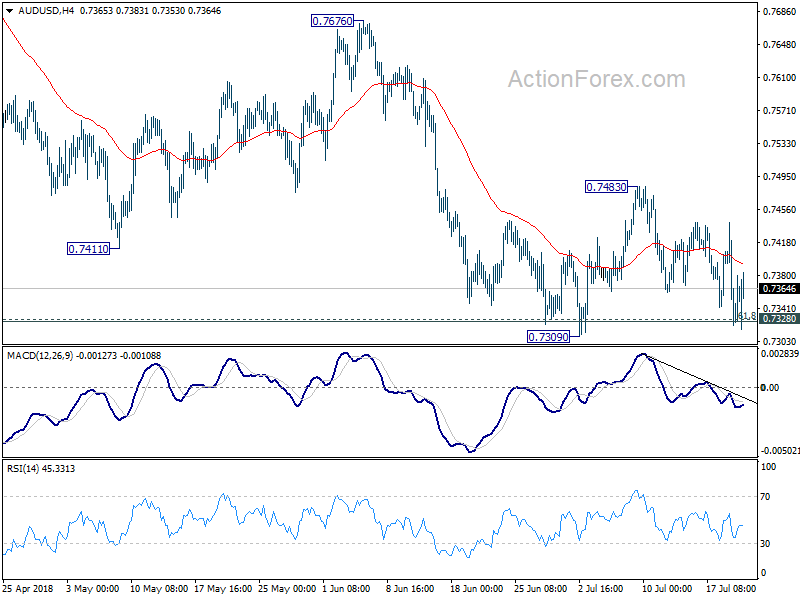
In the bigger picture, medium term rebound from 0.6826 is seen as a corrective move that should be completed at 0.8135. Deeper decline would be seen back to retest 0.6826 low. This will now remain the favored case as long as 0.7676 resistance holds.