Sample Category Title
GOLD – Remains Weak And Vulnerable On Bear Pressure
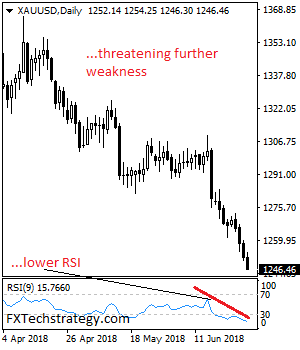
GOLD - The commodity weakened further on Thursday leaving risk of more weakness on the cards. On the downside, support comes in at the 1,240.00 level where a break will turn attention to the 1,230.00 level. Further down, a cut through here will open the door for a move lower towards the 1,220.00 level. Below here if seen could trigger further downside pressure targeting the 1,210.00 level. Conversely, resistance resides at the 1,260.00 level where a break will aim at the 1,270.00 level. A turn above there will expose the 1,280.00 level. Further out, resistance stands at the 1,290.00 level. All in all, GOLD looks to weaken further on bear pressure.
Eco Data 6/29/18
[php_everywhere instance="1"]
Wobbly Gold Slips Below $1250, U.S GDP Disappoints
Gold has posted small gains in the Thursday session. In the North American session, the spot price for one ounce of gold is $1250.63, down 0.17% on the day. On the release front, U.S numbers were soft for a second straight day. U.S Final GDP in the first quarter slipped to 2.0%, missing the estimate of 2.2%. Unemployment claims jumped to 227 thousand, well above the estimate of 220 thousand. On Friday, the U.S will publish consumer spending and inflation data, as well as UoM Consumer Sentiment.
Gold prices continue to point lower, as the metal has posted losses in 9 of the last 10 daily sessions. During that time, gold has declined 4.0 percent. Earlier on Thursday, gold dropped to $1248, setting a record low in 2018. Traditionally, gold acts a safe-haven asset during times of trouble, but that hasn’t been the case in the escalating tariff battle between the U.S and China. Investors are increasingly worried that if the tariff battles continue, growth will slow in both the U.S and China, and the result could be a global recession. If the Trump administration makes good on its threat to impose additional tariffs on the China and the European Union, gold prices could continue to spiral downwards.
U.S economic numbers have looked soft for a second straight day. On Thursday, Final GDP dipped to 2.0%, weaker than the second estimate of GDP in May, which showed growth of 2.0%. Much of the slowdown is being attributed to weaker consumer spending in the first quarter. There are expectations of banner growth in the second quarter, with some analysts predicting growth of over 5 percent, as the massive January tax cut should boost economic growth. However, the escalating trade war between the U.S and its trading partners, especially China, could dampen second quarter GDP. Trade tensions show no sign of easing, with President Trump threatening tariffs on some $250 billion in Chinese goods. On Wednesday, U.S durable goods reports in May were a disappointment. Core durable goods orders declined 0.3%, well of the estimate of 0.5% and a 4-month low. Durable goods orders declined for a second straight month, with a reading of -0.6%. Still, this was better than the forecast of -0.9%.
Pound Under Pressure ahead of British Current Account, GDP
The British pound is under pressure, as GBP/USD has headed lower for a third straight day. In Thursday’s North American session, the pair is trading at 1.3093, down 0.16% on the day. On the release front, U.S Final GDP in the first quarter slipped to 2.0%, missing the estimate of 2.2%. Unemployment claims jumped to 227 thousand, well above the estimate of 220 thousand. Later in the day, the U.K will release GfK consumer confidence, which is expected to remain unchanged at -7 points. On Friday, there are a host of key events on both sides of the pond. The U.K releases current account and Final GDP and the U.S will publish consumer spending and inflation data, as well as UoM Consumer Sentiment.
In the U.S, Final GDP dipped to 2.0%, weaker than the second estimate of GDP in May, which showed growth of 2.0%. Much of the slowdown is being attributed to weaker consumer spending in the first quarter. There are expectations of banner growth in the second quarter, with some analysts predicting growth of over 5 percent, as the massive January tax cut should boost economic growth. However, the escalating trade war between the U.S and its trading partners, especially China, could dampen second quarter GDP. Trade tensions show no sign of easing, with President Trump threatening tariffs on some $250 billion in Chinese goods. On Thursday, U.S durable goods reports in May were a disappointment. Core durable goods orders declined 0.3%, well of the estimate of 0.5% and a 4-month low. Durable goods orders declined for a second straight month, with a reading of -0.6%. Still, this was better than the forecast of -0.9%.
European leaders are meeting for a crucial 2-day summit on Thursday, and one of the top items on the agenda will be Brexit. The sides remain far apart on a number of issues, with Britain scheduled to leave the club in March 2019. The EU had said that it wanted issues such as the Irish border to be resolved by the June summit, but this won’t happen, and the EU will now have to set another deadline, with time running out. There have been various suggestions for a type of customs union arrangement between Ireland and Northern Ireland, but the May government is split on the issue. European leaders are exasperated with the lack of progress in the Brexit talks and could issue a tough statement that the EU could split from Britain without an agreement in place.
China’s Mountain of Debt a Long-Term Challenge to Global Growth
Highlights
- China's rapid accumulation of government, household and corporate debt – particularly since 2009 – raises concerns about the risk of a China-centric financial crisis that could trigger a global economic downturn. Chinese authorities have made some progress on curbing credit growth through a combination of ongoing structural reforms, but more still needs to be done.
- The government faces the difficult balancing act of weaning China's economy off debt-intensive activities while not fueling a dramatic and undesired economic slowdown. The result has been a further, though recently more moderate, increase in the debt-to-GDP ratio.
- U.S. tariffs pose a relatively small risk to the growth outlook for China over the next six quarters. As such, the anticipated drag on economic growth from the announced tariffs is unlikely to result in a sufficient shock to trigger a deleveraging episode. Instead, the tariffs are likely to impede progress by Chinese authorities in trying to wean the Chinese economy off of its credit addiction.
- Over the next few years we anticipate that China will stay the course on credit and product market reforms that gradually bring down debt growth to under that of nominal GDP. Ultimately, however, a debt-restructuring will be necessary to address the mountain of legacy borrowing.
- This process of deleveraging poses risks to the global economy. Still, these risks are mitigated by a number of factors, including China's relatively closed banking system, its current account surplus, and high domestic savings rate. Moreover, a strong economic growth outlook should ensure government more than enough fiscal space to absorb the cost of a debt restructuring.
Global growth has recovered from the doldrums of the financial crisis, and China has been a big part of the recovery story, having recorded growth averaging a healthy 8.1% annually over the past decade. As a result, China has become the largest economy in the world, comprising 17.7% of global economic activity on a purchasing power parity basis (2016 weights). This pace of economic growth largely reflects strong, above-trend advances in the immediate aftermath of the financial crisis; growth since 2014 has averaged 7%, and is expected to slow to around 6.5% this year.
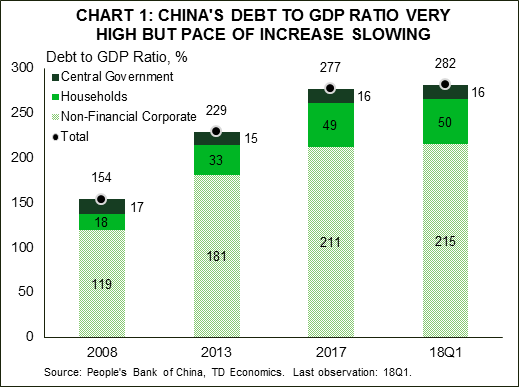
China's rapid growth has not come without a cost. In order to maintain a high level of economic activity, authorities have relied upon boosting investment spending, which in turn has been fueled by the creation of new debt. Indeed, the rapid run-up in debt in China over the past decade has hit a peak of 282% of GDP as at the first quarter of 2018 (Chart 1), raising concerns about the sustainability of China's investment-driven economic growth model. With such a large global economic footprint, an eventual deleveraging episode could post a substantial drag on global economic activity, and possibly trigger a global recession.
Historically, rapid increases in credit have often been followed by a deleveraging cycle, either via a dramatic slowdown in credit growth or an outright contraction in the stock of debt via write-offs. In some cases, a deleveraging episode can result in a dramatic but brief decline in demand, followed by a prolonged gradual recovery, such as that observed in the 2009 financial crisis.1 In the case of China, this could see economic growth fall more than half to a 2-3% pace from its current pace of growth of about 6.5-7%, largely owing to a collapse in investment spending.2
Such a scenario would likely shave off more than 0.7 percentage points off annual global economic activity. In addition, a large decline in Chinese growth could send ripples through the global financial system, as debt-laden Chinese firms and financial intermediaries may have to shed foreign assets to restore balance sheet health. A large devaluation in the renminbi would surely follow, alongside intervention by the People's Bank of China, with fears of rising domestic inflation facilitating an acceleration of capital outflows from China to safer foreign assets.
While much is at stake, there appears little risk of a China-led global financial crisis over the next few years. For one, foreign investment in China has been limited, including foreign bank lending to the Middle Kingdom. More recently Chinese authorities have promised to nudge the door open to more foreign investment, but foreign banking claims currently remain low given the extensive trade linkages with the U.S. and Europe. Chinese authorities have prioritized rebalancing of the economy away from investment-heavy, debt-fueled growth, and toward less debt-intensive service industries.3 Moreover, authorities have made strides in shutting down excess capacity in inefficient and underperforming industries such as steel manufacturing. But, as GDP growth has eased in lockstep, these measures have thus far only managed to slow the upward climb in the overall debt ratio. Further, these efforts have done little to deal with the legacy of past debts that have accumulated over the years.
As authorities continue to gradually wean the economy off its debt reliance, we see the pace of debt accumulation slowing from last year's clip of 9.2% towards 6% over the next few years, below our expectations for nominal GDP growth. Ultimately, the large amount of legacy debt will have to be restructured, which is a process that has been attempted in fits and spurts by Chinese authorities with limited success in the past few years. Excessive debt is not a new problem for China. Since 1980, China has undertaken three restructuring episodes for bank debt, and its central bank bailed out a number of lenders in the 2000s after they had become saddled with bad loans. Under the assumption that market reforms and gradual debt restructuring process are well executed, financial stability risks posed from the elevated stock of legacy debt should slowly lessen.
How could the US-China trade spat impact the outlook?
In recent weeks, all eyes have turned to the growing trade spat between China and the United States, which has raised questions around the potential impacts on the Chinese economy and on the government's financial and market reform efforts. We address these risks in the accompanying text box. In a nutshell, the situation remains fluid and much will depend on whether U.S. actions dissolve into an escalating global trade war and significant erosion in financial market sentiment. Still, the effect of import tariffs (both those poised to be implemented beginning July 6 and recent threats of further retaliation) would most likely delay but not derail progress made by Chinese authorities to scale back the economy's credit addiction.
A survey of China's debt mountain from below
China's dramatic accumulation in debt since 2008 is best exemplified in Chart 1, which shows the debt-to-GDP ratio of China by sector. Although all sectors have added to the total, the non-financial corporate sector, including state-owned enterprises, and the household sector really stand out. However, it's important to note that this debt is owed largely to Chinese firms and citizens, limiting the potential for a shock to spillover to China's major trading partners. According to the BIS, foreign banking sector claims on China (on an ultimate risk basis) amounted to just 2.7% of GDP in 2017. In comparison, foreign banking sector claims on the U.S. amounted to about 30% of GDP.4
This rise in debt over the last decade is partly a stimulus story. In response to the global economic downturn, Chinese authorities brought forward a number of infrastructure and investment-heavy projects and effectively subsidized lending to underperforming industries in order to keep them solvent.
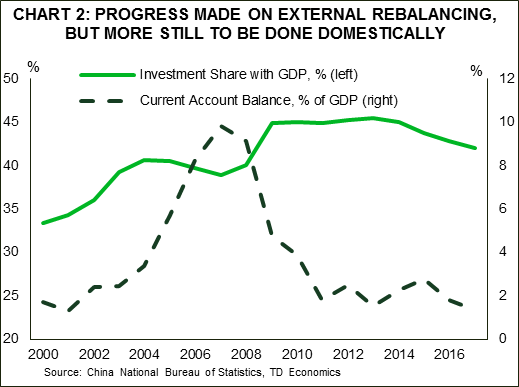
Looser financial conditions post-crisis helped hasten the run-up in debt. Low borrowing rates encouraged Chinese households to invest in real estate, pushing up house prices and household debt to new highs while also supporting the construction sector. At the same time, government and corporate spending helped to drive fixed asset investment to a record 45% of nominal GDP (Chart 2). To provide some perspective, the ratio for Canada and the U.S. has historically averaged about 22%, while developing nations such as India have an elevated ratio near 30%, far below that of China's.
At the time, China's stimulus was welcomed by international agencies as it helped create a sink for exports, particularly for commodities and machinery and equipment, at a time when global demand was very weak. Moreover, the employment-intensive construction sector was an obvious choice for Chinese authorities that aim to ensure social harmony at any cost. Any financial stability concerns about the rapid accumulation of debt were brushed aside.
By 2014, as global economic growth gained firmer footing, concerns started to mount about China's investment-heavy and debt-fueled growth. Stories of ghost cities became frequent, with analysts coalescing on the view that China had overbuilt infrastructure that could be underutilized for a decade or more. Also, the impulse to growth from past stimulus had waned significantly by then, and Chinese growth had slowed to just over a 7% annual pace from the roughly 8% pace of the previous two years. This fueled concerns about how the accumulated debt would be paid off.
In response, Chinese authorities devised strategies to gradually make economic growth less dependent upon credit-intensive industries like manufacturing and construction and toward consumption and service industries. Most popular measures to date include:
- The shutdown of unprofitable firms in overcapacity and heavy polluting industries. This ensures that they are no longer being kept afloat by refinancing with newly issued debt.
- Rationing credit for households to restrict housing market activity, with the consequence of also slowing home price growth.
- Cracking down on the shadow banking sector, forcing transparency in how financial intermediaries are utilizing off balance sheet vehicles.
These measures have worked both to make economic activity more dependent on services, and to effectively tighten financial conditions in China (Chart 3).5
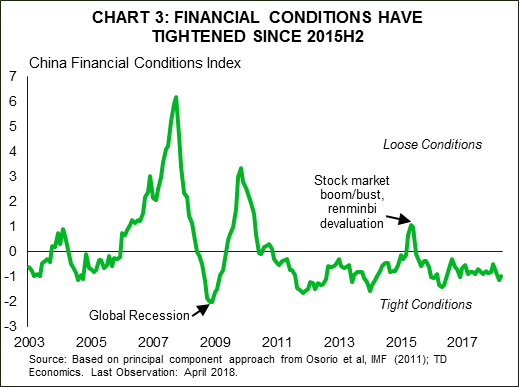
As the economy has rebalanced, the government has been generally successful in reducing credit growth particularly in the non-financial corporate and government sector. Progress however, has been slow. Authorities have found it easier to reduce frenzied speculation in the housing market by rationing credit to the household sector. However, both local government debt and non-financial corporate debt has continued to build.
For firms, bank loans, entrusted and trust loans remain the dominant forms of firm finance despite efforts by authorities to develop a market for corporate bonds. A sizable portion of these loans are non-performing, and may even be backed by household wealth management products that promise guaranteed returns (Chart 4). The risk of course is that if the loans turn sour, banks will have to come up with a way to payback investors, which in the least could reduce bank lending to the economy, and may force Chinese authorities to loosen domestic credit conditions in order to ensure adequate liquidity.
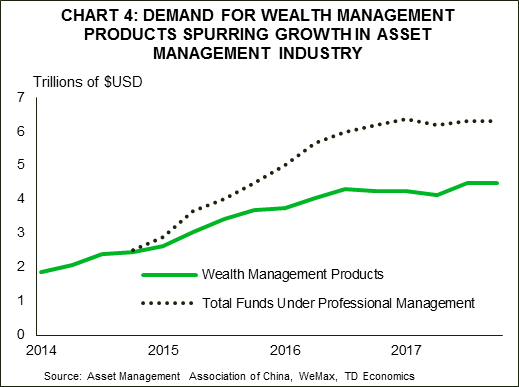
State-Owned Enterprises (SOEs) account for a large proportion of non-financial corporate debt. Based on 2017 OECD estimates, the liability to asset ratio of non-financial state-owned enterprises rose from 51% in 2006 to around 60% in 2015, while the ratio of other non-financial corporates stabilized at 55% over the same period. What's more, the main driver of the advance was short-term debt. However, the government had noticed the high debt ratio and low productivity of SOEs, and therefore announced its plan to reform them in 2014. These largely constitute firms in the mining and manufacturing industries, some of which are critical to regional economies. The reform process remains challenging. With the private sector effectively subsidizing the SOEs, the mixed ownership not only increases the overall return of a notoriously underperforming sector but also raises volatility.
Since bank loans remain the largest source of financing for SOEs, the health of Chinese banks is always in question. Estimated non-performing loans in the IMF's April 2018 Global Financial Stability Report show that less than 2% of total loans are considered distressed (Chart 5). Bank provisions required to protect balance sheets against non-performing loans (NPLs) has pushed the share of provisions-to-NPLs to over 181%, the highest ratio of all reporting countries suggesting that Chinese banks have set enough capital aside to weather a surge in bad loans. That said, the official measure of non-performing loans likely ignores a number of that have been moved off-balance sheet during the period at the end of 2015 when some of these loans were securitized as corporate debt.
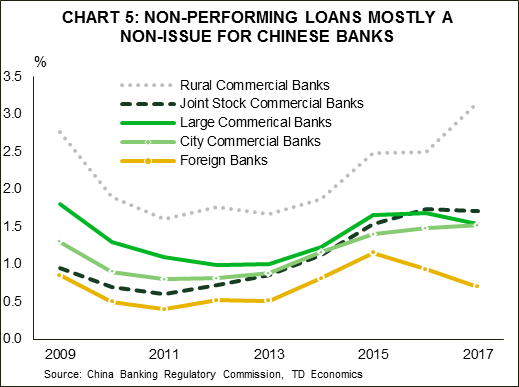
Eerily reminiscent of advanced economy banks prior to the financial crisis, Chinese banks have embraced off balance sheet vehicles, with shadow banking sector assets rising to over 83% of GDP in 2017. Although often assumed to be a blind spot for regulators, authorities in China have done a good job of keeping track of these sorts of lending and are aware of the risks that they pose to its financial sector.
Efforts to rein in excesses paying off
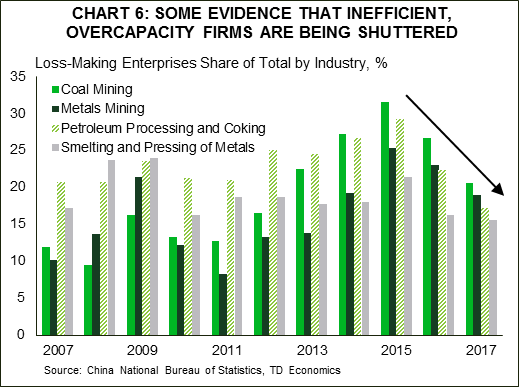
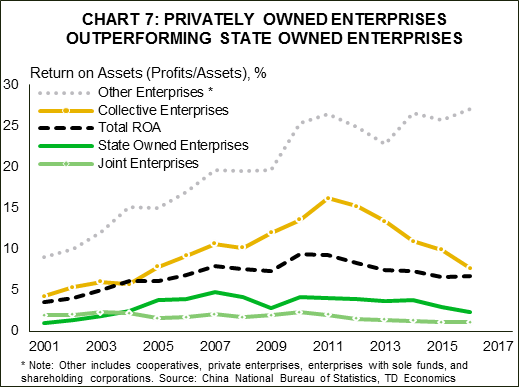
As part of the effort to rein in excess debt, authorities in China have worked to reduce excesses in inefficient and underperforming industries, including shutting down underperforming firms. Since 2015, loss making enterprises in overcapacity industries, such as mining and metals refining, have fallen considerably (Chart 6). Moreover, the adoption of market reforms since 2000 appears to be paying off. As an example, private enterprises have the highest return on assets at about 25% in 2017, while collective enterprises (including SOEs) have generally fared more poorly (Chart 7). Although part of the fall in performance of SOEs could be due to a compositional shift of high-performing SOEs to private enterprises, the trend towards private ownership will likely continue. The strong performance by private enterprises and the trend toward more private ownership may provide an offset to the legacy of underperforming SOE's, and suggests further progress toward the goal of improving economy-wide productivity.
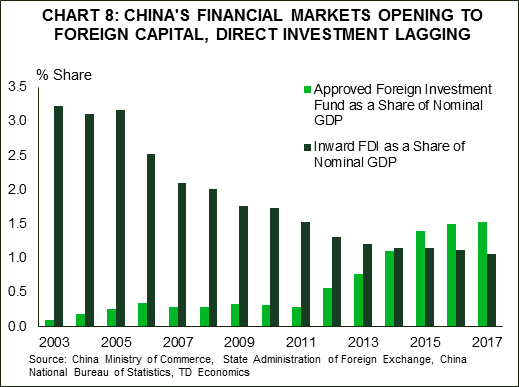
The shift toward private ownership has coincided with promises to open up China's economy to more foreign investment. This was a message from February's World Economic Forum, and something President Xi reiterated at April's Boao in Asia (Asia's version of the World Economic Forum). There is evidence that China has already begun to open up more to foreign capital. Foreign investment in China's capital markets rose to about 1.5% of nominal GDP in 2017 from less than 0.5% in 2011 (Chart 8). However, China has not allowed for greater foreign direct investment (FDI). In 2017, inward FDI was 1% of nominal GDP, down from 3.0% in the early 2000s. In other words, China is still very reluctant to let foreign firms and investors own Chinese companies or business interests directly.
At the same time, China has been fairly aggressive in its efforts to encourage firms to diversify operations and assets across industries and other countries. Chinese firms have acquired foreign automobile manufacturers (e.g. Volvo owned by Geely since 2010), and even soccer teams (e.g. 2016 purchase of Italy's AC Milan by Sino-Europe Sports Investment Management Changxing Co. Ltd.). Still, most outward FDI from Chinese firms is destined towards those regions with which China has strongest trade links (Chart 9).

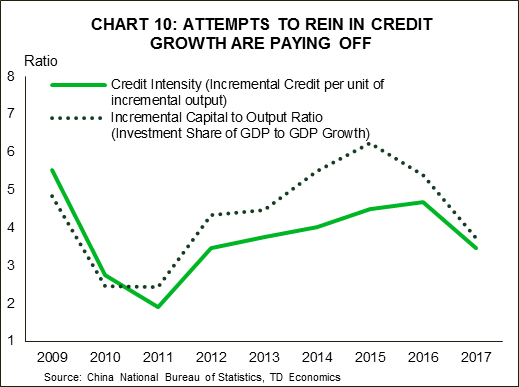
Although the level of debt will remain high for years to come, the best sign that credit growth is being reined in is the decline in two core measures of credit intensity (Chart 10). After peaking in 2016, incremental increases in both credit and capital have slowed relative to the pace of growth in output. Looking ahead, authorities are likely to maintain a tightening credit bias, which will likely see this ratio continue to fall back toward 2011 levels.
Weaning the economy off investment means slower economic growth
As China continues its transition to a developed economy, it will need to build less infrastructure. Moreover, the adoption of market mechanisms will help to ensure that both capital and labor allocations reflect demand and supply conditions rather than government mandates. Although China is still far from achieving developed economy status, it is expected to continue to undertake market-oriented reforms over the next few years that will have implications for domestic and global growth.
To help mitigate the economic drag from slower construction spending, China is aiming to boost household consumption and spending. Currently consumption comprises about 40% of GDP, while the household saving rate has held steady near 40% for more than a decade. An increase in household consumption that corresponds with a decreased saving rate should at least partly offset the decline in investment, holding true to the national saving and investment identity. But changing attitudes and behaviour of Chinese households is proving difficult. Culturally there remains the belief that Chinese males must own property before getting married, putting an enormous burden on the family to save at least for a downpayment. In order to hasten this transition, China plans on implementing a social safety net that should lessen the need for households to save for unplanned health care expenditures and job losses. Indeed, this was mentioned by President Xi as an important part of the Communist Party's economic plan over the next few years.
We anticipate that infrastructure investment is likely to fall to below 40% of GDP within the next few years. After peaking at 45.5% of output in 2013, infrastructure investment has receded to 42.8% in 2016, and should fall below 40% by 2020. The slowdown in infrastructure investment after almost two decades at 40% of annual output follows the post-war development of neighbouring Japan and South Korea, and is therefore largely anticipated.
A slowdown of this magnitude is expected to shave off about 0.3 percentage points from domestic output for each 5% decline in the share of investment, assuming no offset from another sector such as household consumption. Although the direct effect on global growth implies a rounding error of less than 0.1%, second order effects on commodity and international trade flows are likely much larger. For example, the IMF has found that for each 1% permanent decline in Chinese GDP growth, output in advanced economies could be 0.1 percentage points weaker, while the negative impact on its neighbours in emerging Asia is likely to be stronger, with an expected drag of up to 0.3 percentage points.6 Moreover, if the slowdown in growth is accompanied by financial market volatility, the estimated growth impacts could be double those mentioned for both advanced and neighbouring emerging Asian economies.
Deleveraging with some debt restructuring likely ahead
Ultimately, Chinese authorities have a number of tools to limit the fallout from slower credit growth and weaker economic activity. A currency devaluation is one with the aim being to offset the drop in domestic demand with a boost to export demand. However, this can prove inflationary and can deplete foreign currency reserves at least temporarily, while also creating widespread fears of a trade war. Moreover, the resulting uptick in inflation could stoke domestic unrest as the average citizen's purchasing power would deteriorate. In turn, this could exacerbate domestic financial risks, as Chinese citizens are likely to rush and pull out their deposits from domestic banks and move them overseas.
Instead, a gradual debt restructuring can accomplish the deleveraging required while also proving a convenient means for authorities to choose who bears the brunt of the impact. Since households are likely to hold banking deposits authorities would be less inclined to saddle banks with bad debt, and instead focus on shutting down highly indebted and underperforming firms, or forcing them to merge with more productive businesses that can absorb the debt.
Attempts have been made to transform liabilities in such a fashion. For example, in late 2015 there was a push by authorities to restructure corporate loans into bonds, with little evidence of bad loans being written-off. Ultimately the plan failed, since without deep developed fixed income markets the pricing of corporate bonds in China remains more art than science.
Publicly, monetary authorities have begun to acknowledge that non-performing loans in the government and corporate sector will have to be restructured. The fallout from a write-down of this debt will likely be contained within China, as this debt is largely domestically held. As part of this restructuring and to ameliorate financial market volatility domestically and bank stresses more broadly, Chinese authorities are likely to inject liquidity into the banking system but only enough to ensure that financial system will still function and thus support economic activity.
As a whole, China is well positioned for a debt restructuring of its corporate and local government debt. It maintains a current account surplus and owes little to the rest of the world. Its banking system has a stable source of deposits due to a high domestic saving rate, but at the same time part of these deposits are a reflection of risky lending practices by banks. Lastly, a strong economic outlook should ensure that government has more than enough fiscal space to absorb the cost of debt restructuring, but a financial crisis could rapidly deplete this cushion.
Bottom line
China's rise toward becoming the world's dominant economic growth engine has been funded in part by a domestic binge on credit in order to maintain high targets for economic growth. However, a history of loose credit policies has resulted in bad debts piling up in some sectors that have yet to be dealt with.
As a consequence, Chinese authorities have made it a priority to tackle the financial stability concerns that high debt typically pose in order to stave off a potential deleveraging episode that could have negative spillovers into the global economy. As a result, over the next few years we anticipate that China's credit growth should slow to the pace of real GDP growth, which is expected to fall to a still relatively strong 6.2% next year. Similarly, credit growth will slow below nominal GDP growth, bringing down the debt ratio.
But, the big question is when authorities will decide to begin a process of restructuring legacy debts, particularly in the government and non-financial corporate sector. The sooner China cleans up its bad loans, the faster it will be able to convince outside investors to begin to invest in its financial markets as it moves ever closer to achieving its goal of opening up its capital account to foreign investment.
Box 1: Tariffs to Impede, Not Derail, Chinese Efforts to Deleverage
The U.S. administration has announced tariffs targeting about US$265 billion in Chinese goods exports. The tariff rates range from 10-25% depending on the type of good targeted. Moreover, an additional US$19.5 billion in Chinese automotive exports could face tariffs if the U.S. administration follows through with its threat to place a 25% tariff on all automobile imports at some point over the next year.
The U.S. is China's second largest export market for goods, with about 19.1% ($430.7 billion) of total exports ($2.25 trillion) arriving in the U.S. last year. As such, the $265 billion in goods exports targeted by U.S. tariffs amounts to about 2.2% of Chinese annual GDP, a relatively small amount. Moreover, Chinese authorities have promised to level reciprocal tariffs on an equivalent amount of U.S. agricultural and industrial goods exports. All told, announced tariffs (both planned and threatened) by the U.S. administration together with the planned reciprocation by Chinese authorities would put about 0.5 percentage points of Chinese growth at risk over the next six quarters. This means that China may see economic growth of about 5.7% next year rather than the 6.2% anticipated.
Overall, this relatively small drag on economic activity is unlikely to trigger an intense bout of deleveraging by Chinese firms or households. On the contrary, Chinese policymakers are likely to inject stimulus in support of economic activity to ensure that growth doesn't fall below trend, estimated at about 6%. China's central bank has already moved to support demand by cutting its main policy rates, and its reserve requirement for banks (effective July 5th, 2018), suggesting that they are willing to put off tightening credit further.
Although the announced tariffs are unlikely to derail plans by Chinese authorities to slow credit growth and restructure existing debt, an escalation to a full blown trade war could send Chinese economic activity spiraling well below trend. Policymakers are likely to respond to such a negative scenario by engaging in fiscal stimulus, including pulling forward debt-financed infrastructure spending that will further exacerbate domestic imbalances. A devaluation in the renminbi will likely ensue as well, which could result in a surge in capital outflows that authorities will push back against. Ultimately we believe that cooler heads will prevail, avoiding such a negative trade war scenario. However, the anticipated economic drag from the announced tariffs is likely to impede progress by Chinese authorities to wean economic activity off of its overdependence on credit growth.
End Notes
- For example, Reinhart and Rogoff found that financial crisis induced recessions are more severe and have a much more prolonged recovery period of typically eight years. Source: Carmen M. Reinhart and Kenneth S. Rogoff (2009). This Time is Different: Eight Centuries of Financial Folly. Princeton University Press.
- See Michael Pettis (June 14, 2017). Can China Really Rein in Credit? Retrieved from: http://carnegieendowment.org/2017/06/14/can-china-really-rein-in-credit-pub-71284.
- For more details see our note on the evolution of China's services sector: Tracking China's Re-Balancing to Services-Based Economy.
- Source: BIS Consolidated banking statistics as of 2017Q4.
- The financial conditions index follows the methodology utilized in a working paper from the IMF in which the first principal component is taken of the following Chinese monthly financial variables: 3-month deposit rate, spread between the 90-day interbank rate and the deposit rate, spread between the 1-yr and 90 day deposit rate, creidt growth, percent change in the nominal effective exchange rate, percent change in the Shanghai Dow Jones index, and percent change in the MSCI China stock index. Source: Osorio, C et al. (2011). A quantitative assessment of financial conditions in Asia. IMF Working Paper WP/11/170. https://www.imf.org/external/pubs/ft/wp/2011/wp11170.pdf
- Source: Dizioli, A. et al. (August 2016). Spillovers from China's Growth Slowdown and Rebalancing to the ASEAN-5 Economies. IMF Working Paper WP/16/170. http://www.imf.org/en/publications/wp/issues/2016/12/31/spillovers-from-chinas-growth-slowdown-and-rebalancing-to-the-asean-5-economies-44179
USD/JPY – Dollar Shrugs off Soft Final GDP
The Japanese yen has ticked higher in the Thursday session. In North American trade, USD/JPY is trading at 110.37 up 0.10% on the day. On the release front, Japanese retail sales dropped to 06%, its lowest gain since October. Later in the day, Japan releases Tokyo Core CPI, which is expected to edge up to 0.6 percent. In the U.S, Final GDP in Q1 slipped to 2.0%, missing the estimate of 2.2%. Unemployment claims jumped to 227 thousand, well above the estimate of 220 thousand. On Friday, Japan releases consumer confidence. The U.S will publish consumer spending and inflation reports, as well as UoM Consumer Sentiment.
U.S numbers were soft for a second straight day on Thursday, but the dollar has managed to hold its own against the yen. Final GDP dipped to 2.0%, weaker than the second estimate of GDP in May, which showed growth of 2.0%. Much of the slowdown is being attributed to weaker consumer spending in the first quarter. There are expectations of banner growth in the second quarter, with some analysts predicting growth of over 5 percent, as the massive January tax cut should boost economic growth. However, the escalating trade war between the U.S and its trading partners, especially China, could dampen second quarter GDP. Trade tensions show no sign of easing, with President Trump threatening tariffs on some $250 billion in Chinese goods. On Thursday, U.S durable goods reports in May were a disappointment. Core durable goods orders declined 0.3%, well of the estimate of 0.5% and a 4-month low. Durable goods orders declined for a second straight month, with a reading of -0.6%. Still, this was better than the forecast of -0.9%.
As the second quarter draws to a close, the U.S economy continues to perform well. Economic growth has been strong and the labor market is close to capacity. However, the trade war between the U.S and its major partners could be the dark cloud on the horizon. The Federal Reserve now plans to raise rates four times in 2018 (up from three), but a global trade war could force the Fed to revise its forecast back to three hikes. On Tuesday, Atlanta Fed bank president Raphael Bostic said that if the trade war intensified, he would vote against a fourth rate hike, due to downside risks to the economy. Fed Chair Jerome Powell sounded pessimistic about the economic effects of trade tensions at an ECB forum earlier in June, and if other Fed members express concerns, a fourth rate hike could be delayed until 2019.
BoE Haldane: The vote for hike last week was hardly either surprising or radical
BoE chief economist Andy Haldane said that his vote for rate hike last week was "hardly either surprising or radical". He pointed out it was a "a full decade after monetary policy was first placed on an emergency setting". Even with a 25bps hike in the Bank Rate to 0.75%, monetary conditions in the UK would remain " extraordinarily accommodative by any historical metric". And the aim for a hike was to "lower the risk of needing to tighten policy less gradually in future and cause a sharper adjustment in the economy." He also noted he would even have voted for a hike back in May "had data on the economy held firm".
On the economy, he said "data on the consumer since the May MPC meeting has, virtually without exception, bounced back strongly". And that includes "measures of retail spending, consumer confidence and consumer credit". The underlying picture now appears to be one of "gently rising household spending". This is being supported by highly accommodative credit conditions and "now-positive growth in inflation-adjusted wages".
In addition, Haldane also said that there may could still be data disappointments. But he added that "waiting for something to turn up is not a prudent strategy in life. And waiting for everything to turn up is certainly not a prudent strategy for monetary policy."
Overall pretty hawkish.
Sunset Market Commentary
Markets
Today, core US and European bonds remained well bid, maintaining recent gains, but with limited further upside. Global investor reluctance on risky assets prevailed, but there was no market moving news on the key market topics (trade war, EM tensions etc.). The eco data, both in Europe and in the US, were also too close to expectations to inspire clear directional moves in interest rate markets. Changes on the US yield curve are less than 1 bp. German bonds slightly outperform US ones with the curve bull flattening (-1 bp for the 2-y; -2.36 bp for the 30-y). Intra-EMU spreads versus Germany (10-y) widened up to 4 bp with Greece and Italy underperforming. Italy sold a total of €4.5 bln bond (5 & 10-y). The auction attracted only mediocre investor interest despite recent widening of Italian spreads.
EUR-USD. Today, the USD rally did run into resistance, at least temporarily as the US currency neared/reached important technical barriers. The trade-weighted dollar is extensively testing the 95.15/50 area. EUR/USD came within reach of the 1.1510 support area. Safe haven flows leaving EM were at least partially to blame for the latest up-leg in the USD. This morning, sentiment on EM remained fragile suggesting further USD strength. However, for now, no new USD up-leg started, even as global sentiment on risk remained fragile in the wake of yesterday’s equity losses on US markets. EMU data (EC economic sentiment and German inflation) were not too bad, but were not the focus of FX traders. The same was the case for US data. EUR/USD trades currently in the 1.1570 area. USD/JPY is going nowhere holding a tight range in the low 110 area. The key question for USD trading remains whether the (EM-driven?) risk-off context persists and whether the risk-off trade continues to favour the dollar over the (low-yielding) euro or yen. Some more ‘erratic’ USD trading might be on the cards before this issue is cleared out.
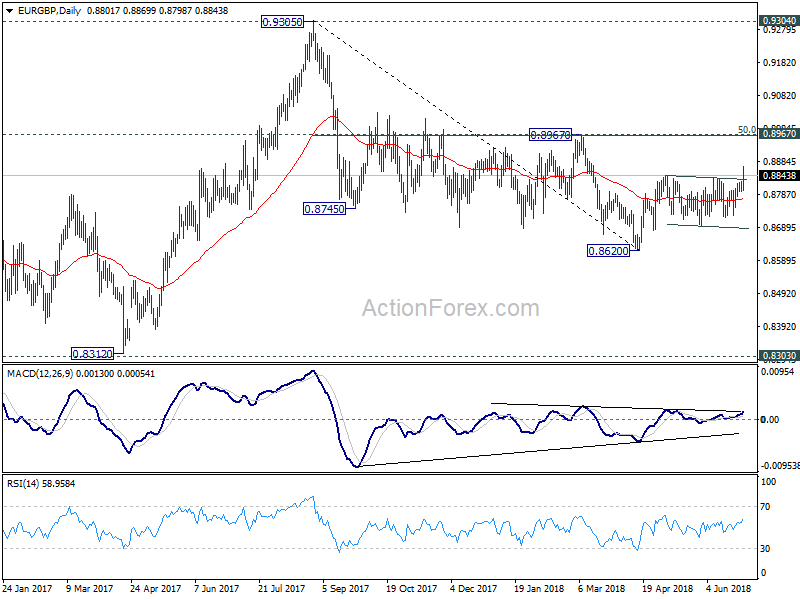
GBP. EUR/GBP finally tested the 0.8843 range top. The combination of end of month positioning squaring, a lack of positive news on Brexit coming from the EU summit and global investor caution were a good enough reasons for EUR/GBP to challenge the 0.8850 area. The decline of cable slowed as the dollar rally shifted into a lower gear. Even so, the picture for this cross rate also remains heavy. The pair is currently trading at around 1.3080. Next resistance at 1.3027 (Oct low) remains within reach.
News Headlines
Economic confidence in the European Union declined for the 8th consecutive month from 112.5 in May to 112.3 in June. The decline, however, is less than expected (112.0). The European Commission stated consumers are getting worried about the outlook for the economy amid escalating trade tensions and rising oil prices.
The Brazilian central bank has sharply revised its growth forecast downwardly for this year. The bank announced it expects the economy to grow only 1.6% this year, coming from the 2.6% growth forecast of only three months ago. The truckers’ strike at the end of May that paralyzed the entire economy is pointed at as one of the key reasons.
National CPI inflation in Germany slows but is still above the 2% target. The consumer prices rose 2.1% from a year earlier, down from 2.2% in May, is in line with market expectations. The higher price of oil was counterbalanced by a smaller growth in services prices.
President Trump is following-up on the nuclear summit he held with Kim Jung Un, by sending his secretary of state Pompeo to North Korea next week. Trump will also hold a first bilateral summit with Vladimir Putin in Helsinki next month, after Trump’s attendance at the NATO summit in Brussels.
EUR/GBP Mid-Day Outlook
Daily Pivots: (S1) 0.8793; (P) 0.8811; (R1) 0.8829; More...
EUR/GBP's strong break of 0.8844 resistance indicates that rebound from 0.8620 has finally resumed. Intraday bias is back on the upside for 0.8967 cluster resistance (50% retracement of 0.9305 to 0.8620 at 0.8963). Firm break there will confirm trend reversal for 0.9305 key resistance. On the downside, break of 0.8724 is now needed to indicate near term reversal. Otherwise, outlook will remain bullish even in case of deep retreat.
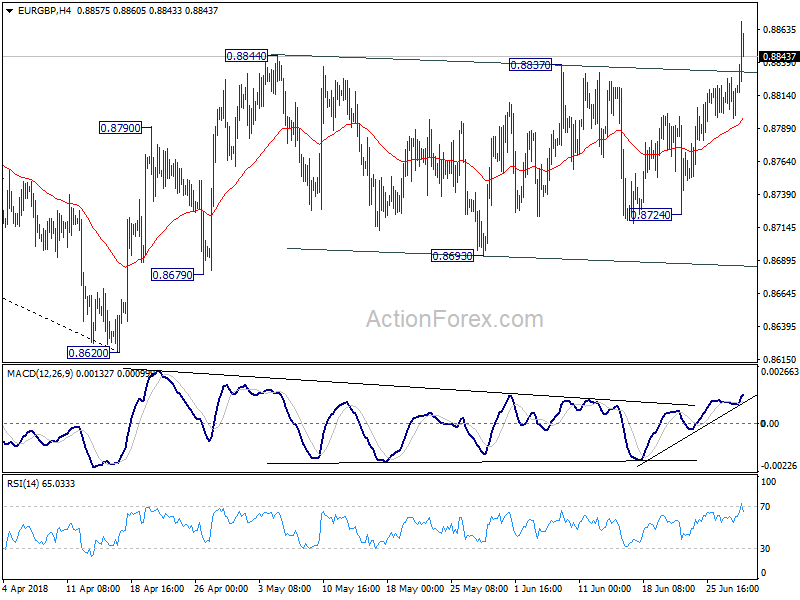
In the bigger picture, for now, the decline from 0.9305 is seen as a leg inside the long term consolidation pattern from 0.9304 (2016 high). Such consolidation pattern could extend further. Hence, in case of strong rally, we'd be cautious on strong resistance by 0.9304/5 to limit upside. Meanwhile, in another decline attempt, we'd expect strong support from 0.8116 cluster support (50% retracement of 0.6935 to 0.9304 at 0.8120) to contain downside.
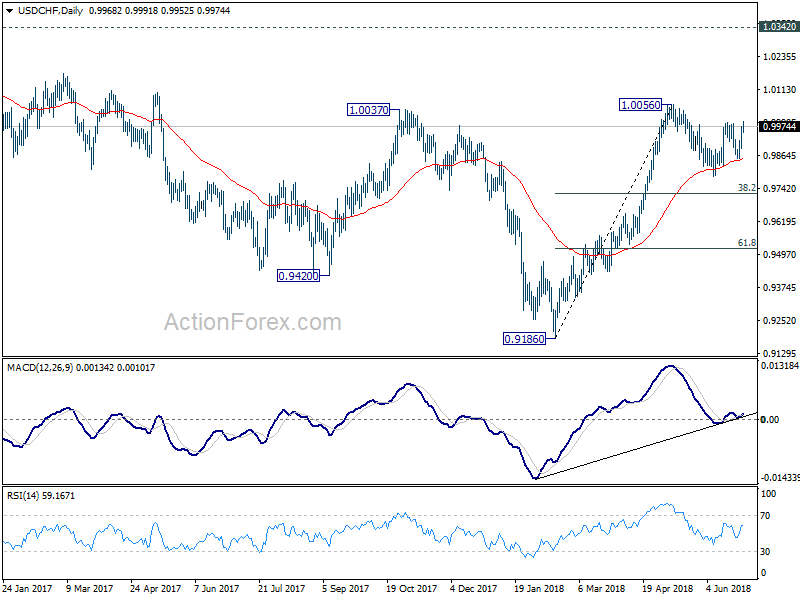
USD/CHF Mid-Day Outlook
Daily Pivots: (S1) 0.9916; (P) 0.9946; (R1) 1.0002; More...
Intraday bias in USD/CHF remains neutral first as it cannot sustain above 0.9989 resistance yet. On the upside, firm break of 0.9989 will resume the rebound from 0.9787 and target 1.0056 high. Break will resume whole rally from 0.9186. On the downside, below 0.9855 will likely resume the correction from 1.0056 through 0.9787 support. But downside should be contained by 38.2% retracement of 0.9186 to 1.0056 at 0.9724 to bring rebound.
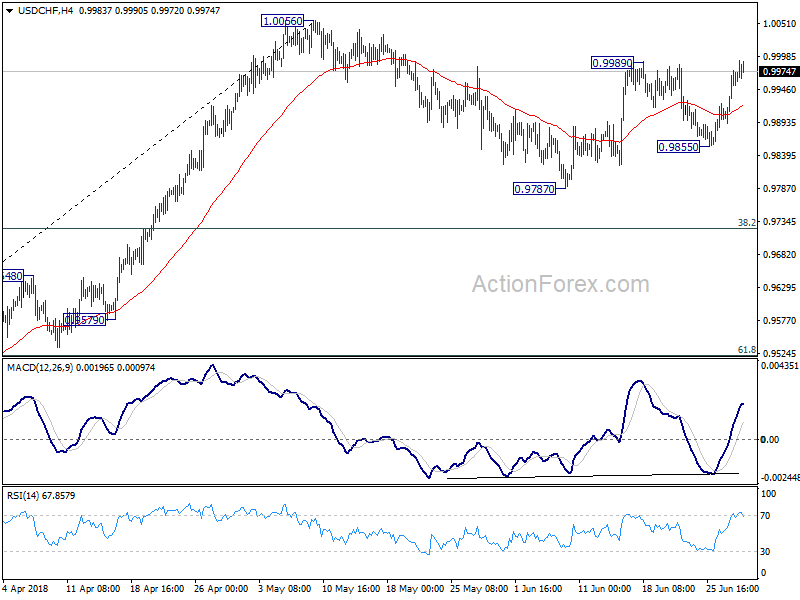
In the bigger picture, medium term decline from 1.0342 has completed with three waves down to 0.9186. Rise from there is currently viewed as a leg inside the long term range pattern. Hence, while further rally would be seen, we'd be cautious on strong resistance from 1.0342 to limit upside. For now, further rise is expected as long as 38.2% retracement of 0.9186 to 1.0056 at 0.9724 holds. However, sustained break of 0.9724 will dampen this bullish view and would at least bring deeper fall to 61.8% retracement at 0.9518.