

Sample Category Title
EURUSD Analysis: Trades Near 1.16
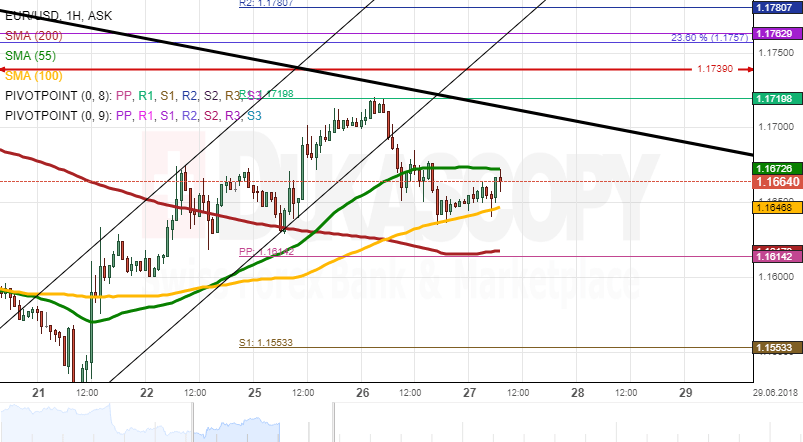
The Euro began to weaken against the US Dollar early on Tuesday after failing to move above the considerable resistance of the weekly R1 and the senior channel near 1.1720.
A large fall did not follow, as the pair was restricted by the 55– and 100-hour SMAs. This minor depreciation left the pair testing the 1.1645 mark this morning.
Technical indicators are still tended south that should point to further decline. However, traders should consider the strong support cluster formed by the 200-hour and 55-period (4H) SMAs and the weekly PP circa 1.1615. This could hinder or even halt any attempts to move below this level, thus reversing the Euro back to the upside.
Today's highest point should be the aforementioned 1.1720 territory, while a bearish fall is unlikely to exceed 1.16.
GBPUSD Analysis: Flash Bearish Signals
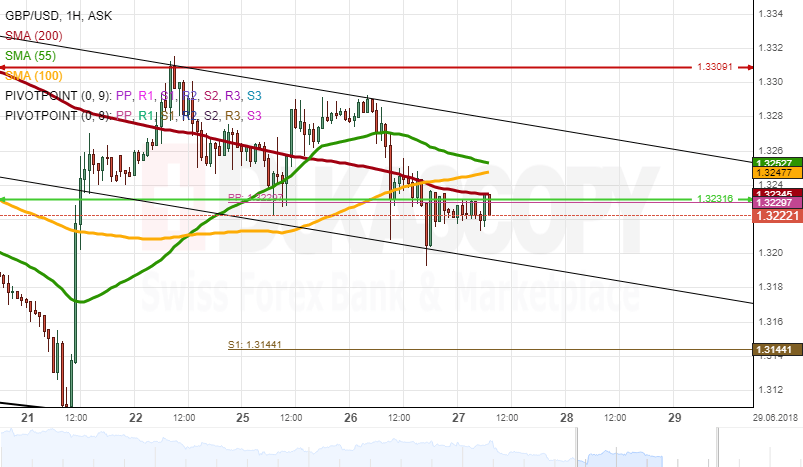
The Pound managed to breach its three-day range to the downside on Tuesday, thus forming a new short-term descending channel. This fall was very limited, as bears could not push the pair below the psychological 1.32 level. Meanwhile, an advance above 1.3240 was stopped by the 100– and 200-hour SMAs.
The pair moving below all three SMAs should point to further fall, as the Pound is likely to lack the necessary strength to dash through this massive resistance cluster. This scenario is likewise supported by bearish technical indicators on 1H and 4H time-frames.
The nearest support is the weekly S1 at 1.3144, while the senior channel line is located nearby at 1.3190.
USDJPY Analysis: Returns In Senior Channel
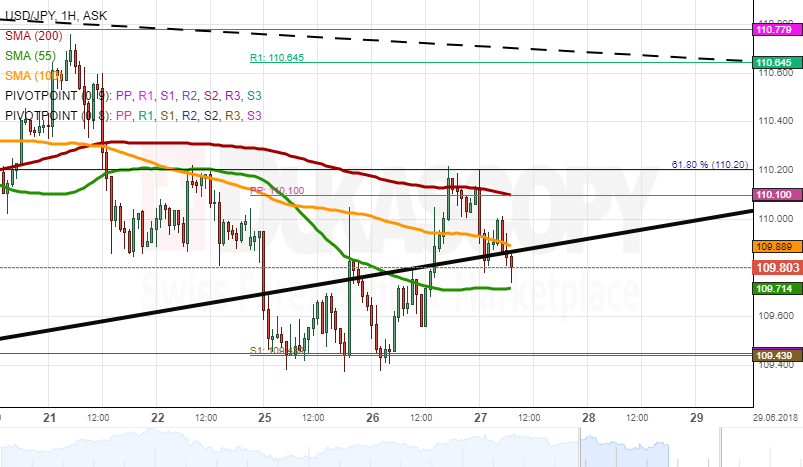
The weekly S1 and the monthly PP at 109.45 provided strong support for the US Dollar during the first part of this week. The pair gained momentum mid-Tuesday and therefore breached the 55– and 100-hour SMAs. It returned back in the breached senior channel and remained trading in the 109.80/110.20 range until early today.
Technical indicators show mixed signals, mainly due to the considerable resistance level located near 110.20. The rate is expected to push higher in this session, however, the 100– and 55-period (4H) and the 200-hour SMAs and the weekly PP could ease the current bullish sentiment and lead the rate lower today.
If this area is breached, the Greenback should target the weekly R1 at 110.65. Conversely, a fall is unlikely to surpass the 109.45 mark.
Gold Analysis: Reaches Three-Month Channel
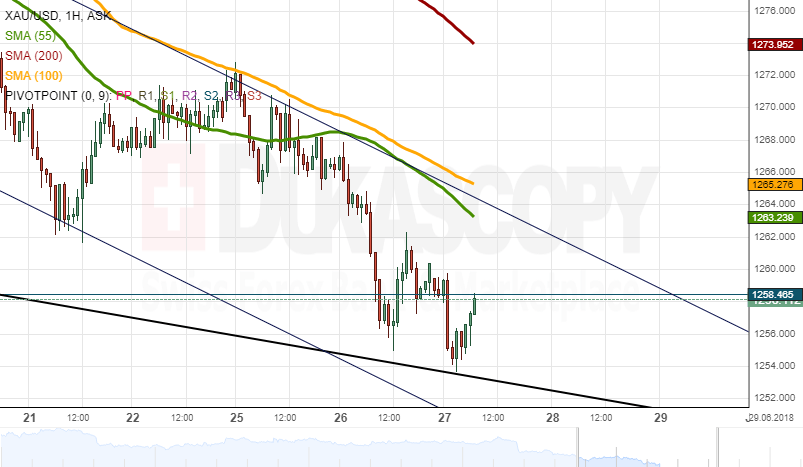
The yellow metal has been depreciating against the US Dollar in a descending channel for the seventh consecutive trading session. The pair has already fallen 1.34% since the beginning of this week.
By Wednesday morning, Gold had reached the monthly S2 and the bottom boundary of a three-month channel down near 1,255.00. Shorter-term technical indicators are starting to recover, while those on the 4H time-frame are still lagging behind. However, it is still expected that this session brings some bullish momentum to the upside.
A strong resistance cluster is set by the 55– and 100-hour SMAs at 1,265.00. In case this level us surpassed, Gold is likely to target the 200-hour SMA at 1,275.00.
USDJPY Outlook: Fresh Weakness Pressures Cloud Top But Stronger Direction Signal Needs Break Through 55 /200SMA Range Boundaries
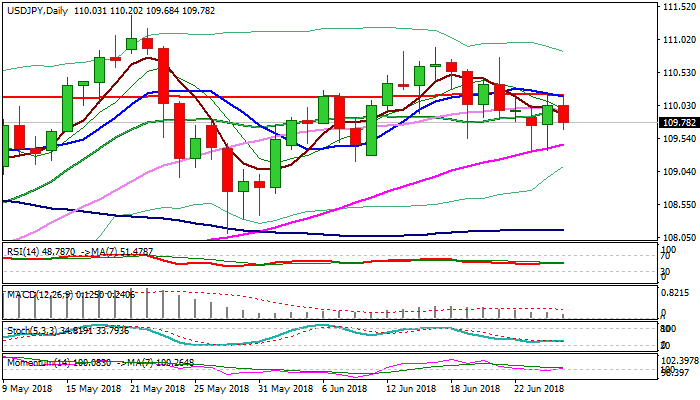
The pair came under pressure after repeated rejection at 200SMA (110.19) on Tuesday and attacks again daily cloud top (109.70) in early Wednesday’s trading.
Death-cross of 10/200SMA is forming on daily chart and weighing on near-term action which holds in the range between 55SMA and 200SMA for the third straight day.
Firm break below cloud top is needed for initial bearish signal, while sustained break below 55SMA (109.44) would confirm bearish continuation and expose next pivotal support at 109.17 (Fibo 61.8% of 108.11/110.90/08 June trough).
Bullish scenario requires break and close above 200SMA to signal further upside.
Res: 110.19, 110.75, 110.90, 111.39
Sup: 109.70, 109.51, 109.36, 109.17
New Zealand Dollar selloff extends ahead of RBNZ
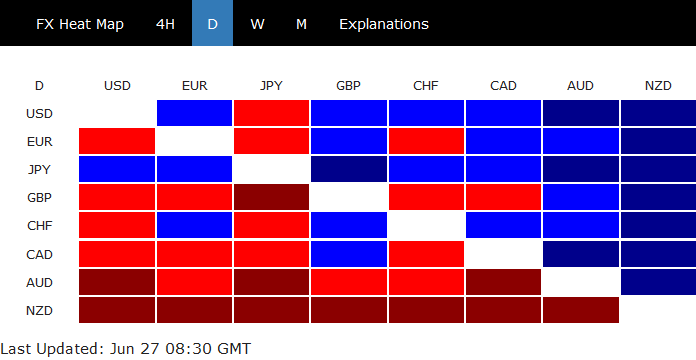
New Zealand Dollar is under broad based selling pressure today as markets await RBNZ rate decision. RBNZ will keep the OCR unchanged at 1.75%, no doubt. It will also reiterate the neutral stance to "keep the OCR at this expansionary level for a considerable period of time" too. The main question is how RBNZ Governor Adrian Orr view the balance of risks. On the one hand, there will be stimulus from the government's expansive fiscal policy. But on the other hand, there is threat of global trade war and slow down in China, it's major trading partner.
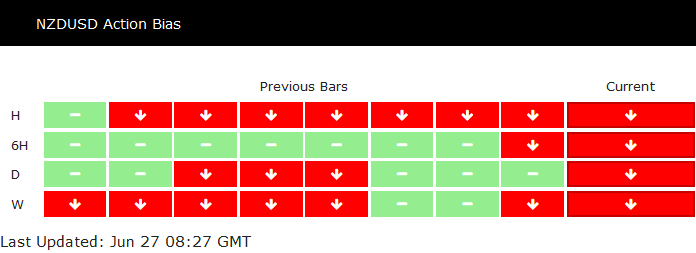
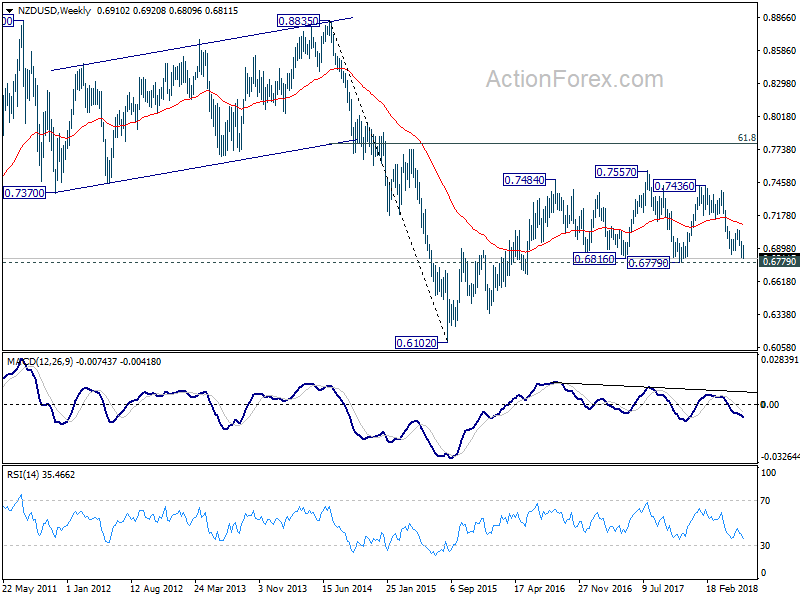
Action Bias tables and charts of NZD/USD show down trend resumption with solid downside momentum. In particular, the lack of upside blue bar in the corrective rise since May shows that bears remained in control despite the rebound.
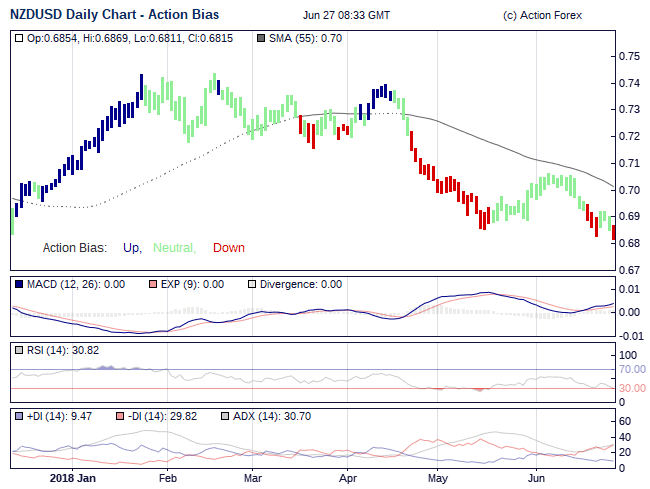
Further fall should be seen to 0.6779 (2017 low) support in near term. We'd maintain our view here that 0.6779 is a key support level. For short term trading one should tighten up the stop as NZD/USD approaches 0.6779 to guard of a strong and quick rebound.
For position trading, we'd suggest to have a little patience to see if NZD/USD would take out this level firmly. And, decisive break there will confirm completion of the corrective rise from 2015 low at 0.6102. That would also be accompanied by a head and shoulder top (ls: 0.7487, h: 0.7557, rs: 0.7436. And that will very likely resume the long term down trend from 2014 high at 0.8835, through 0.6102. It's worth the wait.
GBPUSD Outlook: Risk Of Further Weakness While Broken 10SMA Caps
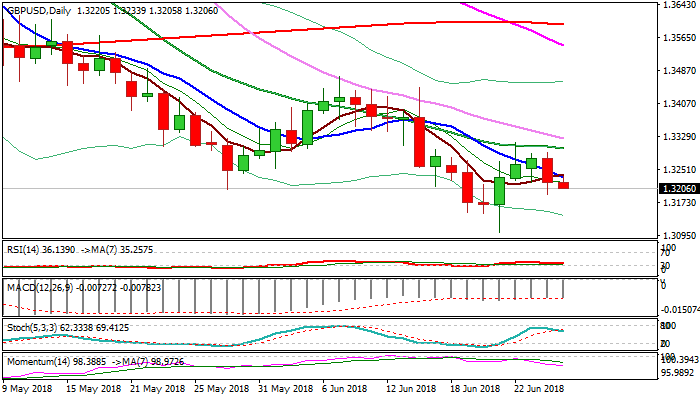
Cable holds in a narrow consolidation above 1.3192 low posted on Tuesday’s fall and remains at the back foot, as near-term focus turned lower after repeated failure under 20SMA and subsequent bearish acceleration.
Break and close below 10SMA on Tuesday weakened near-term structure as dovish tone from BoE MPC’s new member Haskel on Tuesday, additionally pressured pound. Additional negative signal comes from Tuesday’s bearish engulfing after strong offers at 1.33 zone capped recovery from 1.3101.
Break below pivots at 1.3192 (Tuesday’s low) and 1.3183 (Fibo 61.8% of 1.3101/1.3315) would spark extension of weakness from 1.33 zone and also signal an end of recovery phase from 1.3101 (21 June low). Broken 10SMA (1.3233) marks initial barrier which is expected to cap and maintain fresh bearish bias.
Lift above 10SMA would sideline immediate downside risk, but clear break above 20SMA (1.3301) is needed to revive bulls and shift focus higher.
Res: 1.3233, 1.3292, 1.3301, 1.3325
Sup: 1.3192, 1.3183, 1.3152, 1.3101
EURUSD Outlook: Tuesday’s Fall Dents Bullish Bias But Break Below 10SMA Needed To Confirm Reversal
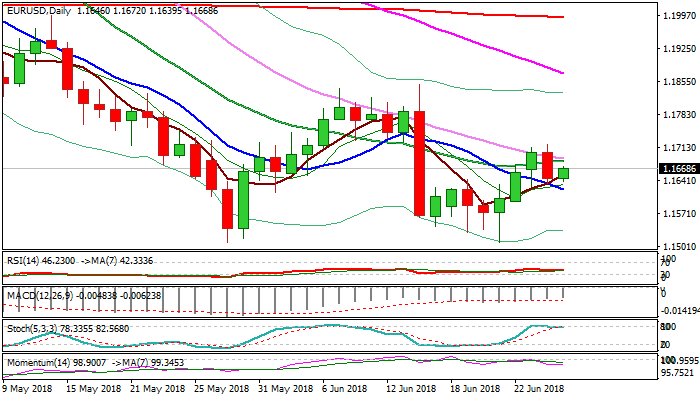
The Euro is slightly higher in early Wednesday's trading, following Tuesday's pullback after three-day recovery rally stalled at key Fibo barrier at 1.1718. Dips was so far contained above 10SMA (1.1623) which marks lower pivot but Tuesday's bearish Outside Day was seen as negative signal. The downside became more vulnerable after Tuesday's weakness, as momentum is negative and slow stochastic reverses from overbought zone and forming bear-cross with its 7-d MA. Bears need close below 10SMA for confirmation of reversal and extension towards next strong supports at 1.1589 (Fibo 61.8% of 1.1508/1.1720 upleg) and 1.1570 (base of thick 4-hr cloud). At the upside, broken 20SMA (1.1683) marks initial barrier which needs to cap and keep near-term risk shifted lower. Close above 20SMA would ease downside pressure and re-expose key barrier at 1.1718 (Fibo 61.8% of 1.1848/1.1508 bear-leg), break of which would signal continuation of recovery from 1.1508 (21 Jun low).
Res: 1.1683, 1.1720, 1.1746, 1.1767
Sup: 1.1639, 1.1623, 1.1589, 1.1570
AUD/USD Bearish Trend Resumes As Weekly Support Is Compromised
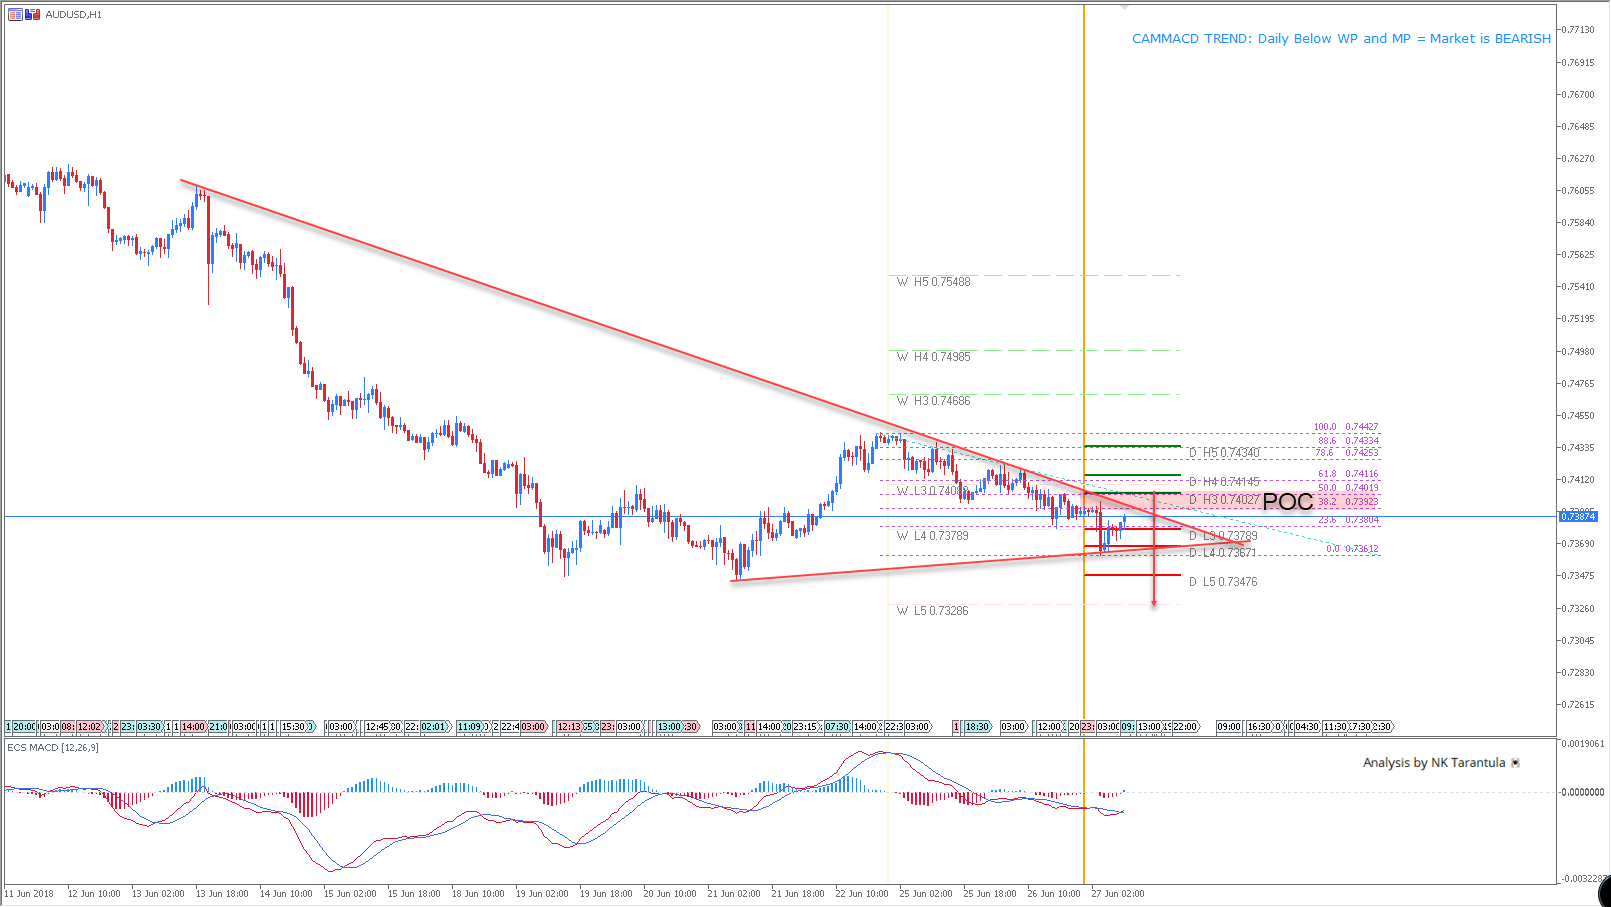
The AUD/USD has formed a bearish M pattern on a Weekly time frame which suggests the bearish continuation. In intraday timeframe, the price is progressing further down, and 0.7400-10 could reject the price. The huge intraday trend line holds the trend in place. The target is 0.7360. Below the 0.7360 - targets are 0.7347 and 0.7328.
W L3 - Weekly Camarilla Pivot (Weekly Interim Support)
W H3 - Weekly Camarilla Pivot (Weekly Interim Resistance)
W H4 - Weekly Camarilla Pivot (Strong Weekly Resistance)
D H4 - Daily Camarilla Pivot (Very Strong Daily Resistance)
D L3 – Daily Camarilla Pivot (Daily Support)
D L4 – Daily H4 Camarilla (Very Strong Daily Support)
POC - Point Of Confluence (The zone where we expect price to react aka entry zone)
Market Sentiment Shaky As Trade Fears Linger, Oil Jumps
It is slowly shaping up to be another rough and rocky trading week for global equity markets as escalating trade tensions between the United States and China weigh on risk sentiment.
A risk-off vibe continues to linger in the air with investor confidence clearly shaken after the Trump administration announced plans to restrict Chinese investments in American businesses. This move is likely to further deteriorate US-China trade relations while fanning fears thatthe trade skirmishes will transform into a potential full-blown trade war.
Most Asian stocks were under pressure this morning amid the growing caution and this negativity could weigh on European markets later today. Although US stocks staged a rebound yesterday thanks to rising shares of energy and technology companies, the upside could be capped by jitters about global trade tensions. With Trump's trade war seen as a significant threat to global stability and economic growth, market sentiment is likely to remain extremely fragile moving forward.
Pound outlook clouded by Brexit uncertainty
Market players who were looking for a quick opportunity to offload the Pound were given permission on Tuesday after new Bank of England member John Haskel expressed caution over raising interest rates too quickly.
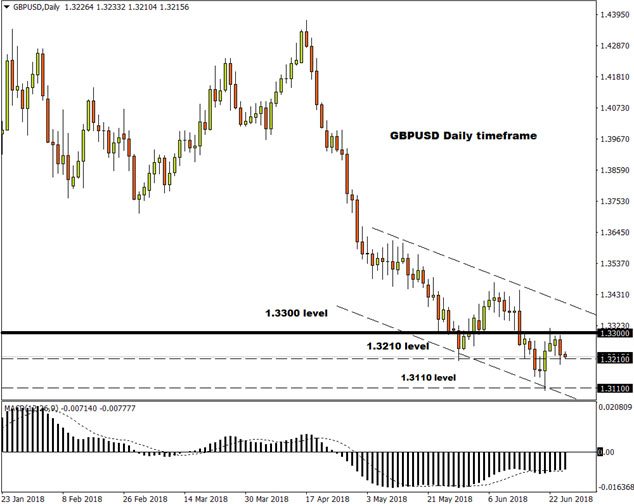
The outlook for the British Pound remains heavily dictated by Brexit developments and UK rate hike expectations. Buying sentiment towards the Pound is likely to deteriorate further if Brexit-related uncertainty and tepid economic data force the BoE to delay monetary policy normalization. In regards to the technical picture, the GBPUSD continues to fulfil the prerequisites of a bearish trend on the daily charts as there have been consistently lower lows and lower highs. A solid daily close below 1.3210 could invite a further decline towards 1.3110.
Gold tumbles to fresh 2018 low
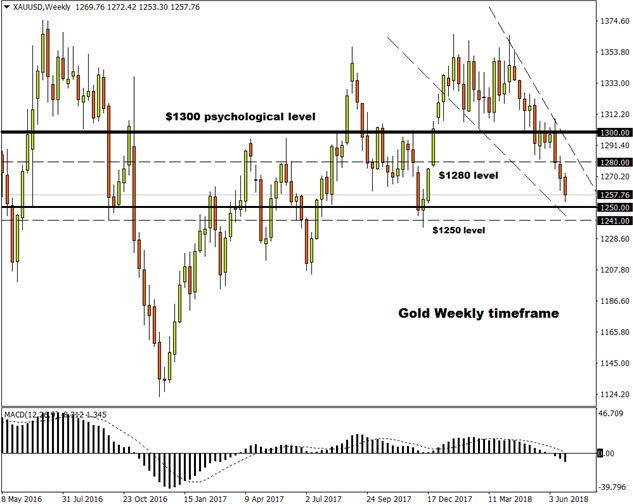
The fact that Gold has tumbled to a fresh 2018 low this morning despite global trade tensions weighing on sentiment, continues to beg the question if the precious metal has lost its safe-haven appeal.
Price action suggests that a stronger Dollar and expectation of higher US interest rates remain Gold's biggest nemesis. With the Dollar likely to remain supported as expectations heighten over the Fed raising interest rates at least two more times this year, Gold could be poised for further punishment despite the risk aversion. Focusing on the technical picture, prices remain heavily bearish on the daily and weekly charts. A solid breakdown below $1250 could open the doors towards $1241.
Commodity spotlight – Oil
Oil prices have received a solid boost after the United States stepped up the pressure on allies to cut off imports of Iranian oil from November.
The upside was complimented by supply disruptions in Libya and Canada which inspired bulls to push WTI Crude towards $70.80 this morning. With renewed geopolitical risk factors likely to stimulate concerns of supply disruptions, oil prices have scope to extend gains in the near term. Focusing purely on the technical picture, WTI Crude remains bullish on the daily charts with $72.00 in sight as long as bulls are able to defend $70.00.
Yuan slips to six-month low
Escalating trade tensions between the United States and China have weighed heavily on the Yuan which has weakened to its lowest level this year against the Dollar.
The People's Bank of China lowered its Yuan midpoint for the sixth straight trading day on Wednesday in an effort to cushion the negative impact of trade tariffs imposed by the US. The monetary policy divergence between the Federal Reserve and PBoC has also played a role in the Yuan's depreciation this year. With trade tensions likely to fuel risk aversion and pressure emerging market currencies, the Yuan has scope to extend losses. Market players will be closely observing if the USDCNY is able to achieve a solid weekly close above the 6.6000 level. If bulls are able to conquer 6.6000, the next level of interest may be found at 6.6175.