

Sample Category Title
Dollar Mixed as EU Trade Spat Escalates
The US dollar is mixed against major pairs. Safe havens like the Swiss franc, Japanese yen and the euro have gained against the greenback, while the Canadian and New Zealand dollars along with the pound are lower. Strong data in Europe boosted the single currency but the rally was short lived after the Trump administration announced a review of US-EU trade that could result in a 20 percent tariff on European car imports. Oil prices surged after the Organization of the Petroleum Exporting Countries (OPEC) and other major producers agreed to increase supply at the end of their collective meeting in Vienna. The Canadian dollar became the worst performer against the US dollar as inflation and retail sales disappointed on Friday.
- US consumer confidence forecasted to slow down
- BOE Carney to announce bank stress test results
- BOC to publish its quarterly business outlook survey
EUR Higher After Strong PMIs Held Back by Trade Concerns
The EUR/USD rose 0.32 percent on Friday. The single currency is trading at 1.1640 after scoring early gains versus the USD with the release of flash PMI data in Europe. German and French service Purchasing Manager's Indices (PMIs) were higher than expected, but manufacturing indicators suffered slight setbacks. The European data reflected those moves with a 55 Services PMI and a slight decrease on manufacturing with a 55 reading.
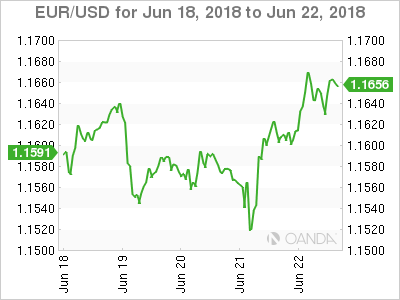
The news of a potential 20 percent tariff on European cars was announced by US President Donald Trump on Friday. The EUR responded to the news by moving lower, but still close to the 1.1630 price level. The US will start a probe on auto tariffs on July 19. European stock markets were in positive territory as the tariffs are subject to a review but slowed down the momentum the EUR rally ahead of the weekend.
The European calendar will feature the German Ifo business climate on Monday, German inflation data on Thursday and closing the week with German retail sales and EU inflation estimates. In North America the calendar will have the release of the consumer confidence survey by the Conference Board on Tuesday, US durable goods on Wednesday, US final GDP and unemployment goods on Thursday. Canadian data will be in the spotlight on Friday with the release of the monthly GDP and the business outlook survey from the Bank of Canada (BoC).
Loonie Hits 1 year Low vs Dollar
The USD/CAD was higher on Tuesday. The pair climbed 0.19 percent trading at 1.3337 after the release of Canadian inflation and retail sales. The consumer price index (CPI) disappointed with a 0.1 percent gain, while retail sales contracted by 0.1 percent. Both indicators had more optimistic forecasts. The loonie is struggling to advance versus the USD as the uncertainty surrounding NAFTA and softer economic indicators have put the currency on the back foot. The Bank of Canada (BoC) could hike rates to a void a decline of the currency, but the central bank has to balance the potential impact of higher interest rates on households that are holding record debt levels.
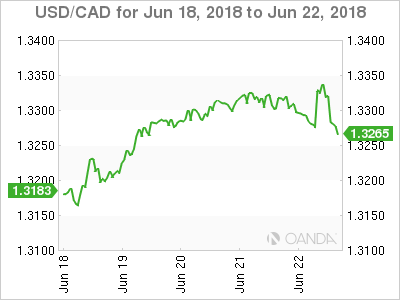
A rate hike in July decreased in probabilities with the inflation miss. The chances were higher given the Canadian central bank tries to keep the gap between the Fed funds rate and its own benchmark from getting too wide. The 25 basis points earlier this month by the U.S. Federal Reserve put some pressure on the BoC with investors anticipating a move in July.
Oil Rises as Output Deal Lower Than Expected
Saudi Arabia was able to broker a deal with the other Organization of the Petroleum Exporting Countries (OPEC) members and major producers to increase daily oil production by 1 million barrels per day. The move was praised by US President Donald Trump who tweeted for more increases as it will keep the price of crude down. Iran was not backing the move into higher supply limits, but backed off from blocking the deal during the meeting in Vienna. The majority of the increase will come from OPEC members, at around 70 percent with Russia and others adding the rest. Despite higher supply levels the market took the news of the agreed increase as a positive for oil prices.
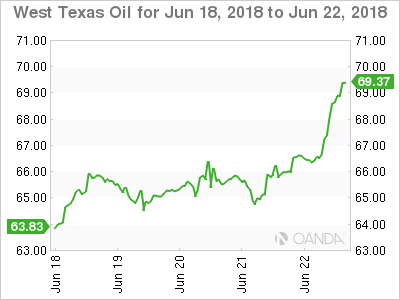
The deal to increase production was lower than expected after the OPEC and major producer agreement to limit production has been one of the major factors in the stability of crude prices. The fact that the organization remained united was a positive for oil prices despite higher supply. Demand is showing some signs of recovery, and the disruptions in Iran, Venezuela and Libya will keep the black stuff bid.
Market events to watch this week:
Tuesday, June 26
- 10:00am USD CB Consumer Confidence
- 9:00pm NZD ANZ Business Confidence
Wednesday, June 27
- 4:30am GBP BOE Gov Carney Speaks
- 8:30am USD Core Durable Goods Orders m/m
- 10:30am USD Crude Oil Inventories
- 3:00pm CAD BOC Gov Poloz Speaks
- 5:00pm NZD Official Cash Rate
- 5:00pm NZD RBNZ Rate Statement
Thursday, June 28
- 8:30am USD Final GDP q/q
Friday, June 29
- 4:30am GBP Current Account
- 8:30am CAD GDP m/m
- 10:30am CAD BOC Business Outlook Survey
*All times EDT
Week Ahead – Eurozone and US Inflation Eyed; RBNZ Meets; Low Hopes for Brexit Deal at EU Summit
Inflation data will be watched in the Eurozone and the United States as both countries make progress towards their price targets. GDP numbers will also be in focus as final estimates are released in the US and the United Kingdom, while Canada publishes monthly growth figures. Central bank activity will come from the Reserve Bank of New Zealand, while an EU summit is sure to make the headlines as European leaders meet to discuss Brexit.
Eurozone CPI to hit 2%
As the European Central Bank embarks on an exit plan from its bond buying program, investors have chosen to fixate their attention on the ECB’s rate path. With the timing of a rate hike pushed back till the end of the summer 2019, the euro has been pulled to 11-month lows. However, flash CPI readings due on Friday should serve as a reminder as to just how far the Eurozone has come in recovering from deflationary territory. Friday’s preliminary estimate is expected to show headline inflation reached 2% on an annual basis in June. But with core inflation forecast to ease to 1% from 1.1%, rate hike expectations are unlikely to budge.
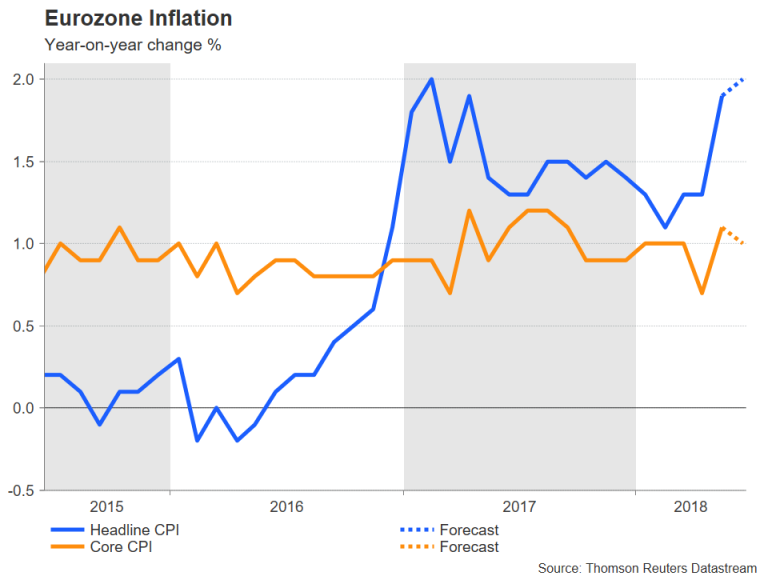
In other data out of the Eurozone, Germany’s Ifo business climate index will be monitored on Monday, while the European Commission’s economic sentiment gauge will attract interest on Thursday.
RBNZ to hold rates
It hasn’t been a good week for the commodity-linked Australian, New Zealand and Canadian dollars. Rising risk-off sentiment on the back of growing worries about a possible trade war has driven the aussie and the loonie to one-year lows, while the kiwi has touched 6-month lows. Aussie traders shouldn’t place their bets on economic data though as the only release of significance will be Friday’s numbers on private sector lending. The loonie stands a better chance of receiving a boost as the monthly GDP growth figure is published on Friday. A strong reading could help lift the loonie out of its doldrums.
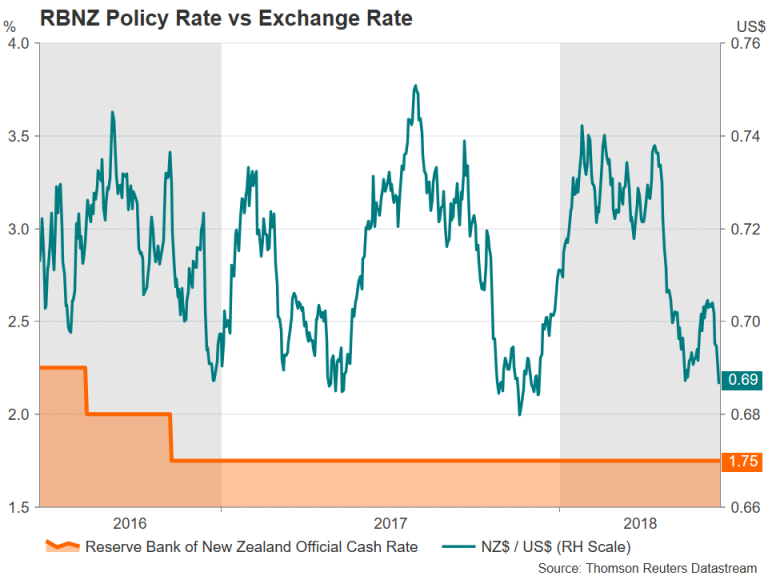
The biggest risk event, however, is for the kiwi as the RBNZ announces its latest monetary policy decision on Thursday. Following this week’s GDP data that showed New Zealand’s quarterly growth rate slowed to 0.5% in the three months to March (the weakest since the fourth quarter of 2016), the RBNZ is anticipated to stand pat and remain in neutral mode, keeping its options open for either a cut or a rate hike as it’s next move. However, any changes to the language in the Bank’ statement that suggests policymakers are becoming more worried about the growth outlook could trigger even deeper losses for the kiwi. Ahead of the RBNZ decision, May trade figures will be looked at on Wednesday.
Busy week for Japanese data
The Japanese yen has had a strong week as increased risk aversion has kept the safe-haven currency in demand. Economic indicators will be in plenty supply next week but are not expected to have a major impact on the yen. Retail sales are up first on Thursday with the remainder due on Friday, including the jobless rate and the preliminary industrial output reading for May. A positive set of data would reassure investors that the Japanese economy is rebounding in the second quarter.
But a bigger risk for yen crosses will be Monday’s Summary of Opinions by the Bank of Japan. The summary of the BoJ’s June policy meeting will be gazed for an insight to policymakers’ thinking. However, with the board now comprising entirely of doves and one ultra-dove, there’s unlikely to be any new divergences in views.
Pound bounce at risk from no deal at EU summit
The UK calendar will be relatively light in the next seven days with the only highlight being Friday’s final estimates of first quarter GDP growth. Growth is expected to remain unrevised at 0.1% quarter-on-quarter. Published alongside the headline GDP number will be quarterly figures on business investment and the current account balance. Investment in the UK fell by 0.2% according to the prior estimate. A downward revision would add to concerns about the Brexit uncertainty weighing on business spending.
The main focus though for sterling next week will be the EU summit on June 28-29. With no agreement yet on the Northern Ireland border issue and the UK government postponing the publication of its Brexit blueprint until after the summit, it’s unlikely EU leaders will make much progress on agreeing the outlines of a post-Brexit trading relation with the UK. But with a deal not looking very probable next week, investors will be assessing the tone of the summit. A stalemate at the talks could cut short sterling’s rebound this week following the surprise 6-3 dissent in the MPC vote at the BoE policy meeting. On the other hand, some type of progress in key areas at the summit could help the pound to sharply extend its gains.
US PCE inflation coming up
It’s going to be a packed week in terms of data for the US, with the most important being the personal consumption expenditures (report) due at the end of the week. Before that though, housing numbers will dominate, starting with new home sales for May on Monday and the S&P/Case-Shiller 20 city home price index for April on Tuesday. Also out on Tuesday is the Conference Board’s consumer confidence index. The closely-watched gauge is forecast to remain unchanged at 128.0 in June. On Wednesday, the main data will consist of pending home sales, the advance release of the goods trade balance and durable goods orders, all for May. Durable goods orders – a good proxy for business spending – are forecast to rise by 0.2% month-on-month in May, recovering modestly from the 1.6% dip seen in April. However, any unexpected weakness in the data could spark concerns that the escalating trade tensions are starting to weigh on business activity. On Thursday, no revision is expected to the final print of first quarter GDP growth, which came in at 2.2% in the prior estimate.
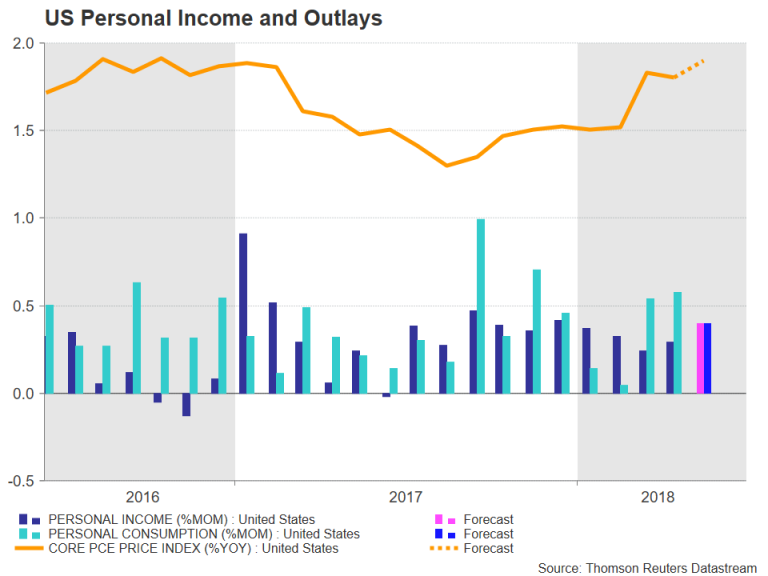
Finally, on Friday, the Chigaco PMI for June and personal income and spending figures will round up the week. Personal income is expected to accelerate slightly to 0.4% m/m in May, while consumption is forecast to moderate from 0.6% to 0.4% m/m during the same period. Also in the spotlight will be the PCE price index, which is the Fed’s preferred measure of inflation. The core PCE price index, which excludes food and energy items, is forecast to inch higher to 1.9% year-on-year in May. A stronger-than-expected number would reinforce the view that the Fed will raise its benchmark rate two more times this year, which could lift the US dollar to fresh highs, having scaled an 11-month peak this week.
Australia & New Zealand Weekly: Global Growth Risks to the Fore, But Opportunity Lingers on the Horizon
Week beginning 25 June 2018
- Global risks to the fore, but opportunity lingers on the horizon.
- Australia: private sector credit.
- NZ: RBNZ policy decision, business confidence, building consents.
- China: National PMIs.
- Europe: EU Summit, CPI, business surveys.
- US: PCE inflation, personal income & spending.
- Key economic & financial forecasts.
Information contained in this report current as at 22 June 2018.
Global Growth Risks to the Fore, But Opportunity Lingers on the Horizon
Australia has been enjoying a tailwind from above average global growth. Commodity prices have boosted national income, providing a windfall for government budgets, and external demand for our services is unprecedented.
Yet of late, otherwise clear skies have become shrouded by concerns that our growth trajectory may become somewhat more bumpy. Trade tariffs and geopolitical drama dominate the headlines, but China's debt also looms in the shadows and, of late, emerging market risks have also increased.
Rising US yields and a bounce in the USD has seen a partial unwind of yesteryear's carry trade – borrowing cheaply in the US to invest in higher yielding emerging markets. Though the emerging market sell off has been most intense outside Asia, important regional trading partners of Australia and China have also been affected. Given the increase in uncertainty, what does the outlook hold?
The first thing to note is that the pace of global growth already looks to be cresting. The chart below shows the smoothed distribution of growth in thirty advanced and emerging economies.
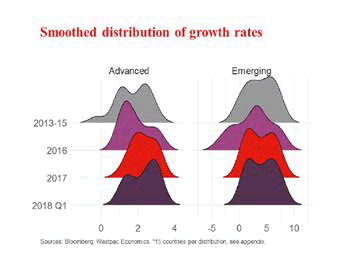
The synchronised pick up in global growth during 2017 in both regions is clear. However, in Q1 2018, the advanced economies distribution has become increasingly bi-modal. This reflects the slowdown in Europe, Japan and South Korea from well above trend growth last year. The first quarter was hampered by adverse weather effects, but leading indicators are not signalling a rebound come Q2. In contrast, the US is looking to pick up speed, spurred on by fiscal stimulus, job growth and confidence.
Compare the above situation to emerging economies, where the distribution looks remarkably unchanged – albeit similarly split. It is notable that some of the Asian economies that have been affected by the emerging markets sell off have been posting solid economic data. For example, India's Q1 GDP growth beat estimates, being 7.7% higher over the year to March, and 6.7% for financial year 2016–17 as a whole. Indonesia's manufacturing PMI also lifted to a 23-month high of 51.7 in May, with firms reporting robust domestic demand.
To focus solely on the latest prints is to ignore that market pricing is forward looking. Yet it implies that the rush to sell is more reflexive than driven by a real economy shock. Ahead, the feedback from financial markets to the real economy is, of course, an important dynamic which needs to be monitored. When you combine depreciating currencies, higher commodity prices and higher domestic rates, risks clearly become elevated. The next chart looks at the fuel trade deficit; depreciation against the USD in 2018; and changes in benchmark rates in 2018 for China; India; Indonesia; Malaysia; the Philippines; Thailand; and Vietnam. Excluding China, these six nations account for 13% of Australia's exports and 14% of our imports.
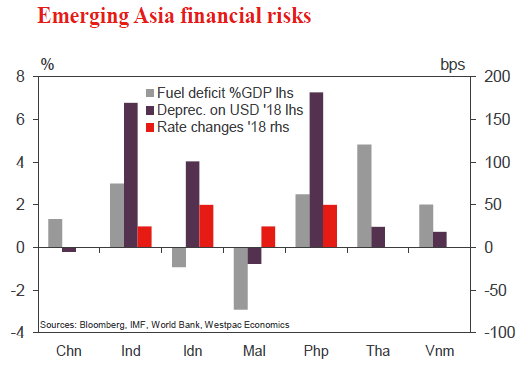
Three countries' currencies have been hit hard by the sell off: India; Indonesia; and the Philippines. They all run current account deficits meaning they are net borrowers in global capital markets. The weaker currency boosts inflation rates and often also triggers the central bank to tighten policy, squeezing real household incomes. Notably, India raised rates by 25bps in June on inflation concerns, and Indonesia hiked by 50bps in May to defend the currency. The Philippines hiked by 25bps recently after a previous 25bps hike earlier in the year and Malaysia also previously hiked by 25bps.
Fuel's share of household consumption and some countries' net importer status means the 30% rise in Brent crude prices since Q3 2017 has great significance not only for inflation, but also activity. A growth slowdown would (if it eventuated) come at an awkward time for many governments, with elections in India, Indonesia and Thailand scheduled to take place in the first half of 2019.
Real economy stress stemming from financial markets could lead to a backlash against greater global integration, as was the case following the Asian Financial Crisis.
That said, it is important to acknowledge that much of the increased integration in this decade differs to the marketsbased investment of the 1990s. China's Belt and Road initiative and the parallel India/Japan-led Asia-Africa Growth corridor are strategic initiatives driven by state funding. As such, their commitment to investment is not subject to the same temperamental flows. However, politically it faces more challenges. In regards to Belt and Road, a facilitating catalyst may be upon us in this election cycle.
The Pakistan general election will be held on July 25, 2018. The last election was held in May 2013 and garnered minimal international attention. That was prior to the announcement of Belt and Road and the China–Pakistan Economic Corridor (CPEC). The hallmark of CPEC is Gwadar Port which, in late 2015, was leased to China until 2059. The deep sea port is located just outside the Strait of Hormuz, linking Asia to the Middle East. It will give China an alternative to the current shipping route through the narrow Strait of Malacca in Malaysia. That journey is around 10,000km long. The distance from Gwadar to Kashgar (Xinjiang) in Western China is instead around 2,500 km, then another 4,500km to the East.
The port has faced difficulties with Gwadar locals, and there have been reports of government corruption. However, the election could mark the beginning of acceleration in CPEC. As the incumbent Prime Minister Nawaz Sharif has been disqualified from running due to allegations of corruption, the PTI opposition party has gained popularity. The key here is the opposition party's critical nature towards the US. Their increased political clout could see a further pivot towards closer relations with China, giving additional impetus to Belt and Road. Should that lead to successful development of a path through Pakistan, the potential for Asian growth and further expansion of Western China could be facilitated sooner.
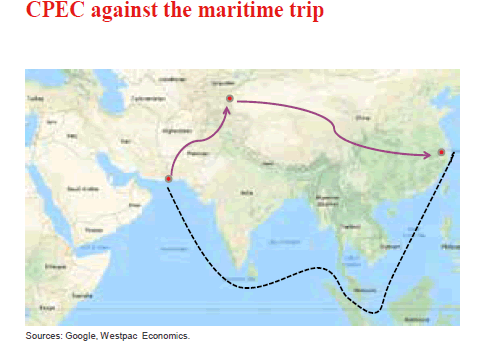
As such, while recognising the aforementioned near-term difficulties for Asian markets, we should not lose sight of the longer run possibility of another Asia growth miracle, this time precipitated by the success of China's Belt and Road rather than the earlier bottom-up driven trade-led boom of Japan, the East Asian Tigers and China. A comparison of China's current links with South East Asian countries offers an indicative blueprint of what can be achieved.
Firstly, the chart below shows China's trade with Belt and Road countries as a proportion of total Chinese trade.
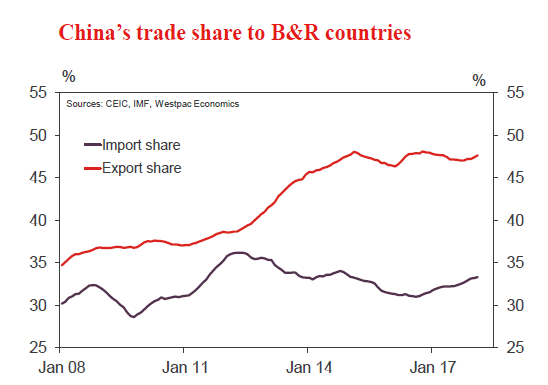
There are 63 Belt and Road countries across Europe, the Middle East, North Africa and Central, South and South East Asia We can see that China's imports from these countries have been flat, partly due to the 2014 decline in oil prices. The proportional outperformance of the export share happened before 2015, the year when the Belt and Road Initiative was shaped.
The next chart gives a reasonable explanation as to why this is the case. It shows China's 2011 exports to a given country on the x axis and the corresponding 2017 exports on the y axis. The grey line indicates China's overall export growth over the period (3.4% CAGR). A point above the grey line indicates exports to the country grew faster than overall exports.
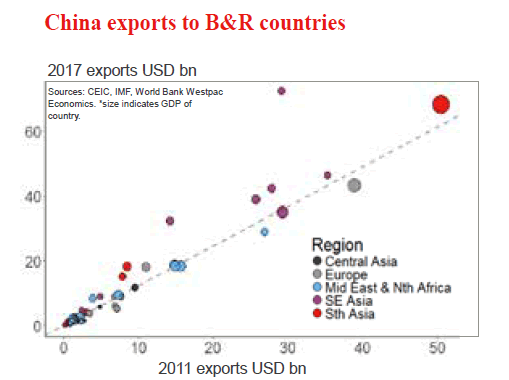
Note that the points are also colour coded by region and that the size indicates the country's GDP. It is clear that the cluster of outperformers are in the South East Asian region. Most notable is Vietnam which more than doubled its imports from China over the period, while the only underperformer was exports to Indonesia. Geography is clearly critical. The Belt and Road will not bring any of these countries closer to China on the map, but improved infrastructure and reduced trade barriers will effectively achieve the same thing.
Other detail on the chart suggests we have reason to be optimistic. To the left, we can see two South Asia outperformers: Pakistan and Bangladesh. Trade here also doubled, albeit from a much lower base. As said, further integration with Pakistan is key to a great part of this initiative. Bangladesh too is important to the overall strategy, given its close relationship with India.
In that regard, the most notable feature on the above chart is the large red point to the right representing India. Even though India is critical of Belt and Road, and has boycotted meetings, exports from China to India have grown considerably.
While India has justifiable concerns over Belt and Road given its political weight, its reaction to the initiative has generally been productive and pragmatic. While welcoming trade with China, the competitive pressure of the Belt and Road initiative has also encouraged India to seek tighter relationships with their neighbours. For example, its response to the Gwadar port is the planned development of Chabahar port in Iran, around 100km further along the coast. The port is part of an India–Iran– Afghanistan partnership providing access towards Europe.
Multilateral cooperation is strikingly positive in Asia. As some major developed economies push back against international trade, the developing world is embracing it. Yes emerging markets are currently out of favour as tighter global monetary policy presents near-term challenges; but beyond that, significant opportunity awaits. The Sun rose first, the Tigers followed and the ascending Dragon is looking over its shoulder to its west.
The week that was
The past week has again seen a focus on monetary policy, with central bank authorities from across the world meeting at the ECB's Forum on Central Banking.
Before we turn to this global perspective on policy, we should start at home with the minutes of the June RBA meeting. Broadly this communication was consistent with prior statements from the RBA, though it omitted a reference to the next move in rates likely being up – last seen in the Governor's 13 June speech, and before that the minutes from the April and May meetings. This is most likely a timely tactical decision, to save it from becoming an unwanted focus at a later stage.
The key sentence in this set of minutes regarding the considerations for monetary policy was instead: "Further progress in the period ahead in reducing unemployment and returning inflation to the target was therefore expected, although this progress was likely to be gradual". The implication is that, while still the RBA's base case, a rate hike is a long way off and conditional on global risks not crystallising. On the domestic front, the consumer is the central risk to the RBA's view. To put it simply, if wage inflation is to strengthen, the recent downturn in employment growth has to prove temporary. Further, the RBA needs declining house prices and a possible "further tightening of lending standards in the period ahead" to not affect consumption.
We continue to believe that activity growth will slow below trend through 2018 and 2019; wage and consumer inflation will remain nearer 2%yr than 3%yr; and that the RBA will therefore remain on hold through the end of 2019.
Turning to the global policy view provided by the ECB's Sintra Conference. For those interested, many of the presentations were recorded and can be accessed online. For our purposes however, it is sufficient to focus on the panel discussion that included the RBA Governor along with the head of the FOMC; ECB and BOJ.
Consistent with recent communications from each institution: US FOMC Chair Jerome Powell was fervently positive without being anxious over inflation prospects; while ECB President Draghi was hopeful, thanks to progress on wage and consumer inflation, but clear that there is more work to be done before the economy can stand by itself. For policy and markets, the consequence is that the US will continue to see a gradual increase in the fed funds rate (and market interest rates) over the coming year; however in Europe, rates will remain static.
From our own Governor Lowe, the focus was on the welfare of the people. In his remarks, there was recognition that, while Australia didn't suffer a recession post-GFC, it is still experiencing disappointing wage and productivity growth, and consequently below-target inflation. Wage headwinds from globalisation; cost control; and higher participation by older workers (greater labour supply) are expected to persist for some time, restraining inflation. The Governor's take home point in response was that, to his mind, it is better to accept missing the inflation target for a time rather than stoking inflation via higher credit growth and (potentially) an increase in financial risks. This implies that the RBA will be patient with policy in both directions: only increasing the cash rate if employment growth bears fruit for wages and inflation; while also holding back from cutting rates, unless the labour market suffers a sustained deterioration. Financial stability is key and will remain so.
Finally, trade frictions continue to rumble on. The effect on confidence has been most obvious in foreign exchange markets with, for example, the Australian dollar trading down through the USD0.74 figure this week, having previously shown stability around USD0.75. The state of play between the US and China is as follows. The US will impose tariffs on $34bn of specified imports from China come 6 July, and an additional $16bn of trade once the products are confirmed. China will respond with tariffs on $34bn of US imports, again from 6 July, and a further $16bn of imports if the US proceeds with the tariffs still under negotiation. What created the market shock was arguably President Trump's subsequent request to the United States Trade Representative to find a further $200bn of Chinese imports to the US to levy tariffs on if China goes ahead with its stated response, as well as an additional $200bn if they go further. To our core view for the Australian dollar, these market ructions are a clear (and likely lasting) downside risk. It is however important to remember that the strategic initiatives underway in Asia, Belt and Road in China as an example, still offer enduring hope of greater and fairer trade for the world.
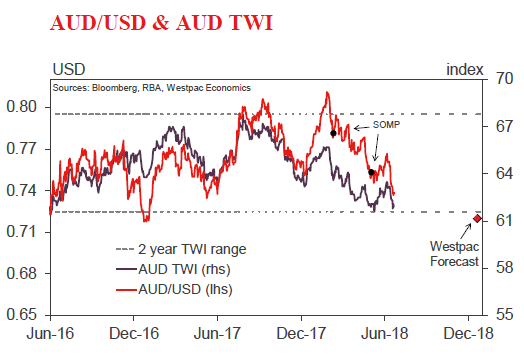
Chart of the week: the Australian Dollar
The decline in the Australian dollar has provided some reprieve from tightening financial conditions centred on a higher BBSW, higher term rates and a modest increase in credit spreads.
Following a decisive shift down from USD0.78, during April-May, the Australian dollar has now broken through the USD0.75 level, then 0.74, before retracing to hold back around the figure.
The question to ask is whether the current level is evidence of a low, or if it is instead merely a pause for breath in a longer downtrend. We continue to argue the latter, believing that the Australian dollar will inevitably lose altitude to USD0.72 by March 2019, and thereafter test USD0.70 in the second half of 2019. This view comes as a consequence of our expectations for the US and commodity prices.
New Zealand: week ahead & data wrap
Taking stock
This week's GDP figures provided more evidence that the New Zealand economy has lost some momentum. We have long been expecting a period of subdued growth, reflecting businesses' uncertainty about the new Government and a cooling in the housing market. Increased government spending will provide a boost to activity in coming years, but the pace of economic growth appears to be well past its peak.
GDP rose by 0.5% in the March quarter, following gains of 0.6% in each of the previous two quarters. Some minor revisions to history saw the annual growth rate nudge down to 2.7%, a little below market expectations.
There was little in the way of special factors that might have held down the quarterly result – growth was widespread across industries, but was unremarkable in most cases. Household spending was flat as consumers turned more cautious, and construction activity slowed in the face of capacity and finance constraints. Dairy production picked up a little after a poor start to the season.
Of course, GDP is a somewhat dated measure of how the economy is tracking; it's almost three months since the end of the March quarter. This week, we review recent data to assess how the economy has performed since then. There is not a lot of support for the idea that growth has re-accelerated in the June quarter – in fact, our forecast of a 0.7% rise in GDP may be on the high side.
Housing: house price inflation has slowed again in the last few months, with Auckland prices falling slightly. The new Government's array of policies aimed at dampening housing speculation appear to be having some bite. The 'bright-line' test for capital gains on investment properties has been extended from two to five years, restrictions on foreign buyers will soon come into force, and negative gearing will start to be phased out next year.
We are forecasting house prices to be essentially flat over the next few years. However, the extent of the housing slowdown will depend on how some of these policies are specified, which is still up in the air to some degree.
Notably, the bill for restricting foreign buyers has been softened from the initial proposal. Under certain conditions, foreign buyers will no longer be forced to on-sell completed apartments that they had purchased off the plan. The property transfer statistics suggest that foreign buyers are already concentrated in the apartment space (they account for a much higher share of sales in central Auckland and Queenstown). So this could make the policy significantly less binding than we had assumed.
Consumer: property prices have a major influence on household's willingness to spend, and retail spending growth cooled in the March quarter as the housing market has slowed. The latest electronic card spending figures indicate that consumers remain cautious: card spending fell sharply in April, and picked up only modestly in May.
On the positive side, vehicle sales are shaping up better for the latest quarter. Sales were hampered in the March quarter as some import shipments were delayed due to the discovery of marmorated stink bugs. The car registration figures up to May suggest that this backlog is now being cleared. That said, registrations are still down from last year's peaks.
Construction: capacity constraints and access to finance continue to present a challenge for the building industry. However, building consents have remained strong in recent months, and have been particularly strong for multiples (apartments and townhouses) in Auckland, which is precisely where the growth is most needed. We expect a lift in building activity over the rest of this year, but at a gradual pace.
Domestic activity: the monthly Business NZ surveys have shown mixed results. The manufacturing PMI has been on the soft side in recent months, apart from a brief spike in April. However, the services PSI activity has improved over the last few months, having slowed down in late 2017 and early 2018.
Labour: high-frequency information on the labour market is hard to come by, but we note that up to May the growth in job advertisements has continued to slow. While the labour market has tightened, it is not obvious that a shortage of skilled workers would deter employers from looking; the slowdown in ads is more suggestive of a softening in demand.
Trade: export volumes fell sharply in the March quarter, which we put down to a combination of weak milk production in the first part of the season and the timing of export shipments. Both of these factors point to healthier export volumes in the June quarter. Export commodity prices have also improved in the last few months, both in world price terms and after accounting for the lower New Zealand dollar. Tourist numbers are still trending higher, but the pace of growth has slowed.
Overall, the June quarter is shaping up to be another period of modest growth at best. That stands in contrast to the view of the Reserve Bank, which has long held bullish expectations for growth in 2018. The soft March quarter result – the sixth consecutive quarter in which GDP growth has fallen short of the RBNZ's forecast – will provide food for thought for next Thursday's OCR review.
However, there have also been some inflation-positive developments since the last OCR decision in May. The 2018 Budget was stimulatory, with Government spending now expected to have an even larger impact on aggregate demand in the early 2020s than the RBNZ previously allowed for. And a sharp rise in fuel prices means that inflation is likely to rise back to 2% much sooner than the RBNZ expected (though this rise may not be sustained into next year). While the balance of risks to inflation has probably tilted higher, we expect the RBNZ to maintain its basic message that the OCR will be on hold for an extended period.
Data Previews
Aus May private credit
- Jun 29, Last: 0.4%, WBC f/c: 0.3%
- Mkt f/c: 0.4%, Range: 0.3% to 0.6%
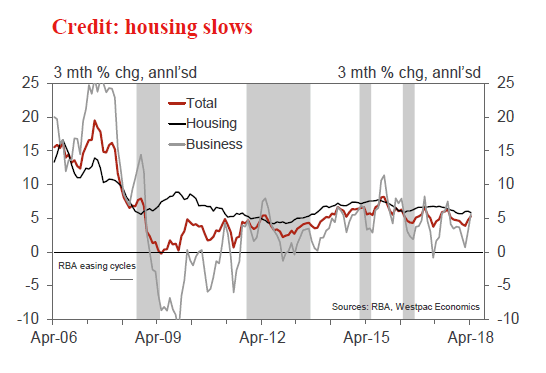
Private sector credit is expanding at a modest pace as the housing sector cools. In 2017, credit grew by 4.8%, slowing from 5.6% for 2016. For the month of May, we expect a subdued rise of 0.3%, one notch down from the recent average of 0.4%.
Housing credit, at this late stage of the cycle, is slowing as tighter lending conditions see new lending decline. In April, housing credit grew by 0.43%mth, 6.0%yr, with the 3 month annualised pace at 5.8%, down from 6.8% a year earlier.
Business credit, 4.3% above the level of a year ago, is volatile around a modest uptrend as businesses increase investment in the real economy. The past two months were above par results (0.7% and 0.5%) as the segment emerged from a soft spot at the turn of the year. The risk is a more modest gain is recorded in May.
Personal credit continues to contract, -1.2% over the year.
NZ June ANZ business confidence
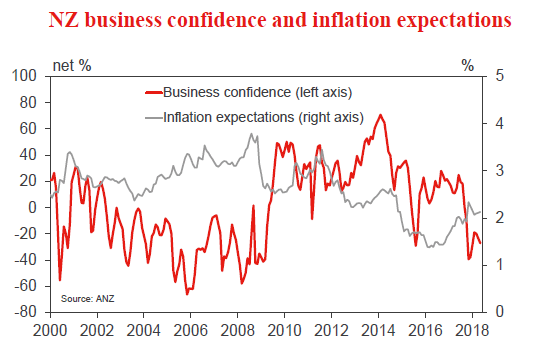
- Jun 27, Last: -27.2
Business confidence has fallen over the last couple of months. The fall in confidence has been fairly wide spread with the construction sector particularly pessimistic in recent months.
It will be interesting to see how confidence in the agricultural sector has responded to the Government's decision to attempt to eradicate Mycoplasma bovis. • We expect soft confidence to translate to a lull in business investment this year.
Inflation expectations have been relatively stable in recent months. They may edge higher over the second half of the year on the back of rising petrol prices and rising headline CPI inflation.
RBNZ OCR Review
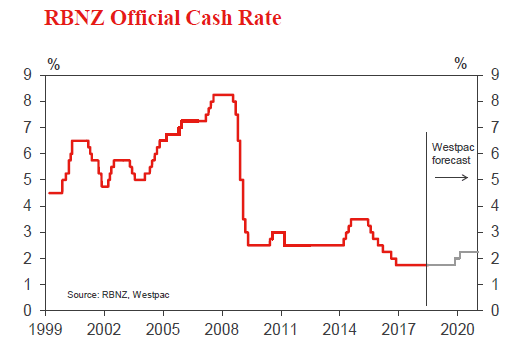
- Jun 28, Last 1.75%, Westpac 1.75%, Market 1.75%
We expect the RBNZ to repeat its main message that the OCR is likely to remain on hold for a long while, but that the timing and direction of the next move will depend on how the economy evolves.
Focus on whether the RBNZ repeats the words "up or down" in its policy guidance is a red herring. The RBNZ is keen to avoid formulaic communications. They may well choose different words but this would not necessarily constitute a signal that the OCR outlook has changed.
Beneath the policy guidance paragraph, the details of the press release might be slightly more hawkish than the May statement.
NZ May building consents
- Jun 29, Last -3.7%, Westpac f/c: -8%
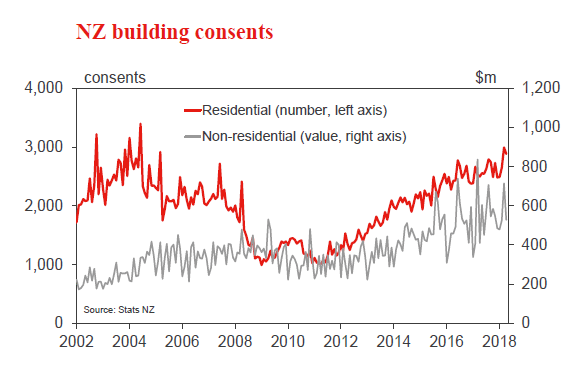
Residential building consents fell only slightly in April. Consents for multiples (apartments, etc) were particularly strong in March, and we had expected a reversal in April. However, they actually remained at relatively firm levels.
The multiple consents category, which now accounts for half of all consents in Auckland, can be lumpy on a month-tomonth basis. With a large number of these consents in the past two months, we expect to see some normalisation in May. That would still leave consent issuance in Auckland at high levels. At the same time, we expect to see a continued gradual moderation in Canterbury and steady levels in other regions. This combination would leave overall consent issuance down by around 8% in May.
Difficulties accessing finance and shortages of skilled labour continue to provide a brake on building activity. Consequently, while building activity remains elevated, we expect it will only rise at a gradual pace.
US May personal income and spending
- Jun 29, personal income, last 0.3%, WBC 0.4%
- Jun 29, personal spending, last 0.4%, WBC 0.5%
- Jun 29, PCE deflator, last 0.2%, WBC 0.2%
Disposable personal income received a boost in Apr, rising 0.4% following respective gains of 0.3% and 0.2% in February and March. However, inflation offset half that gain, restricting real income growth to 0.2% – as in Mar. Slowly but surely nominal wage incomes should lift; growth in investment income should also hold up, relieving pressure on the savings rate, which has trended down to low levels in recent years.
In light of consumers' improving financial position, in May we look for a 0.5% gain for spending after a positive lead from retail sales and given services should also support.
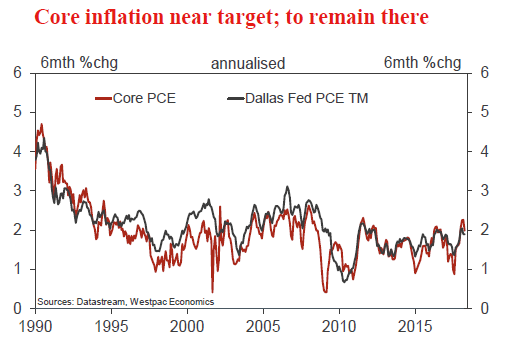
Regarding inflation, on both a headline and core basis, PCE inflation looks set to settle near 2.0%yr. As put forward by the FOMC, risks in either direction are limited.
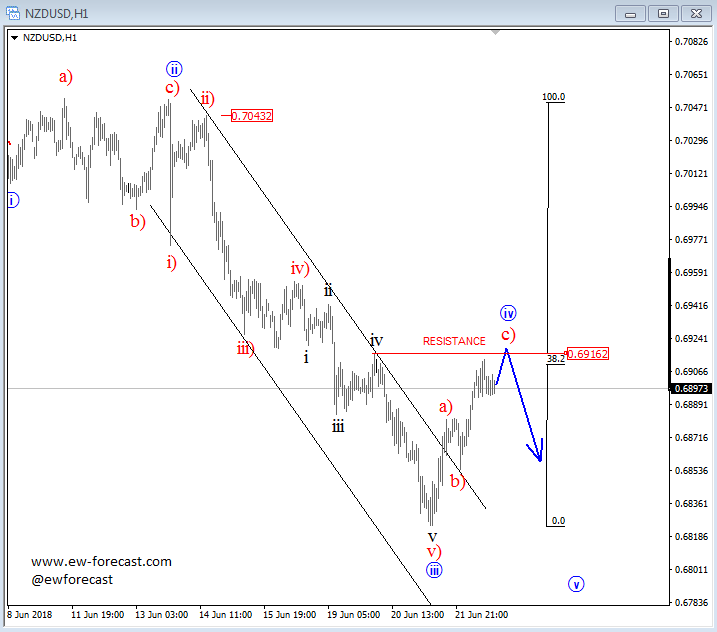
NZDUSD and USDCAD – Elliott wave Analysis
Kiwi is trading bearish within five waves down, but we still see an unfinished five-wave cycle, so current recovery can be a part of a corrective movement into wave iv, where ideal resistance would be here around 38,2% Fibo. retracement and 0.69169 level. That said, be aware of another drop back to lows for wave v.
NZDUSD, 1h
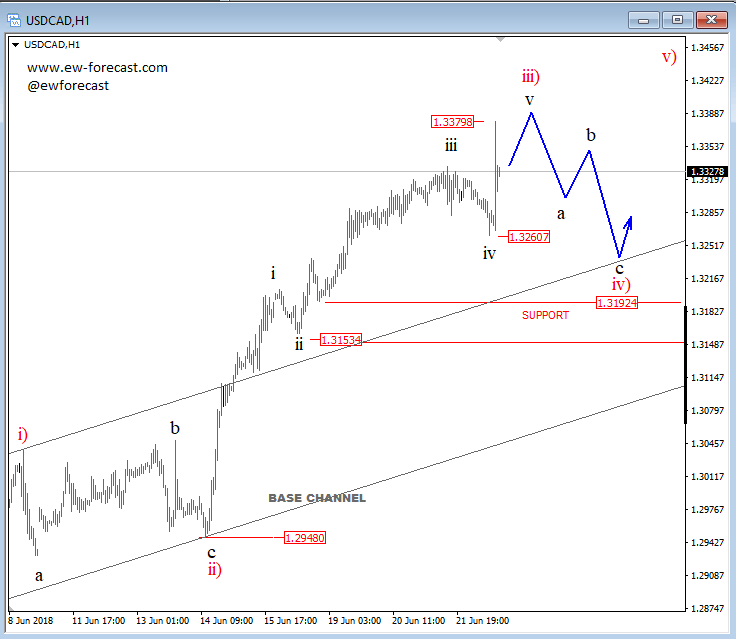
USDCAD made a spike up from 1.3260 level which we think can be sub-wave v of iii) that can see limited upside near the 1.3379/1.3380 area and push price into a temporary three-wave correction with possible support around the 1.3192/1.3153 area.
USDCAD, 1h
Weekly Focus: Trade War Risk is Increasing
Market Movers ahead
- The next scheduled date for the trade disputes is 30 June, where the US government is set to announce plans for restricting Chinese investments.
- The European Council meeting on 28-29 June will be important for whether the German government crisis is resolved, what line the new Italian government takes and possibly for the Brexit process.
- We expect the June inflation number for the euro area to be 2%, up from 1.9%, but it is likely to decline again later this year.
- The most important US inflation measure is likely to have increased in May.
- Swedish data is likely to show another trade deficit in May.
Global macro and market themes
- A further escalation in trade tensions has become our baseline scenario ahead of 6 July.
- The escalation will weigh on global economic growth.
- Equity volatility will be high, with downside risks for equities near term.
- Industrial and agricultural commodities are primarily at risk.
- The prospects of a stronger USD, lower commodity prices and weaker global growth weigh on emerging markets.
OPEC Agrees to Hike Output
- OPEC today agreed to increase output by 1mb/d to reduce 'over compliance' with the current output agreement.
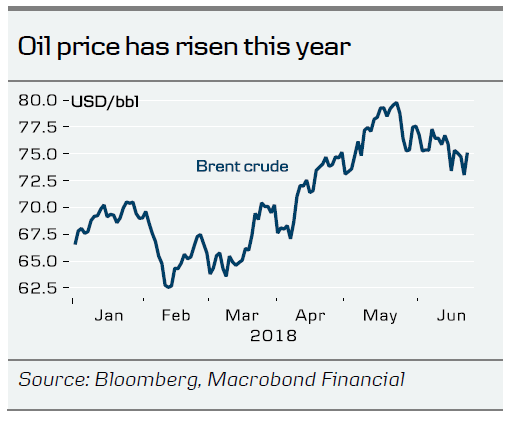
- The price on Brent crude rose above USD75/bbl on the news, as the market had feared OPEC would agree to larger output hike.
- It remains unclear what OPEC will do after the current deal expires at the end of the year – a decision on this will likely be made at next meeting on 3 December.
The Organisation of Petroleum Exporting Countries (OPEC) today agreed to lift output by 1mb/d effective from 1 July. The aim of the deal is to return total compliance to the current output agreement to 100%. Compliance has been well above 100% this year since some countries, notably Venezuela, have seen a drop in production. OPEC is set to hold the next biannual meeting on 3 December. Finally, the Republic of Congo has become an official member of OPEC.
Since November 2016, OPEC has kept production lower to support a tighter oil market balance, reduce global oil inventories and support higher oil prices. This year oil prices have rallied to the highest level since 2014 in part because OPEC has become 'over compliant' with the production cuts, due notably to falling production in Venezuela at a time when demand has been on the rise on the back of higher global economic activity. This development paved the way for a deal to return supply to the market and reduce 'over compliance'. Essentially, OPEC is raising production to maintain the current output agreement, which runs until end of the year.
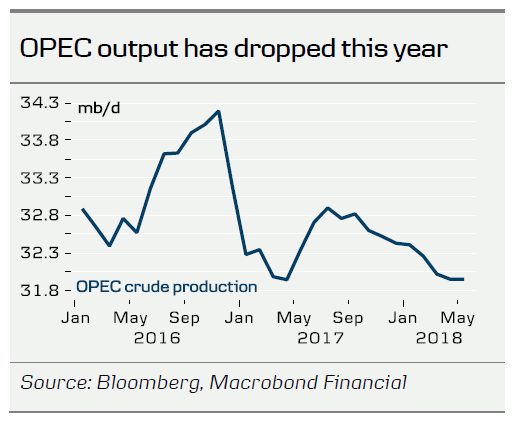
Heading into the meeting there was disagreement within OPEC on the strategy going forward. On one side, Saudi Arabia favoured output hikes, while Iran and Venezuela on the other hand stood in opposition to this strategy. Iran and Venezuela are both limited in the ability to raise production above current levels and thus do not stand to gain from an output hike.
The price of Brent crude rose about USD1/bbl to above USD75/bbl on the news. The fact that oil prices are rising when OPEC is returning supply to the market reflects a concern in the market heading into the meeting that OPEC would agree to raise output further than the level needed to ensure 100% compliance. For the rest of the year, the deal today reduces the upside risk to prices from the risk of lower output in, e.g. Iran and Venezuela, since OPEC now effectively has established a mechanism which opens the way for other countries to increase production correspondingly. It remains unclear what OPEC will do when the current deal expires at the end of the year. A decision on this will likely be made on 3 December. The deal today does not affect our current forecast for Brent to average USD72/bbl in H2 and USD73/bbl in 2019.
Sunset Market Commentary
Markets
Global core bonds traded with a slight downward bias. Strong EMU PMI’s and a decrease in tension on intra-EMU bond markets contributed to the move. The Italian 10-yr yield spread vs Germany narrows by 6 bps. Yesterday’s +23 bps widening on political news was probably again exaggerated by low volumes. The Greek 10-yr yield spread narrows by 17 bps following yesterday’s evening’s Eurogroup approval of the release of a final and higher bailout tranche and the extension of the Greek redemption profile. Greece will now start repaying its debt only from 2033 instead of 2023 and the Eurogroup agreed to re-evaluate the situation in 2032. The main losses for the Bund occurred at the start of trading. Afterwards, sideways action kicked in. Global equities traded cautiously higher after yesterday’s losses, but uncertainty on the next developments in the China-US trade dispute continues to inspire some investor caution. US yields are rising up to 1.8 bp, with the 10-y sector underperforming. German yields show a similar patter with the 5-y yields rising 1 bp.
EUR/USD gained new momentum in the run-up to the start of European trading and received an additional push on the back from stronger than expected French PMI numbers. The French outcome was later confirmed in German and EMU readings, but the magic for the single currency was over. EUR/USD settled in the upper half of the 1.16 area, before getting knocked lower around European noon. Der Spiegel reported on secret SPD meetings, preparing for fresh German elections which weighed on the euro. Reports that US officials try to boost trade talks in China in order to avoid that tariffs take effect on July 6 had no direct impact on trading. EUR/USD trades currently in the mid 1.16 area. USD/JPY gained modestly at the start of European dealings, but the risk-on trade was not strong enough to sustain further gains. The pair still struggles not to fall back below the 110 mark.
EUR/GBP followed to some extent the intraday trading pattern of EUR/USD, but price swings were much smaller. It changes hands currently around 0.8765. There were no important eco data. Regarding Brexit, there was some buzz around a statement of Airbus, questioning its UK activity/investments in case of no Brexit deal. However, the issue had no big impact on sterling trading.
News Headlines
Canada released some disappointing numbers today. Retail sales (MoM) in April dropped by 1.2%, the largest decrease in two years. Canada’s inflation rate (YoY) remained above the 2% target at 2.2% Y/Y in May. However it was less than the 2.5% forecasted. Core inflation stays at 1.9% Y/Y.
OPEC and its allies seemed to have found an agreement to raise oil output with a theoretical 1 million b/d. It appears Saudi minister of Energy has convinced Iran to support the increase, despite the criticism on a possible output increase this week as it faces export restrictions imposed by the US.
The Composite PMI in the Eurozone was 54.8, stronger than the expected 53.9. It is up from 54.1 previous month. There is however a striking difference between Manufacturing PMI (down to 55.0 from 55.5 last month) and Services PMI (up to 55.0 from 53.8 last month).
Canadian Retail Sales Drop Sharply in April
Highlights:
- Retail sales fell 1.2% in nominal terms and 1.4% excluding the impact of prices in April
- Much of the weakness came from a big pullback in auto sales in Ontario that was probably weather-related.
- We are tracking a flat reading for overall April GDP following the stronger 0.4% and 0.3% increases in February and March, respectively.
Our Take:
Much of the big 1.2% drop in nominal retail sales —1.4% controlling for the impact of price changes — was accounted for by a 4.3% plunge in auto and parts sales. Statistics Canada noted that most of that decline came from Ontario, where bad weather may have played a role in keeping shoppers at home. Soft sales at building material and clothing stores also could have been impacted by a late spring in parts of the country. If true, that should mean a bounce-back in May and June sales. For now, though, the retail sales data combined with an earlier reported drop in manufacturing sale volumes suggest that overall economic output was little changed in April. That in itself probably won’t worry the Bank of Canada too much given the April data is following strong 0.4% and 0.3% increases in GDP in February and March, respectively. The combination of somewhat slower economic growth, softer inflation data (also released this morning) and the sharp deterioration in the tone of trade discussions with the U.S. also aren’t all that encouraging, though, making a July Bank of Canada interest rate hike look like a closer call than previously thought.
Canadian Inflation Running Cooler than Expected; July Hike a Close Call
Highlights:
- Headline inflation rate held at 2.2% in May, lower than market expectations
- Energy prices surged 11.6% on back of 23% jump in gasoline prices
- Ex-energy, inflation rate stood at 1.6%, down from 1.9% in April
- The Bank of Canada’s core measures, averaged 1.9%
Our Take:
Canada’s headline inflation rate levelled out at 2.2% in May as a sharp jump in gasoline prices was largely offset by falling prices for telephone services, traveler accommodation and computers. This defied expectations that the headline rate would hit 2.6%. The bank’s core inflation measures averaged 1.9% slipping below April’s 2% print. The data, while lower, than market expectations, was largely in line with the bank’s forecast for a 2.3% average rate in Q2 with the core measures holding close to 2%.
Today’s report confirms that inflation is tracking the bank’s forecast but undoubtedly the focus for policymakers has shifted toward the growing threat to the economy from the strained relations with the US. Mutterings about levying import tariffs on motor vehicles combined with the discouraging headlines regarding NAFTA have dampened market expectations that the bank will raise the overnight rate in July. Economic reports have also weighed on rate hike expectations with a softening in manufacturing activity and retail sales teeing up for a flat reading on April GDP. But this slower-than-trend increase follows two very solid gains in February and March and is still consistent with the economy growing at an above potential pace in the second quarter. With limited spare capacity, this will likely be enough for the data-dependent central bank to follow through and hike the overnight rate next month though recent developments have made it a closer call. Further rate increases however will be slow to materialize as the bank factors in the impact of heightened uncertainty on the outlook for trade and investment.
Canada: Decline in Auto Sales Weighs on Retail Sales in April
Retail sales declined 1.2% (m/m) in April, coming in considerably weaker than the consensus forecast for a flat reading. The decline was even stronger in real terms, with volumes falling by 1.4% during the month.
The disappointing headline was largely due to weaker sales at motor vehicles and parts dealers, which declined by 4.3% following two months of strong sales. Excluding this category, the picture was somewhat better, with sales remaining flat on the month. The market was expecting ex-auto sales to rise by 0.7%.
Only a handful of categories posted an increase in April. Sales rose at food and beverage stores (+2.3%), electronics and appliance stores (+1.6%) and gasoline stations (+1.4%). Meanwhile, sales of clothing & accessories declined 1.3% on the month and a slowing housing market weighed on sales of building materials & garden equipment (-3.3%) as well as furniture & home furnishings (-1.5%).
Regionally, retail activity slowed in six of ten provinces. The largest declines were seen in Quebec (-2.7%), New Brunswick (-2.5%) and Ontario (-2.3%). Activity picked up in Saskatchewan, Alberta, British Columbia and Nova Scotia.
Key Implications
Today's retail sales report is nothing to write home about. The slowdown in auto sales was largely expected, but the ex-auto print still came in considerably weaker with few categories to fill in the dent left by retreating auto sales.
While the retail spending this year has been on a softer side, it is important to keep in mind that it is slowing from an usually strong pace seen last year. We have long said that the repeat performance is unlikely, and thus some of the moderation in retail activity this year reflects a return to more normal patterns of economic growth. A housing market slowdown and a more moderate pace of job creation are also keeping tabs on retail sales this year.
Even after today's decline, GDP growth in the second quarter is tracking 2.4% (annualized), with growth for the year as a whole expected to average 2%, in line with our recently published forecast.