

Sample Category Title
GBP/JPY Weekly Outlook
GBP/JPY rebounded last week and breached 146.46 minor resistance. But momentum was rather unconvincing. Initial bias stays neutral this week first. On the downside, below 144.37 will target 143.18 first. Break will resume larger decline from 156.59 and target 139.25/47 cluster support level. However, break of 148.10 will resume the rebound from 143.18 and that will also be the first sign of near term reversal.
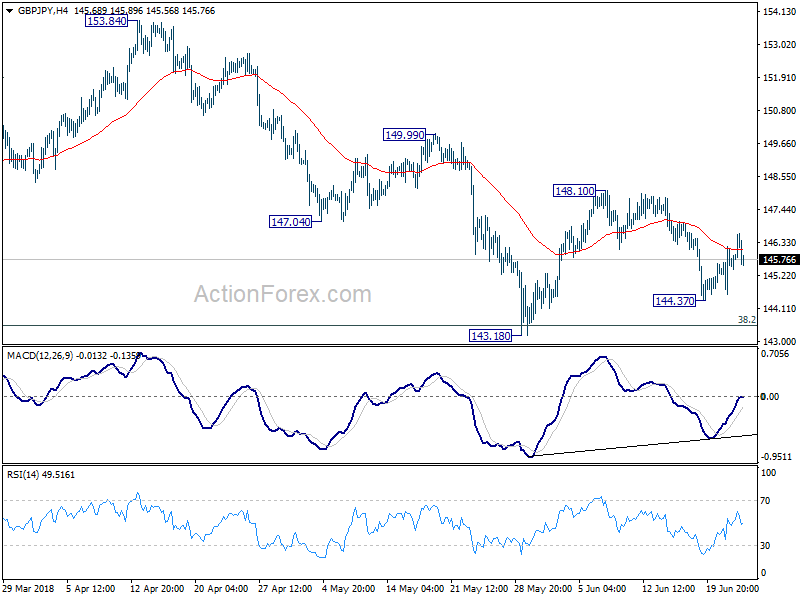
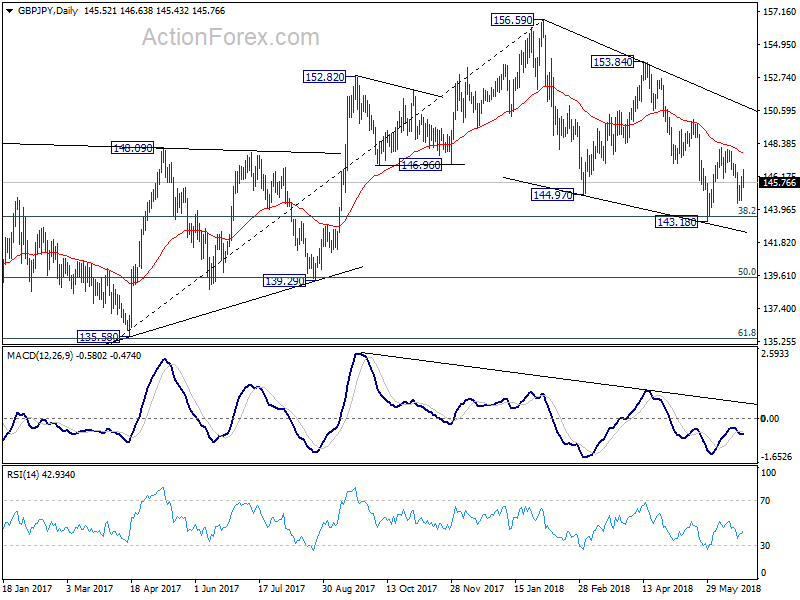
In the bigger picture, no change in the view that decline from 156.59 is a corrective move. In case of another fall, strong support should be seen above 139.29 cluster support (50% retracement of 122.36 to 156.59 at 139.47) to contain downside and bring rebound. Meanwhile, break of 153.84 should confirm that the correction is completed and target 156.59 and above to resume the medium term up trend.
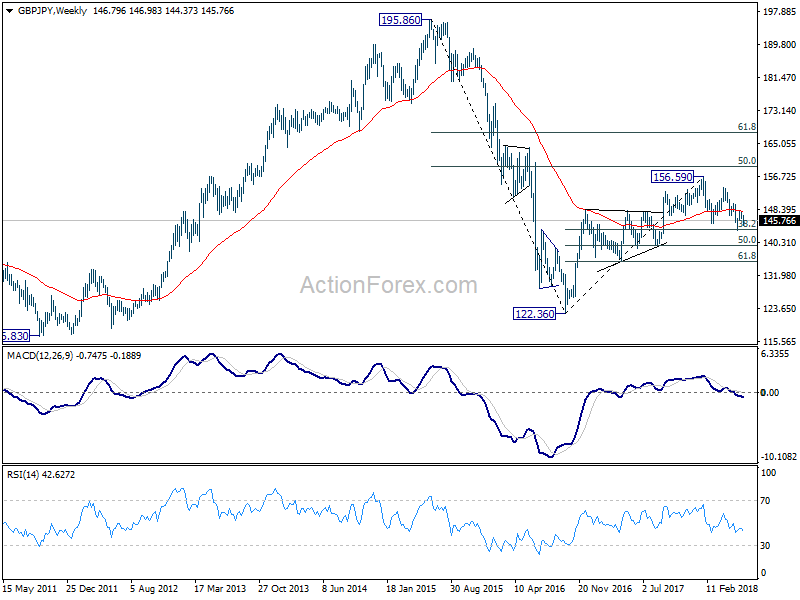
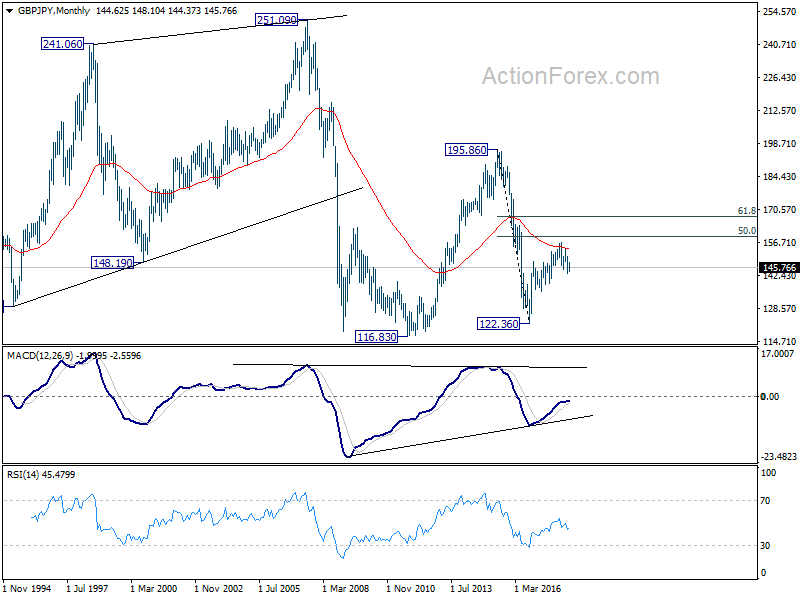
In the longer term picture, the failure to sustain above 55 month EMA (now at 153.83) is mixing up the outlook. Nonetheless, as long as 139.29 holds, rise from 122.26 is in favor to extend to 50% retracement of 195.86 (2015high) to 122.36 (2016 low) at 159.11, and possibly further to 61.8% retracement at 167.78 before completion. However, firm break of 139.29 will turn focus back to 116.83/122.36 support zone instead.
EUR/JPY Weekly Outlook
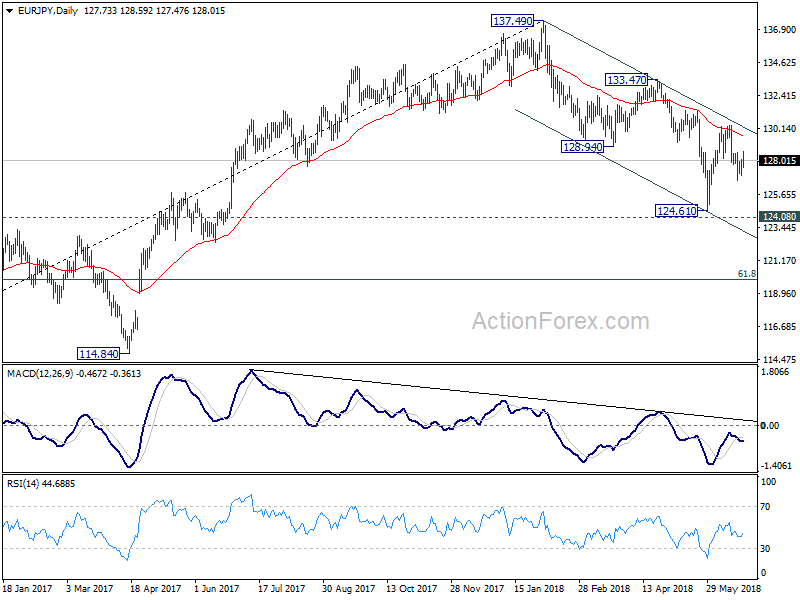
EUR/JPY dipped to as low as 126.63 last week but rebounded from there. Despite breaching 128.50 minor resistance, the momentum of the rebound is not too convincing. Initial bias is neutral this week first. On the upside, break of 130.33 resistance will confirm resumption of rise from 124.61. That will also revive the case of near term reversal and turn bias to the upside for 133.47 key resistance. On the downside, break of 126.63 will bring retest of 124.61 low instead.

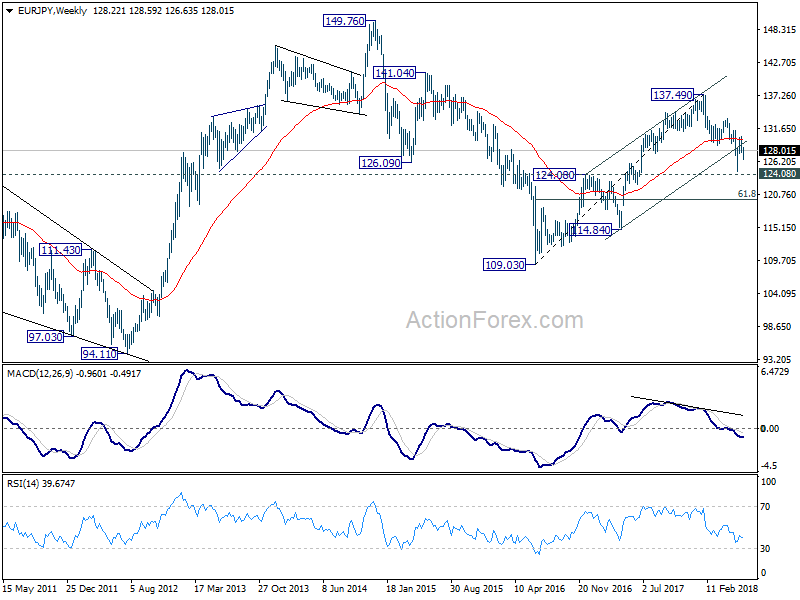
In the bigger picture, despite rebounding strongly ahead of 124.08 resistance turned support, there was no clear follow through buying. Note again that there is bearish divergence in daily MACD. Firm break of 124.08 will confirm trend reversal. That is, whole rise from 109.03 (2016 low) has completed at 137.49 already. In that case, deeper fall should be seen back to 61.8% retracement of 109.03 to 137.49 at 119.90 and below. Nonetheless, decisive break of 133.47 key resistance will likely extend the rise from 109.03 through 137.49 high.
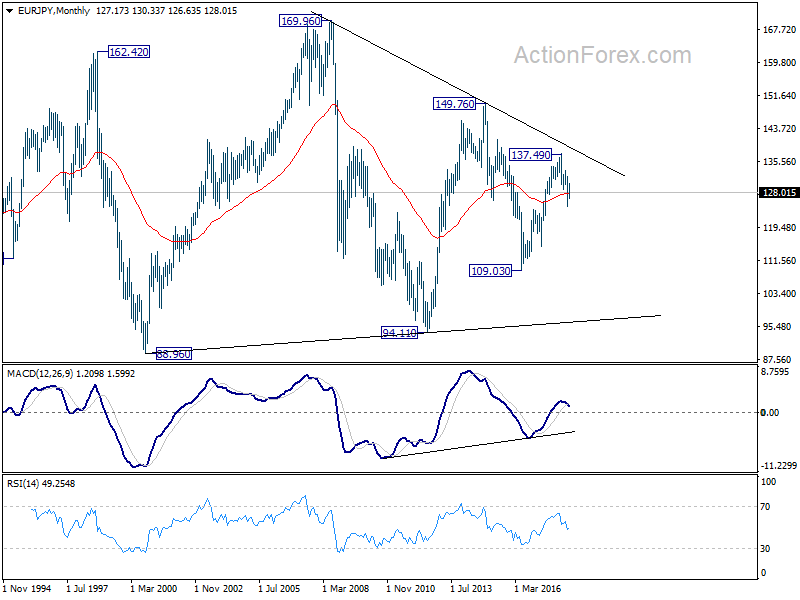
In the long term picture, at this point, EUR/JPY is staying in long term sideway pattern, established since 2000. Rise from 109.03 is seen as a leg inside the pattern. As long as 124.08 support holds, further rally is in favor in medium to long term through 149.76 high. However, break of 124.08 could extend the fall through 109.03 low instead.
EUR/AUD Weekly Outlook
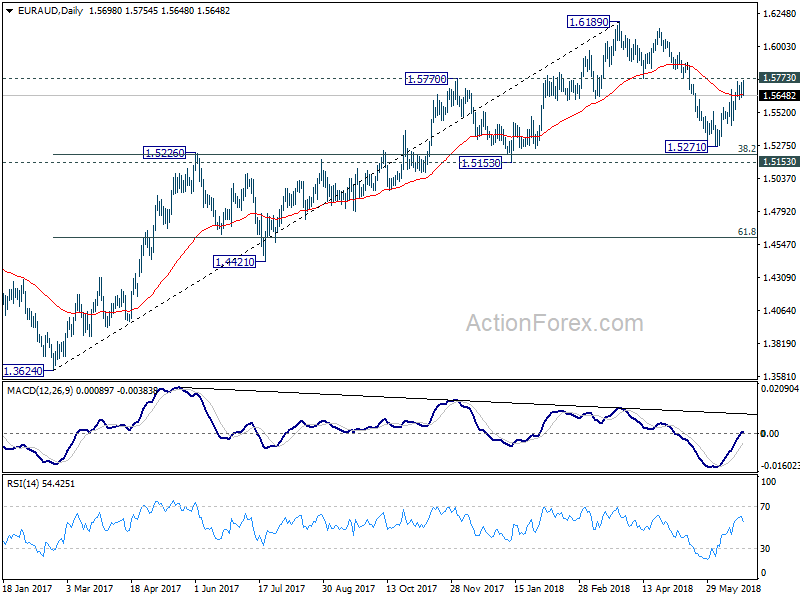
EUR/AUD's rebound from 1.5271 extended higher last week but lost momentum ahead of 1.5773 key support turned resistance. Initial bias stays neutral this week first. Sustained break of 1.5773 will indicate that whole decline from 1.6189 has completed with three waves down to 1.5271 already. And retest of 1.6189 should be seen next. On the downside, break of 1.5617 minor support will turn bias to the downside for 1.5425. Break there will confirm completion of rebound from 1.5271 and target this low again.
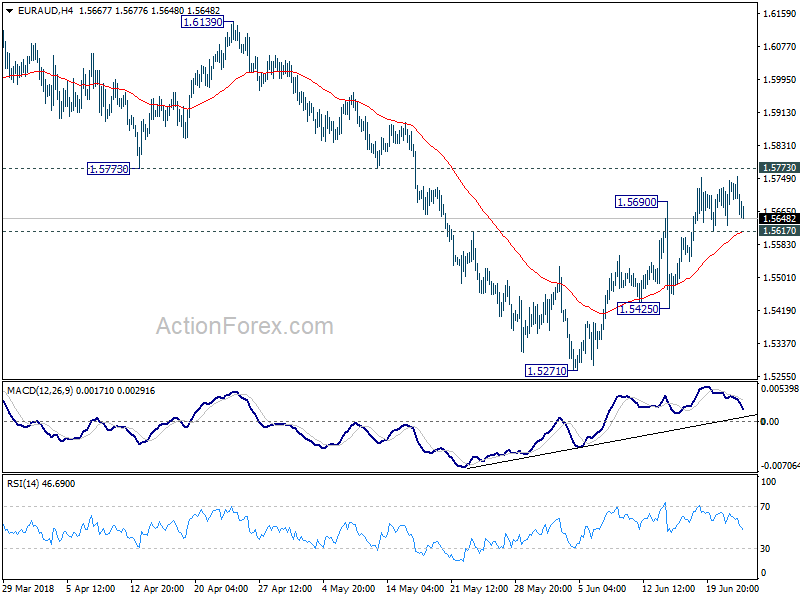
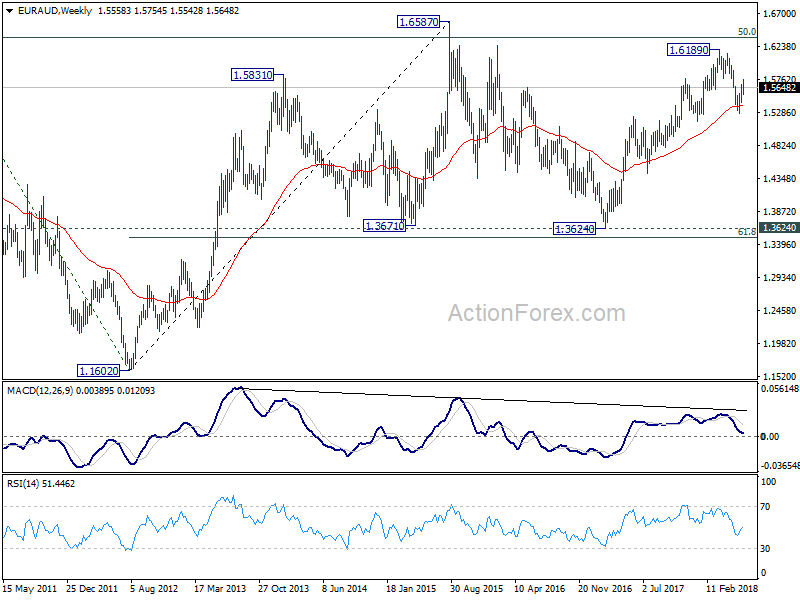
In the bigger picture, focus is back on 1.5773 support turned resistance with the current strong rebound. Firm break there will argue that medium term rise from 1.3624 (2017 low) is not completed yet. Further break of 1.6189 will target 1.6587 key resistance (2015 high). Though, rejection by 1.5773 will revive the case of bearish trend reversal and target 61.8% retracement of 1.3624 to 1.6189 at 1.4604.
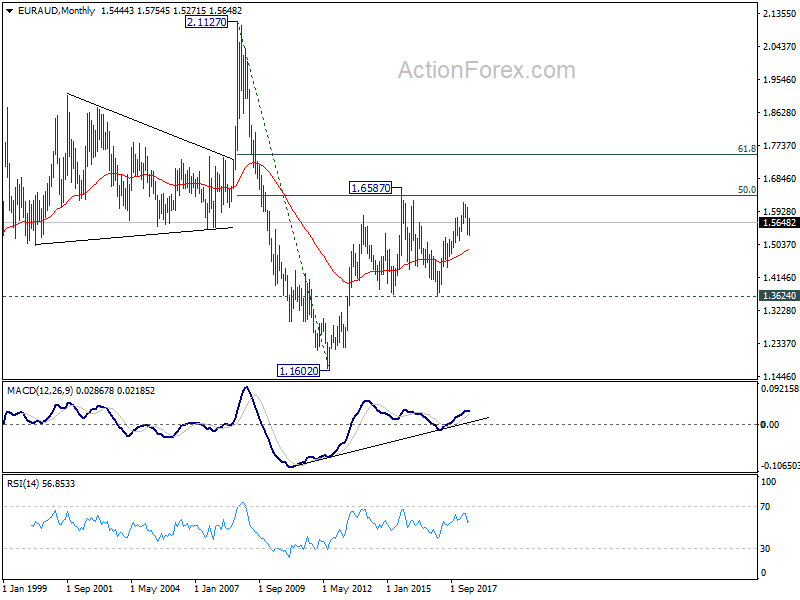
In the longer term picture, the rise from 1.1602 long term bottom (2012 low) isn't over yet. We'll keep monitoring the development but there is prospect of extending the rise to 61.8% retracement of 2.1127 to 1.1602 at 1.7488 and above. However, sustained trading below 1.3624 key support should indicate long term reversal and target 1.1602 long term bottom again.
EUR/GBP Weekly Outlook
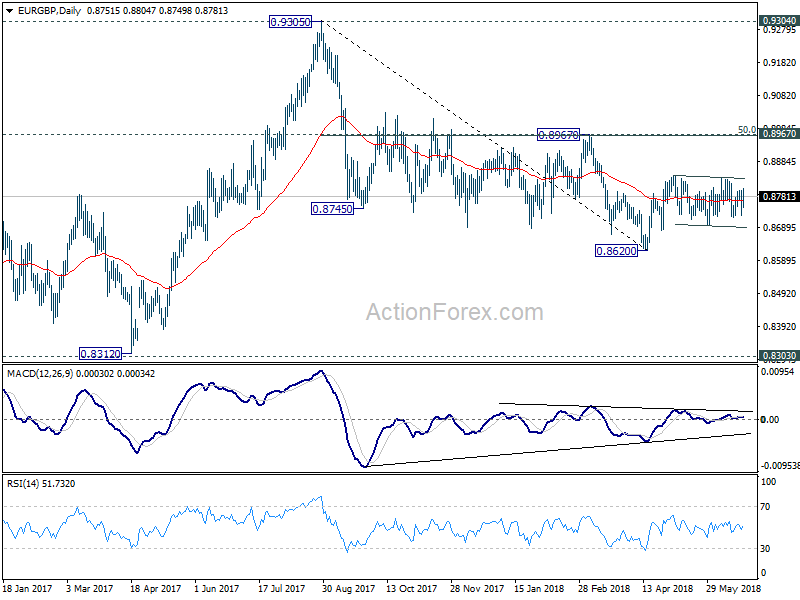
EUR/GBP's range trading continued last week, inside 0.8693/8844. Intraday bias remains neutral this week first. More consolidative trading could be seen. But still, as long as 0.8693 minor support holds, further rally is in favor. On the upside, break of 0.8844 will resume the rebound from 0.8620 for 0.8967 cluster resistance (50% retracement of 0.9305 to 0.8620 at 0.8963). However, break of 0.8693 will bring deeper fall back to retest 0.8620 low.
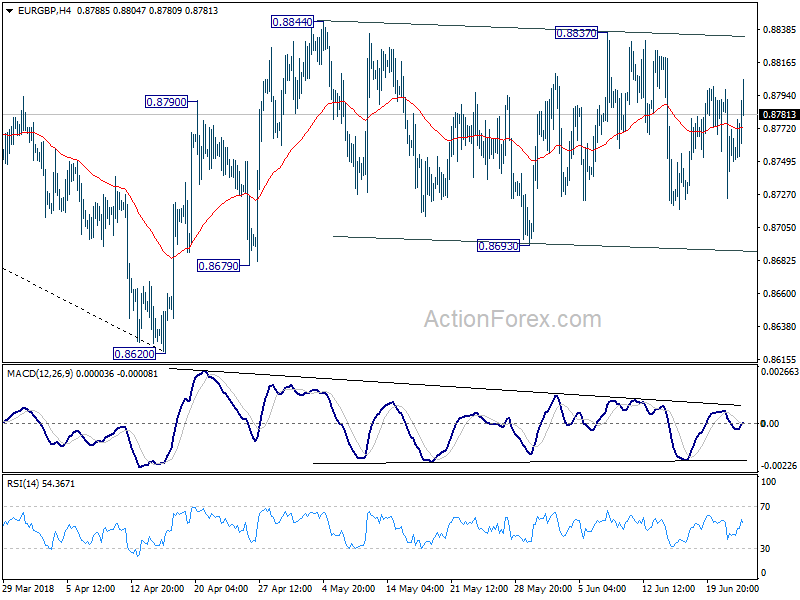
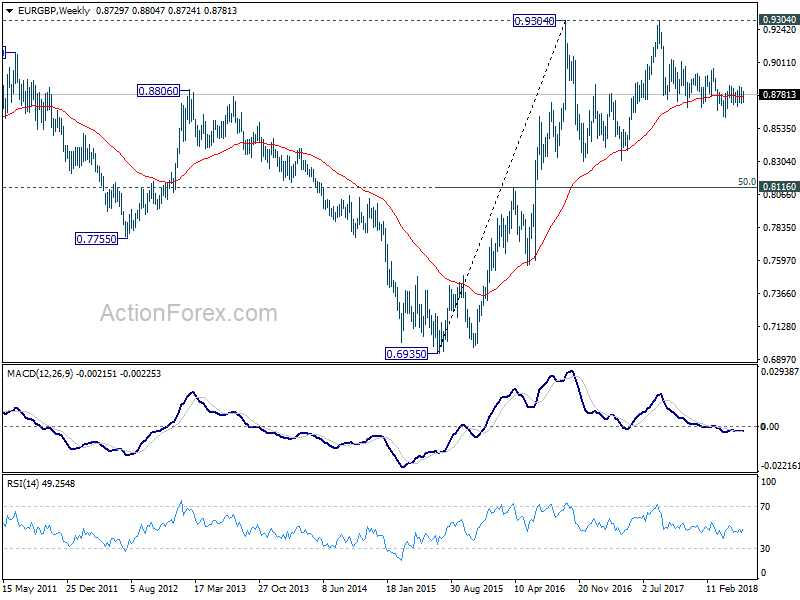
In the bigger picture, for now, the decline from 0.9305 is seen as a leg inside the long term consolidation pattern from 0.9304 (2016 high). Such consolidation pattern could extend further. Hence, in case of strong rally, we'd be cautious on strong resistance by 0.9304/5 to limit upside. Meanwhile, in another decline attempt, we'd expect strong support from 0.8116 cluster support (50% retracement of 0.6935 to 0.9304 at 0.8120) to contain downside.
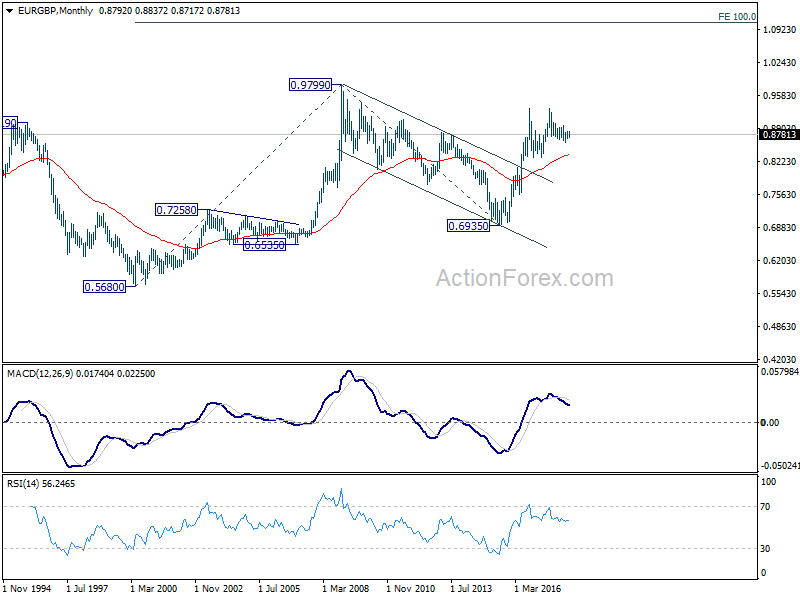
In the long term picture, we're holding on to the view that rise from 0.6935 (2015 low) is resuming the up trend from 0.5680 (2000 low). Hence, after the consolidation from 0.9304 completes, we'd expect another medium term up trend through 0.9799 to 100% projection of 0.5680 to 0.9799 from 0.6935 at 1.1054.
EUR/CHF Weekly Outlook
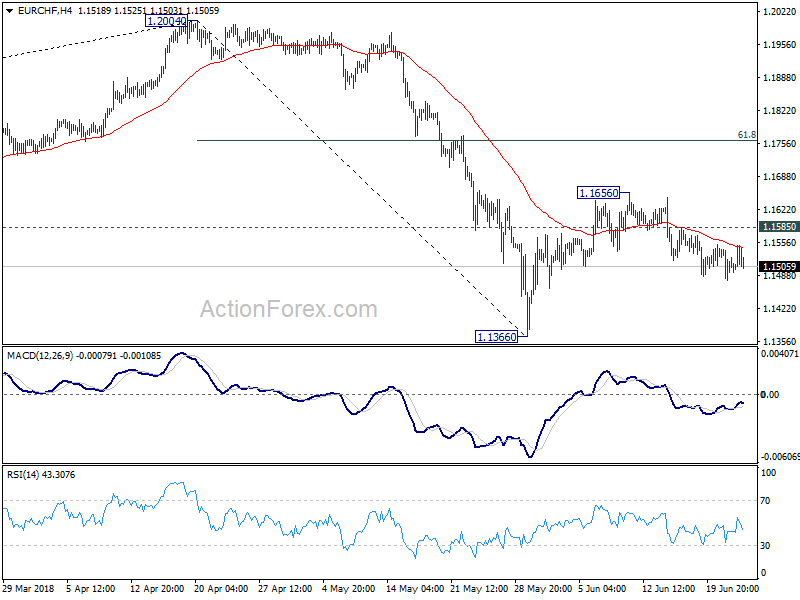
EUR/CHF gyrated lower last week as rebound from 1.1366 could have completed at 1.1656 already. Downside momentum has been a bit convincing. Nonetheless, deeper fall is expected this week as long as 1.1585 minor resistance holds, for 1.1366 low. Break there will resume the corrective fall from 1.2004. On the upside, though, above 1.1585 will likely extend the rebound from 1.1366 through 1.1656. But in that case, upside should be limited by 61.8% retracement of 1.2004 to 1.1366 at 1.1760.
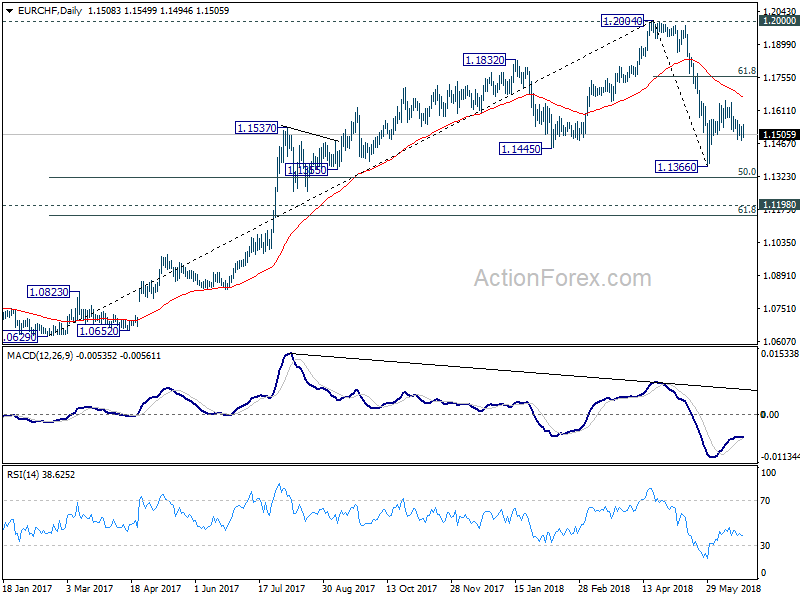
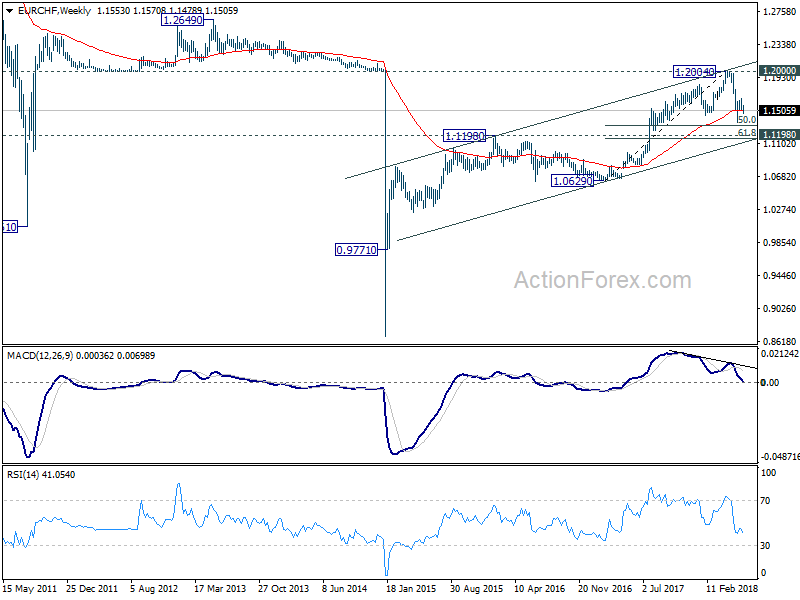
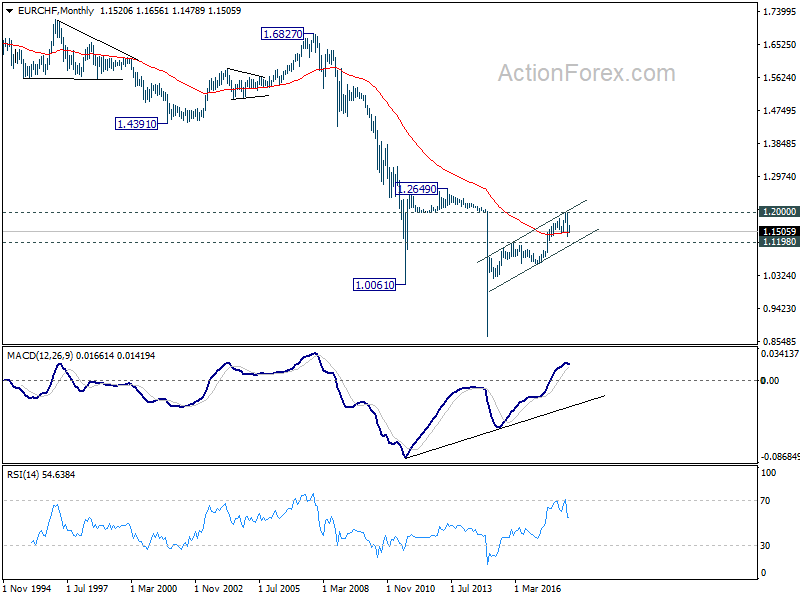
In the bigger picture, current development suggests solid rejection by prior SNB imposed floor at 1.2000. Considering bearish divergence condition in daily and weekly MACD, 1.2004 should be a medium term top. And price action from 1.2004 is correcting the up trend from 1.0629. Such correction is expected to extend for a while and therefore, we're not anticipating a break of 1.2004 in near term. Another decline cannot be ruled out yet. But in that case, strong support should be seen at 1.1198 (2016 high), 61.8% retracement of 1.0629 to 1.2004 at 1.1154 to contain downside.
Swiss Franc and Yen Ended as Strongest, Worst of Trade War Yet to Come
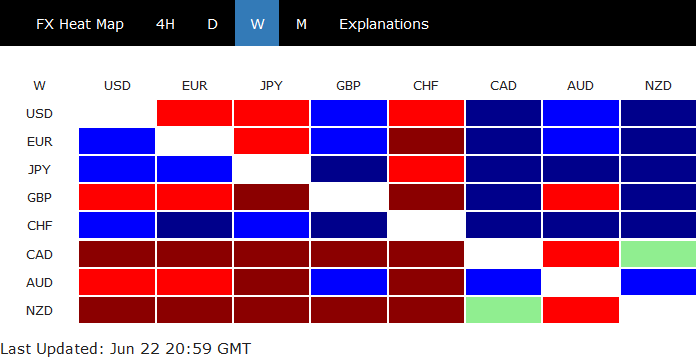
The Swiss Franc and Japanese Yen ended last week as the strongest major currencies. Sentiments were hurt deeply by worries on global trade war. Over week, DOW lost -2.03%, S&P 500 lost -0.89%, DAX was down -3.31%, CAC dropped -2.08%, Nikkei lowered by -1.47%. China's Shanghai composite suffered most by declining -4.37%. FTSE was the rare gain and ended the week up 0.63%. Canadian Dollar and New Zealand Dollar ended as the weakest ones after weak economic data. In particular, poor retail sales from Canada has most likely ruled out the chance of a July BoC hike. Even though oil price staged a strong rebound on much smaller than expected output raise by OPEC, boost to the Loonie was limited. Also, Sterling was the third weakest one as there wasn't enough sustainable buying after more hawkish than expected BoE rate decision.
Trade tensions escalate on all front, the worst is yet to come
Let's have a recap on global trade war developments first. US President Donald Trump ignored warning from industry groups and disgarded all previous agreements during the negotiations with China. The US Trade Representative announced to impose Section 301 tariffs on USD 34B in China imports in the first phase on June 15, effective July 6. China quickly announced retaliation to to USD 34B in US products including soybean, agricultural products, automobiles, effective July 6 too. Trump then ordered the USTR, on July 19, to study additional 10% tariffs on USD 200B worth of Chinese products, in response to China's retaliation. China vowed to fight back with "qualitative" and "quantitative" for any additional tariffs.
During last week, there were reports that there is a split in the White House on the way to handle trade dispute with China. And some are pushing to restart the negotiations before the above mentioned tariffs come into effect. But to us that's more smokescreen than anything. If Trump's attention is to get some sort of "deal" out of the talks, negotiations won't be stopped so abruptly. And it will certainly not be followed by strong words that raises the tension further. Trump has already demonstrated his way of negotiating in good faith by giving all the concessions on North Korea's empty promises.
US-China trade war is now no longer a so called "tactic" but a reality that's gradually coming true. Also, The stakes that Trump raised already exceed total amount of US imports to China. China would have to turn to non-tariff measures to counter US bullying. The impact of that could be even more destructive to the economies of both country.
On another front, Trump stopped the temporary exemption on steel and aluminum tariffs for EU, Canada and Mexico on June 1. EU formally announced on June 20 its retaliation. The total EU exports to the US affected are valued at EUR 6.4B. For now, EU imposed US products in EUR 2.8B worth first, effective on Friday June 22, that was, yesterday. Duties on the remaining EUR 3.6B in US goods will take place at a later stage, "in three years' time or after a positive finding in WTO dispute settlements.
After seeing no concession from the EU even though a "gun pointed to their heads", Trump is going to use a "bigger" gun to threaten his close allies. He said on Friday to impose 20% tariffs of cars if EU doesn't "remove" the trade barriers to US vehicles. He tweeted: "Based on the Tariffs and Trade Barriers long placed on the U.S. and it great companies and workers by the European Union, if these Tariffs and Barriers are not soon broken down and removed, we will be placing a 20% Tariff on all of their cars coming into the U.S. Build them here!"
European Commission Vice President Jyrki Katainen told French newspaper Le Monde that "if they decide to raise their import tariffs, we'll have no choice, again, but to react. And, he added that "We don't want to fight (over trade) in public via Twitter. We should end the escalation."
The trade spats are not going to end any time soon. And, let's be reminded that NAFTA negotiation is unresolved, and the auto tariffs will have a big impact on both Canada and Mexico. We have certainly not seen the worst from Trump yet.
DOW could be resuming medium term correction from 26616.71
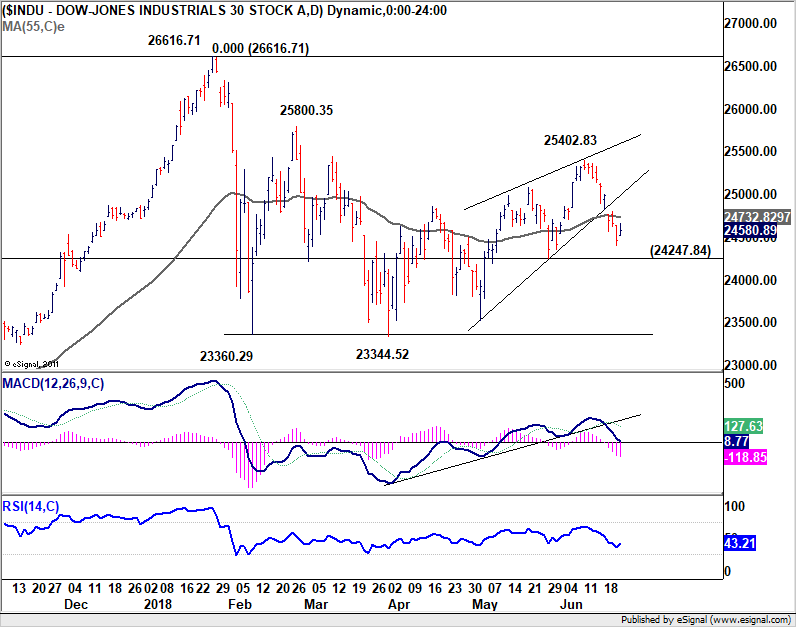
As we mentioned during the week, DOW's sharp fall argues that corrective rise from 23344.52 could have completed earlier than expected at 25402.83 already. Break of 24247.84 near term support will affirm this view and bring deeper fall through 23344.52 to extend the correction from 26616.71 high.
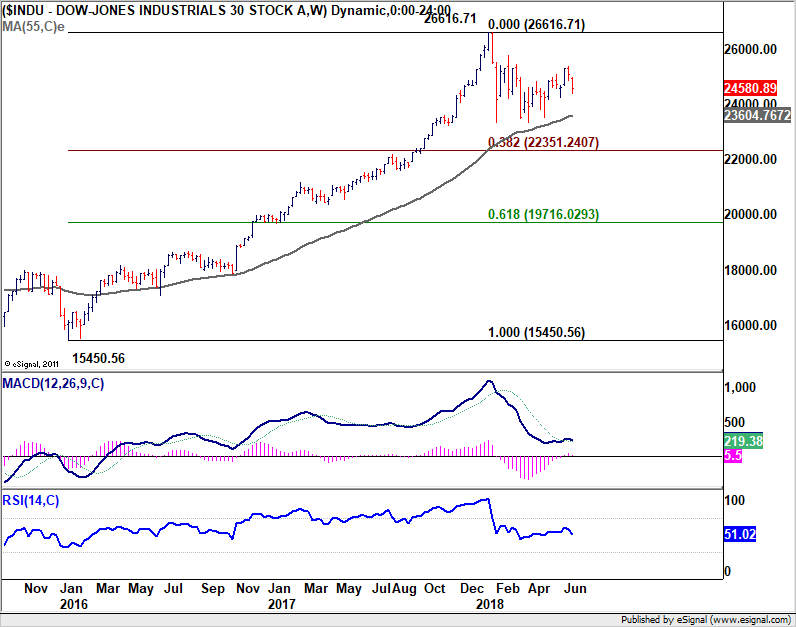
Our medium term view remain unchanged. Correction from 26616.71 should extend to 38.2% retracement of 15450.56 to 26616.71 at 23351.24 before completion.
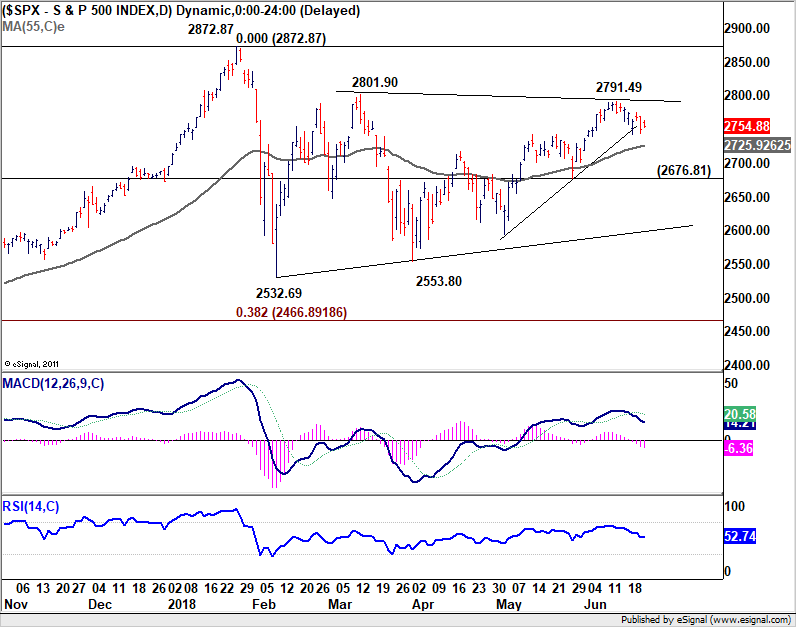
The picture in S&P 500 is less bearish. With less confidence, we're favoring the case that choppy rise from 2553.80 is completed at 2791.49, ahead of 2801.90 resistance. Break of 55 day EMA at 2725.92 will be the first sign that affirm this view. Further break of 2676.81 should bring deeper fall through 2553.80 support.
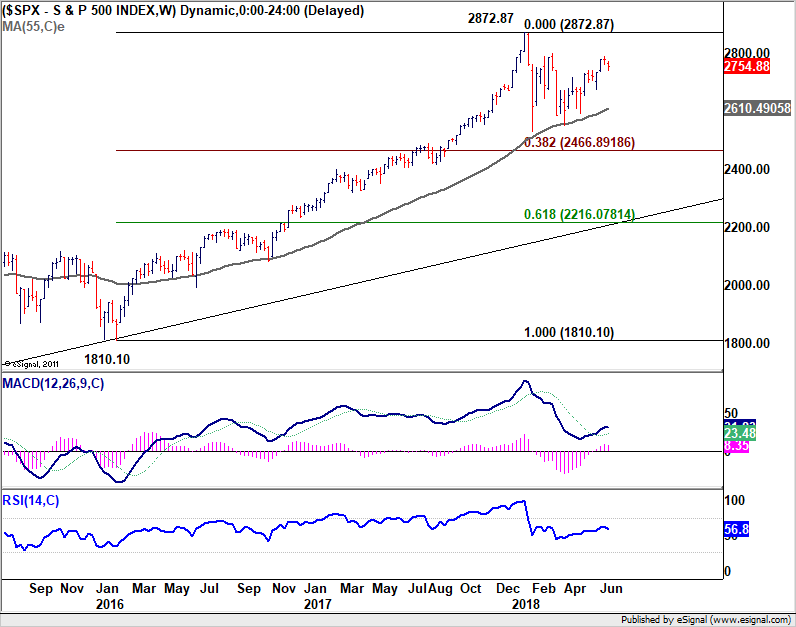
Medium term outlook is similar to DOW though. Correction from 2872.87 is extended to extend with another fall to 38.2% retracement of 1810.10 to 2872.87 at 2466.89 before completion.
DAX reversing near term trend
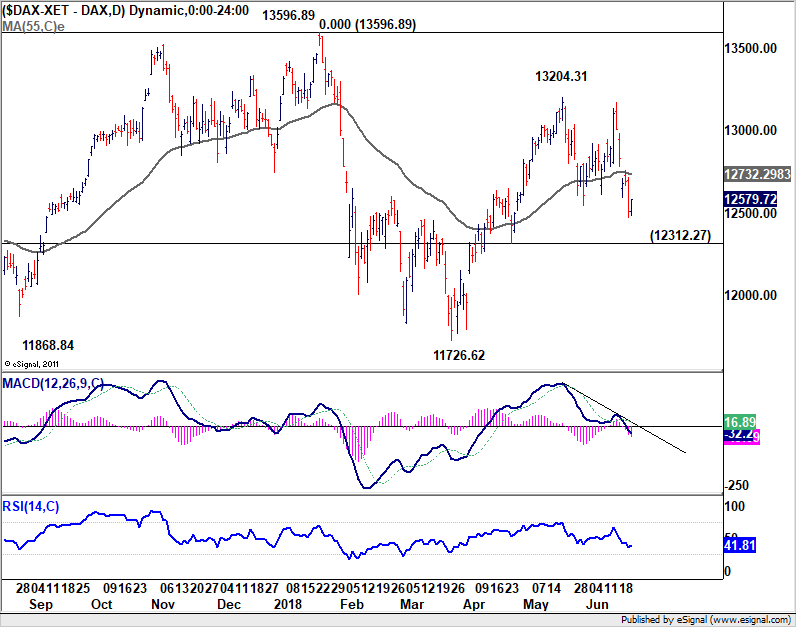
DAX's break of 12547.81 support suggests that rebound from 11726.62 has completed at 13204.31 already. Deeper fall is in favor to 12312.27 support. Firm break there will confirm this bearish case and target 11726.62 key support level next.
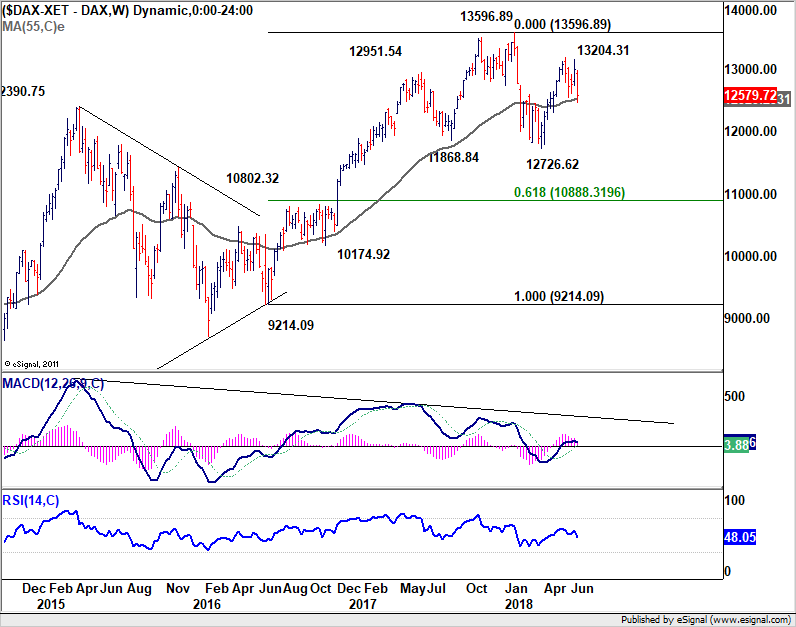
More importantly, the weekly chart shows a possibly head and shoulder top pattern (ls: 12951.54, h: 13596.89, rs: 13204.31). Firm break of 12726.62 could mark a change in long term trend.
Chinese stock markets could worsen very quickly
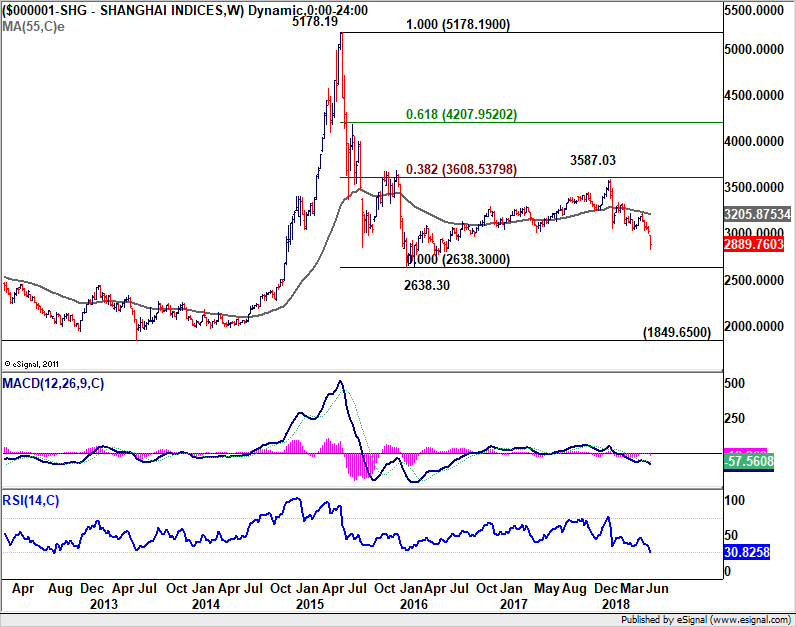
Now, let' move to the worst performing one, the Shanghai Composite. The SSE gapped through a psychological importantly 3000 handle last week, reached as low as 2837.14, before closing at 2889.76. It's clear that medium term corrective rise from 2638.30 has completed at 3587.03, ahead of 38.2% retracement of 5178.19 to 2638.30 at 3587.03.
The downside acceleration now suggests that fall from 3587.03 is an impulsive move. That is, it's resuming the fall from 5178.19, rather than extending the sideway pattern from 2638.30 as the second leg. That is, the risk of break through 2638.30 low to next key support at 2013 low at 1849.65 has surged sharply. Barring intervention by the authoritarian Chinese government, the stock markets in China could worse very quickly ahead.
Dollar index still on track to 97.87 fibonacci resistance
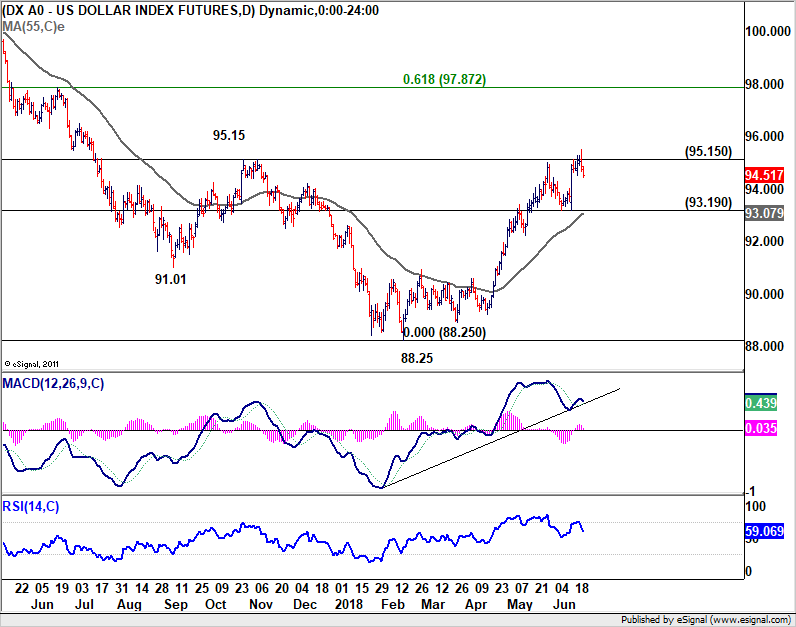
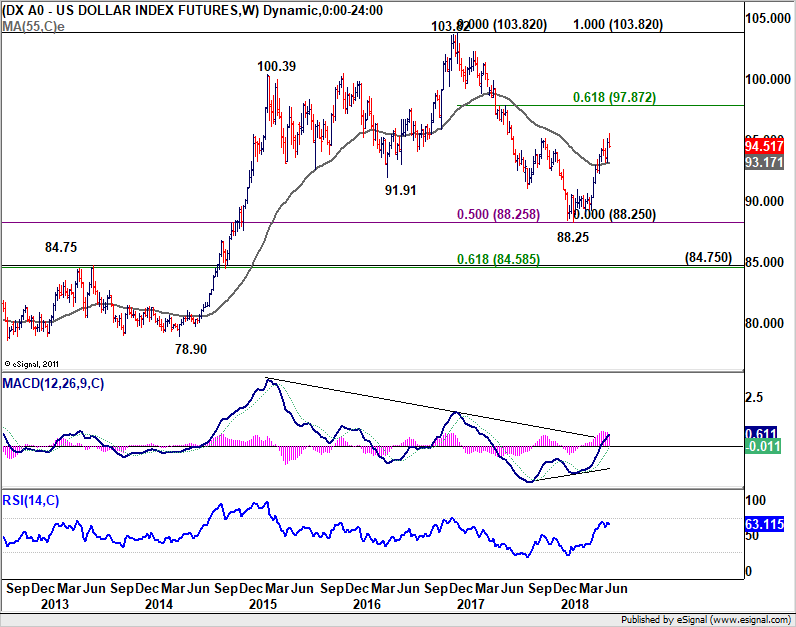
Dollar index's break of 95.15 resistance last week was unconvincing. That's primarily due to resilience in Euro due to data, and strength in Yen on risk aversion. Nonetheless, further rise is expected as long as 93.19 support holds, even in case of deeper retreat. Current rebound from 88.25 should target 61.8% retracement of 103.82 to 88.25 at 97.82.
WTI surged on smaller than expected oil production hike
On Saturday, major non-OPEC oil producing countries met with OPEC representatives and endorsed the output increases the latter agreed on Friday. The nominal target is 1 million barrels a day of production raise. In real terms, it's believed to be at 600k-700k barrels a day as some countries are unable to raise their output. Saudi Arabia and Russia are seen as the biggest winner out of the deal and they hold most spare capacity. Both stand ready to eat up the market share with US sanctions on Iran and Venezuela. There is no details on the split between OPEC and non-OPEC producers yet.
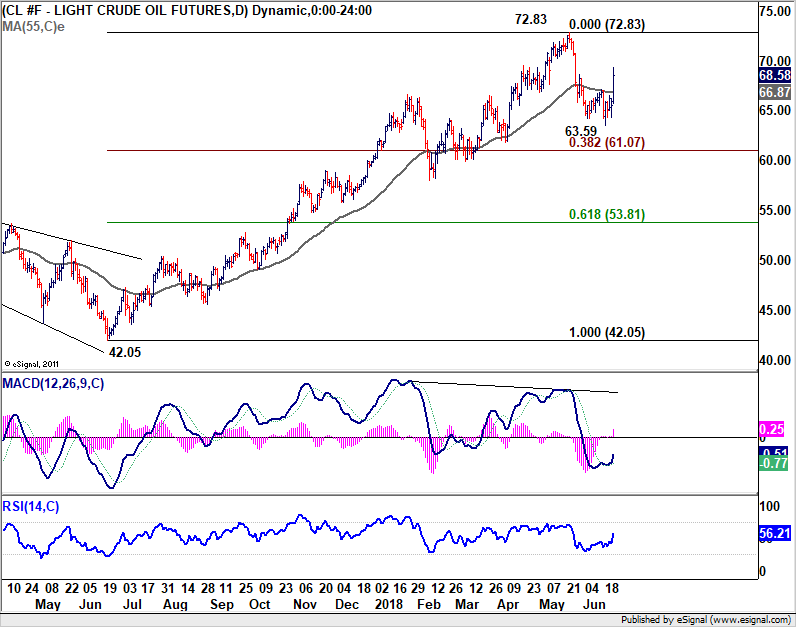
WTI crude oil on Friday as the increase was much smaller than the worst expected. The pull back from 72.83 is likely finished at 63.59, ahead of 38.2% retracement of 42.05 to 72.83 at 61.07. Further rebound is in favor to retest 72.83. At this point, we're not anticipating a break there yet as the medium term consolidation pattern from 72.83 could take some more time to develop.
USD/CHF Weekly Outlook
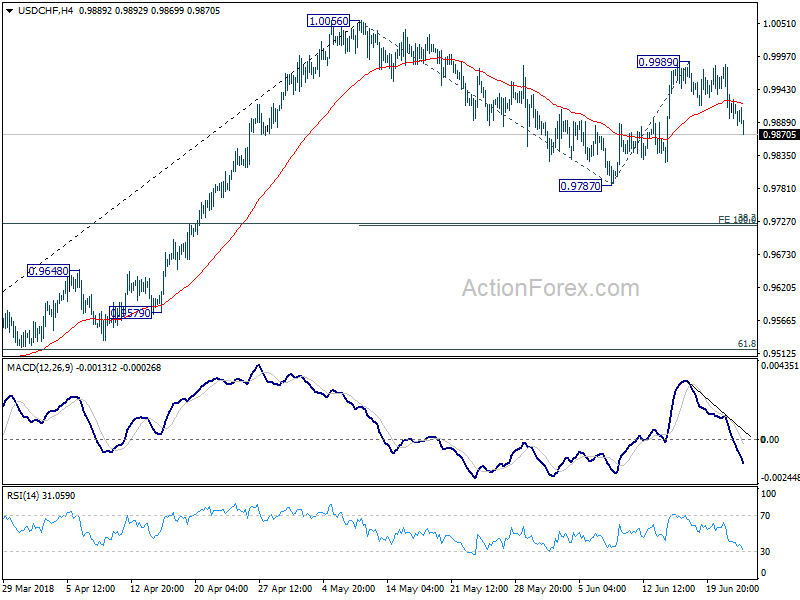
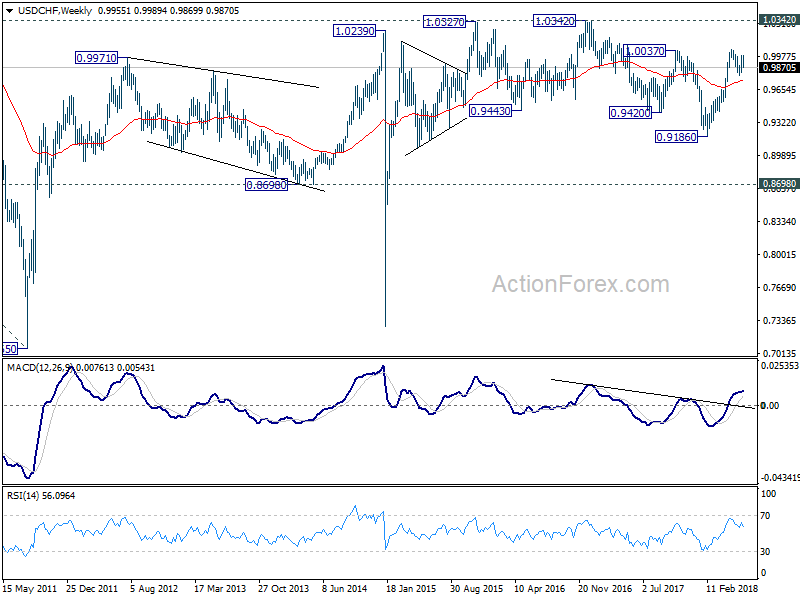
USD/CHF dropped sharply towards the end of last week. The development suggests that rebound from 0.9787 has completed at 0.9989 already. More importantly, the corrective pattern from 1.0056 is extending. Initial bias remains on the downside this week for 0.9787 and below. Though, we'd expect strong support from 0.9720/4 cluster support (38.2% retracement of 0.9186 to 1.0056 at 0.9724, 100% projection of 1.0056 to 0.9787 from 0.9989 at 0.9720) to bring rebound. On the upside, above 0.9989 will bring retest of 1.0056 high first.
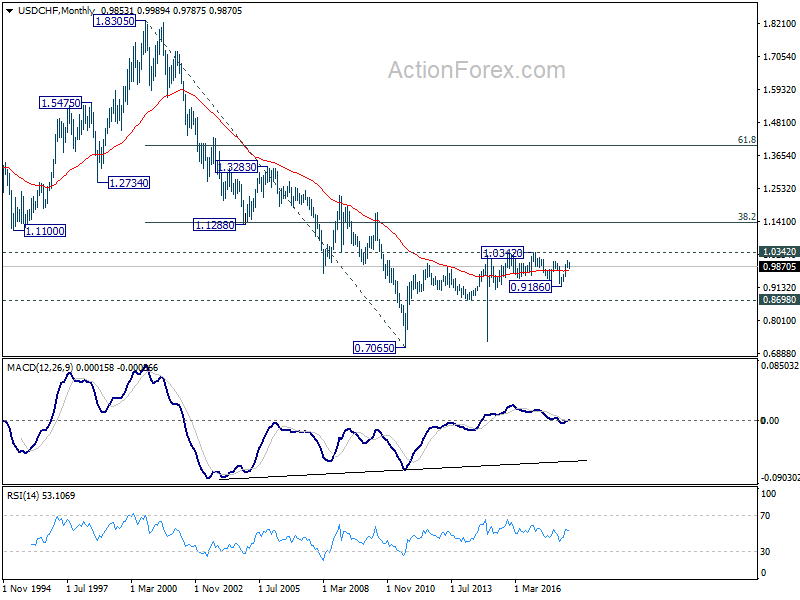
In the bigger picture, medium term decline from 1.0342 has completed with three waves down to 0.9186. Rise from there is currently viewed as a leg inside the long term range pattern. Hence, while further rally would be seen, we'd be cautious on strong resistance from 1.0342 to limit upside. For now, further rise is expected as long as 38.2% retracement of 0.9186 to 1.0056 at 0.9724 holds. However, sustained break of 0.9724 will dampen this bullish view and would at least bring deeper fall to 61.8% retracement at 0.9518.
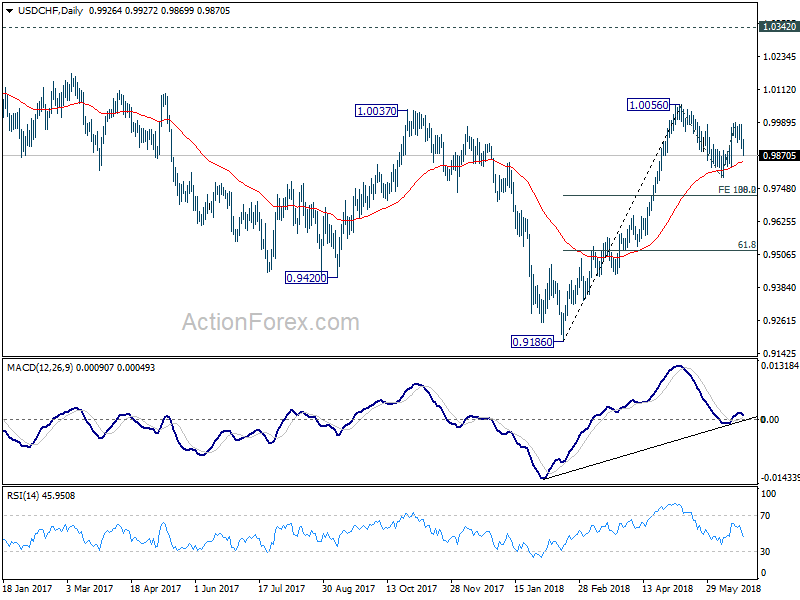
In the long term picture, price actions from 0.7065 (2011 low) are not clearly impulsive yet. Thus, we'll treat it as developing into a corrective pattern, at least, until a firm break of 1.0342 resistance.
Summary 6/25 – 6/29
Monday, Jun 25, 2018
[php_everywhere instance="1"]
Tuesday, Jun 26, 2018
[php_everywhere instance="2"]
Wednesday, Jun 27, 2018
[php_everywhere instance="3"]
Thursday, Jun 28, 2018
[php_everywhere instance="4"]
Friday, Jun 29, 2018
[php_everywhere instance="5"]
Weekly Economic and Financial Commentary: Housing Starts Rise as Inventory Holds Back Sales
U.S. Review
Housing Starts Rise as Inventory Holds Back Sales
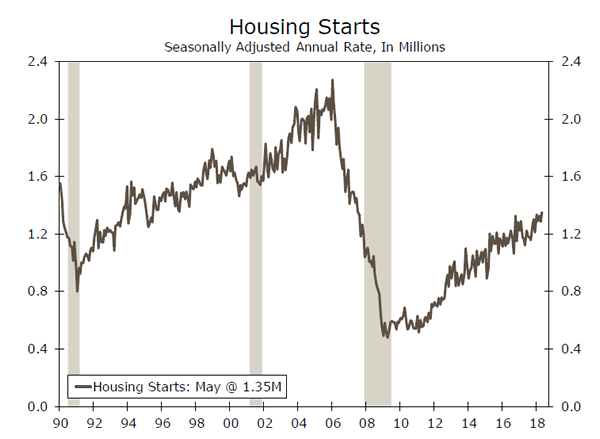
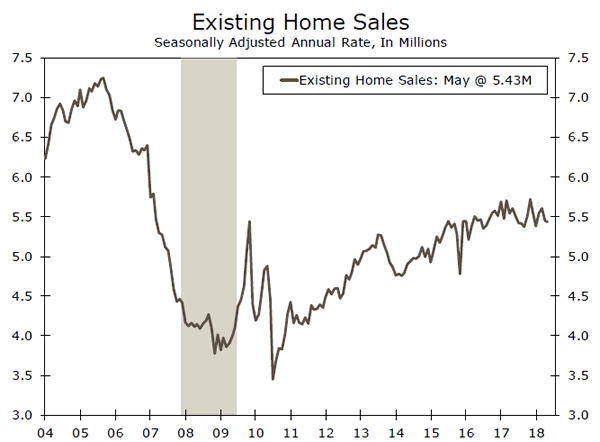
- Following April's upwardly-revised 3.1 percent fall, housing starts bounced back solidly in May, rising 5.0 percent to a 1.35 million-unit pace. Existing home sales fell for the second straight month in May and have fallen 3 percent over the past year, while inventory of homes for sale has fallen over 6 percent.
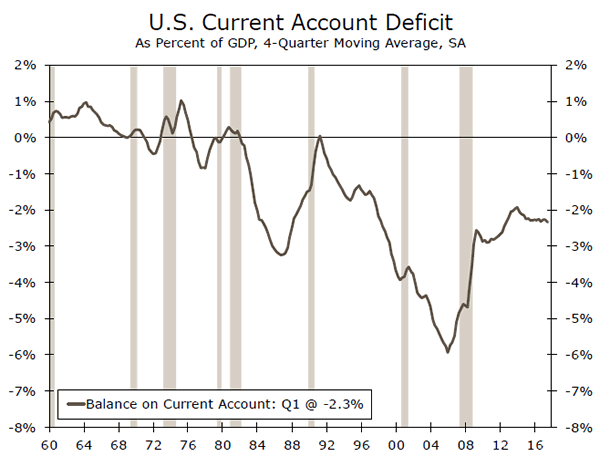
- The current account deficit widened in Q1 following an upwardly-revised Q4. As a percent of GDP, the deficit has remained between 2 and 3 percent over the past several years, indicating that the economy is growing at about the same pace as the deficit.
Housing Starts Rise as Inventory Holds Back Sales
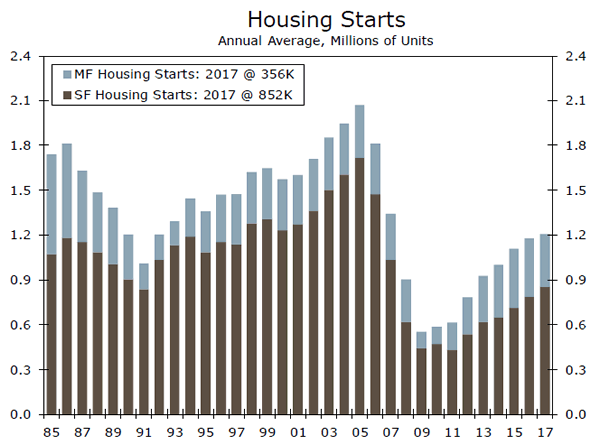
Housing starts bounced back solidly in May following April's upwardly revised 3.1 percent fall, rising 5.0 percent to a 1.35 million-unit pace. Both single-family (+3.9 percent) and multifamily (+7.5 percent) starts rose, but total permits fell 4.6 percent to a 1.30 million-unit pace. Not typically the load carrier, the Midwest drove starts this month, surging a massive 62.2 percent. Starts in all other regions fell in May, most notably dropping 15 percent in the Northeast, with smaller drops in the South and West. The huge jump in the Midwest is likely due to a later-arriving spring this year, which allowed builders to have a stronger-than-usual May. The region's economic growth has improved significantly over the past year, largely due to manufacturing growth, and we look for further ramping up in Midwestern homebuilding in coming months. Across the country, builders continue to struggle finding lots and workers to meet the high level of housing demand. Rising lumber and materials prices are holding new construction back from reaching a faster pace.
Existing home sales fell for the second straight month in May, slowing 0.4 percent to a 5.43 million-unit pace. Once again, the drop was due entirely to a slowdown in single-family homes, which fell 0.6 percent. The Northeast was the only region in May to see an accelerating sales pace in May, rising 4.6 percent. However, sales in this region are still 11.7 percent below the pace of this time last year. Inventory has risen slightly, climbing 2.8 percent to 1.85 million homes, but has fallen on a year-over-year basis for the past 36 months. Low inventory levels are clearly still holding back existing home sales—existing home sales have fallen 3 percent over the past year, while inventory of homes for sale has fallen over 6 percent.
Following an initially reported $128.2 billion current account deficit in Q4, financial markets expected further widening in Q1. The account balance came in at $124.1 billion in Q1, but due to revisions to Q4 data, this represented a widening of $8.0 billion over the quarter. Though the deficit has widened once again, we do not view this as a headwind to growth. As a percent of GDP, the deficit has remained between 2 and 3 percent over the last several years, indicating that the economy is growing at about the same pace as the deficit. Foreign purchases of Treasuries and U.S. corporate securities have been positive in each of the past five quarters. Our baseline expectation is that the current account deficit will continue widening as the trade deficit widens. Potential protectionist trade policies throw in some risk to this outlook, however.
The Leading Economic Index (LEI) rose 0.2 percent in May, following a strong April. Most of the components in the index increased, however the recent moderation suggests positive, but slowing growth. The drags on the LEI this month surrounded the labor market and construction activity. The ISM new orders component led the index in the month, increasing 0.17 percentage points, suggesting broadening economic growth. While the index has risen, it is rising at a moderating pace, suggesting future economic growth will moderate.
U.S. Outlook
New Home Sales • Monday
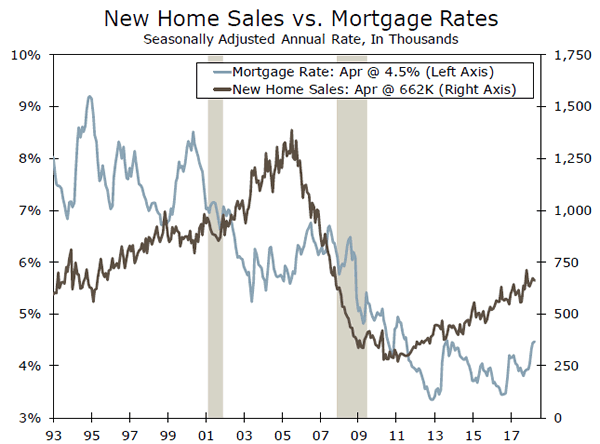
Stronger job and income growth appear to be driving demand for new homes as sales are off to a solid start this year. The previous month saw sales slip, declining 1.5 percent to a 662,000-unit pace. Home sales, which have been largely driven by activity in the West, did not see as much incremental improvement in April as they usually do, resulting in the seasonally-adjusted headline drop.
Despite the monthly drop, new home sales were up 8.4 percent yearover- year, a testament to the more robust, longer-term trend. A silver lining in the April report was that sales of homes not started were the strongest in five months, which bodes well for housing starts in coming months. The market expects a rebound in sales in the Monday release, calling for a 669K annualized pace of new home sales in May. We will be keeping a close eye on home buying activity, especially while the Fed continues to hike short-term rates.
Previous: 662K (SAAR) Wells Fargo: 657K Consensus: 669K
Durable Goods • Wednesday
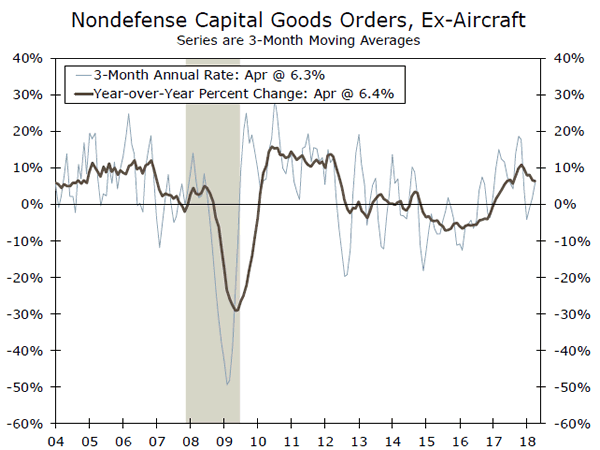
Despite last month's drop in durable goods orders, core capital goods orders are improving on trend. The 1.7 percent drop experienced last month was largely a result of a 30 percent plunge in aircraft orders, which caused transportation orders to contract 6.1 percent. Because transportation orders are notoriously volatile month to month, the year-over-year measurement is more telling, as it has risen 12.1 percent. Likewise, ex-transportation orders have gained some momentum since the start of the year, notching a 0.9 percent gain in April.
Moreover, several regional Fed manufacturing PMIs have already been released for May, and all showed growth accelerating from April. While business spending is not likely to grow at the booming rate indicated by the PMIs, we anticipate equipment spending will strengthen in the second quarter.
Previous: -1.6% (Month-over-Month) Wells Fargo: -2.1% Consensus: -0.4%
Personal Income • Friday
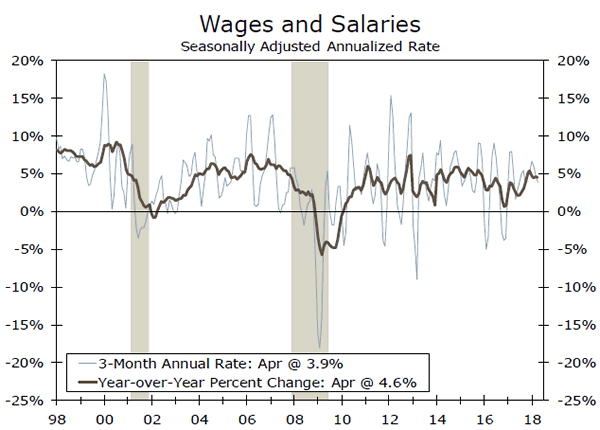
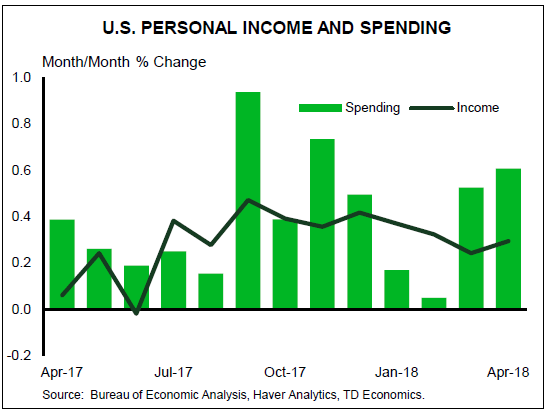
Personal income jumped 0.3 percent in April, driven by strength in wages and salaries. The trend in wage and salary growth has clearly firmed in recent months on continued strong demand in the labor market, which has helped support income gains and consumer confidence. Such confidence has supported stronger spending on future income gains in recent months, and the saving rate has declined to 2.8 percent from 3.0 percent in March. Tax cuts may have also supported the surge in recent spending, as larger paychecks continue to boost disposable income.
With inflation showing nascent signs of enduring firmness, employers may begin to demand higher wages to maintain purchasing power. Likewise, with an increasingly tight labor market, employers' hands may be forced to offer higher wages to attract and retain top talent. Multiple forces are at play which suggest higher income growth in the coming quarters.
Previous: 0.3% (Month-over-Month) Wells Fargo: 0.4% Consensus: 0.4%
Global Review
Canadian Stir-up
- In Canada, a soft print for CPI inflation and indications of deterioration in retail spending take some of the wind out of the sails for rate hikes from the Bank of Canada.
- Meanwhile, the Bank of England kept rates on hold but there is dissention in the ranks of the Monetary Policy Committee. The decision to remain on hold was split (6-3), as a growing number of MPC members indicate a preference to hike rates.
Prelude to a Hike at the Bank of England
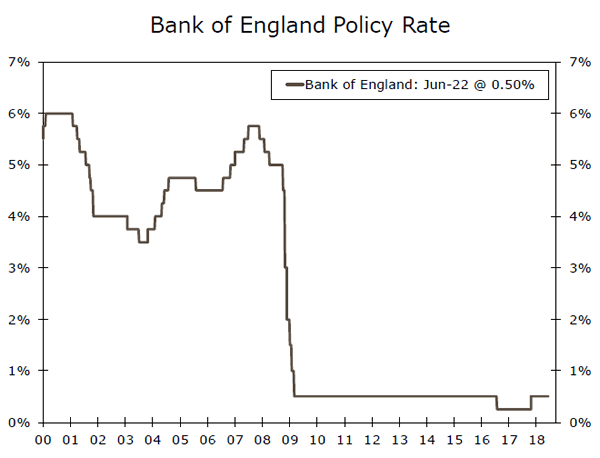
At its earlier meeting on May 10, the Bank of England (BoE) opted to maintain its policy rate at 0.50 percent after a lackluster first quarter GDP report. The vote was 7-2 at the time, with the dissenting votes citing a preference to go through with a rate hike despite the softening economic data.
The number of dissents climbed to three in this week's (6-3) decision to keep the overnight rate on hold at 0.50 percent. In our view, odds are now better than even that the Monetary Policy Committee will lift interest rates at its August 2nd meeting.
A sudden deterioration in the vital economic statistics for the U.K. economy could upset that plan, but considering the fact that the purchasing manager surveys are still firmly in expansion territory that does not seem terribly likely. The BoE, along with many other central banks, appears committed to normalizing policy.
No Urgency in Japanese CPI Data
Despite this current of normalization, the Bank of Japan (BOJ) is still swimming against the stream. At its June 14 meeting, the BoJ announced its intention to maintain its comprehensive package of asset purchases and yield curve control.
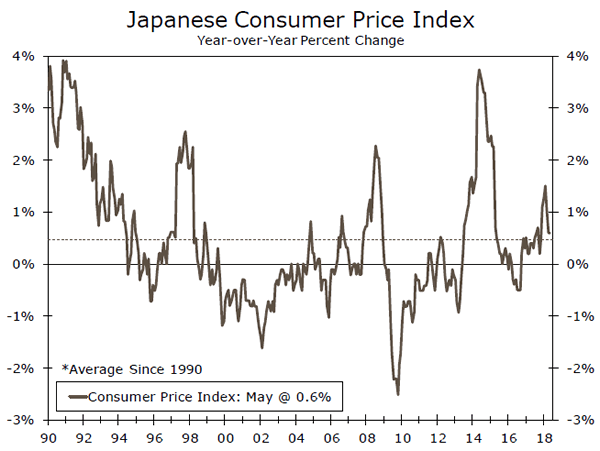
The primary objective for the Bank of Japan is to achieve 2 percent CPI inflation. At the end of this week, we learned that May CPI inflation in Japan came in at 0.6 percent. That is a right in line with the 0.6 percent reported in April and the 0.6 percent that had been expected. Core CPI inflation also came in at 0.7 percent in May.
Japanese GDP slipped in the first quarter, but we expect the economy to return to its growth path in the current quarter. The pace of that growth is still expected to be only incremental. With growth tepid and inflation benign, there is nothing compelling policymakers in Tokyo to let up on their comprehensive package of accommodative monetary policy.
Canadian CPI and Retail Sales
The May 30 statement from the Bank of Canada (BoC) adopted a moderately more hawkish stance, and potentially signals a faster pace of rate hikes ahead than previously anticipated. However, long-standing concerns about high levels of household debt and unsustainable levels of residential investment are still a concern.
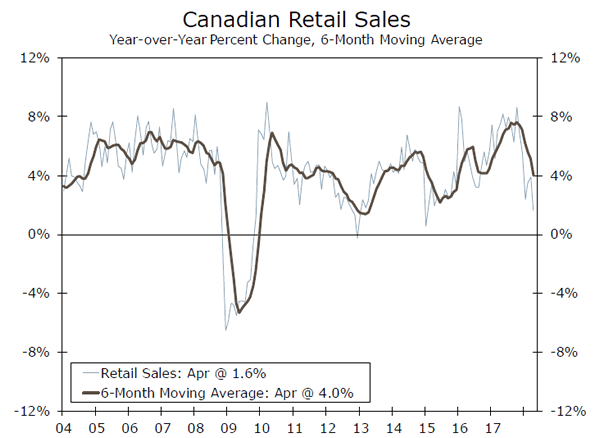
Data released this week shows that consumer spending hit a soft patch, with core April retail sales figures showing a 0.1 percent dip in the month. The broader measure of spending which includes autos dropped 1.2 percent.
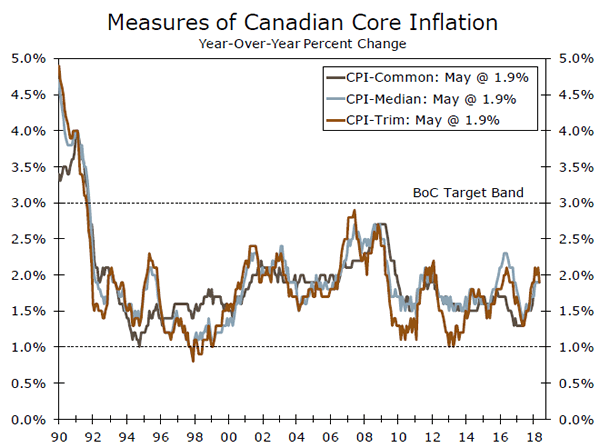
The BoC aims to keep CPI inflation at the midpoint of an acceptable range of 1 to 3 percent and it also considers multiple versions of "core" inflation for considering pricing dynamics. The latest batch of inflation numbers for the month of May came out on Friday. All of the core measures came in at 1.9 percent which give the BoC cover to raise rates at its upcoming meeting on July 11.
That said, headline inflation came in a little softer than expected; that combined with the soft retail sales figures take away some of the urgency for a subsequent hike later this year.
Global Outlook
Japanese Industrial Production • Friday
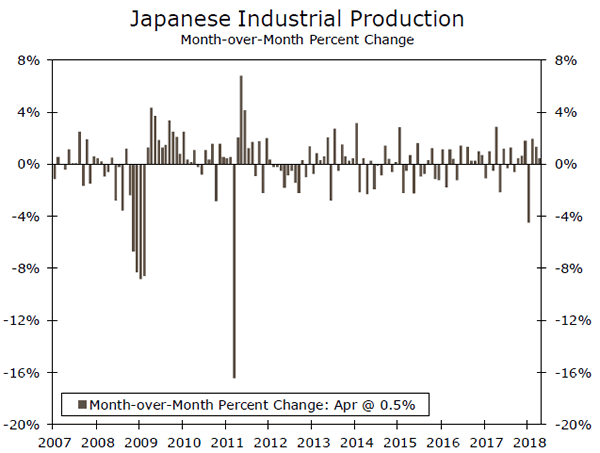
Real GDP in Japan contracted at an annualized rate of 0.6 percent in Q1-2018 due in part to the 5.3 percent nosedive in industrial production (IP) in the first quarter. However, IP has now grown for three consecutive months, which puts GDP growth on a path to return to positive territory in the current quarter. Data on Japanese IP in May are scheduled for release on Friday.
Other data releases for May that are also on the docket next week will give analysts information that they can use to tune up their GDP growth estimates for Q2. Data on retail sales will offer some insights into the current state of overall consumer spending in Japan, while data on housing starts and construction orders will paint a clearer picture of the health of the construction sector. June data on consumer price inflation in Tokyo can be used to gauge the overall rate of CPI inflation in Japan at present.
Previous: 0.5% (Month-over-Month) Consensus: -1.0%
Eurozone CPI Inflation • Friday
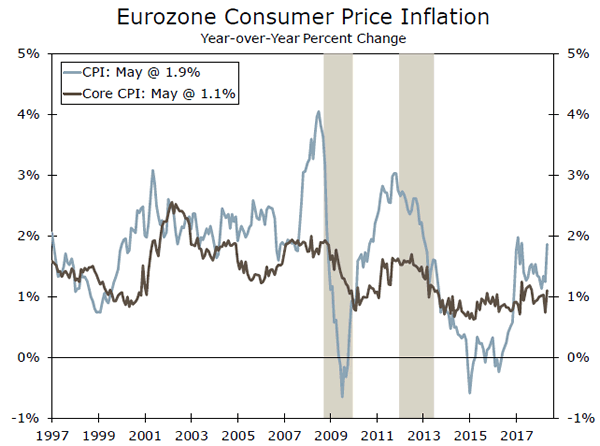
The overall rate of CPI inflation jumped from 1.2 percent in April to 1.9 percent in May. Some of the sharp increase in the year-over-year rate of CPI inflation reflects base effects (i.e., inflation was elevated in April 2017 but depressed in May 2017). But the 2.2 percent jump in energy prices in May relative to the previous month also pushed inflation higher. Preliminary data on both the overall rate of inflation and the core inflation rate in June are slated for release on Friday.
Industrial production in Germany, which rose sharply over the course of 2017, has trended lower thus far in 2018. The Ifo index of German business sentiment in June, which is on the docket on Monday, may shed some light on the current state of the German factory sector. The German labor market report for June will be released on Friday, and retail spending data for May will also print late in the week.
Previous: 1.9% (Year-over-Year) Wells Fargo: 1.9% Consensus: 2.0%
Canadian GDP • Friday
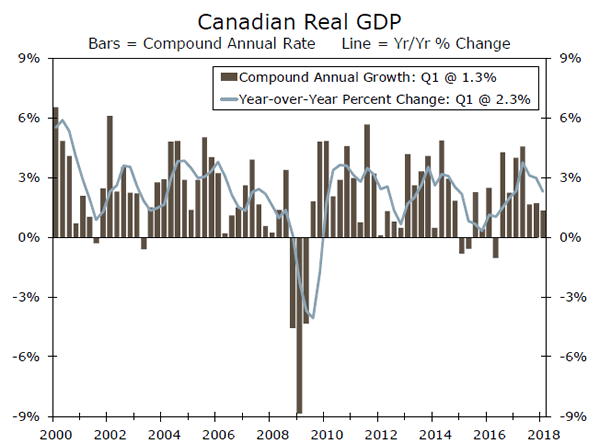
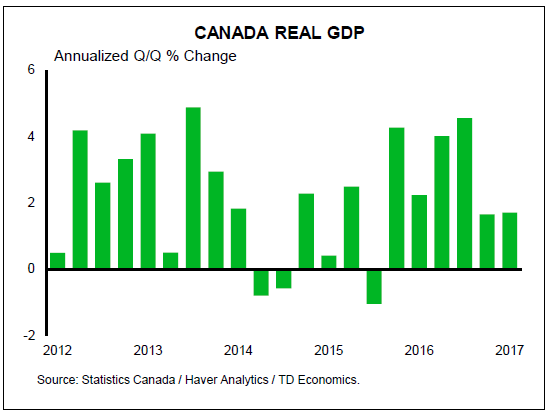
The Canadian economy grew only 1.3 percent in Q1-2018, the third consecutive quarter in which the sequential rate of real GDP growth fell short of 2 percent (annualized). Canada is the only major country which publishes real GDP data on a monthly basis, and output grew 0.4 percent (not annualized) in February followed by 0.3 percent in March. In short, the Canadian economy came into the second quarter with a fair degree of momentum, and the GDP release for April, which is on the docket on Friday, will show how the economy fared at the beginning of Q2.
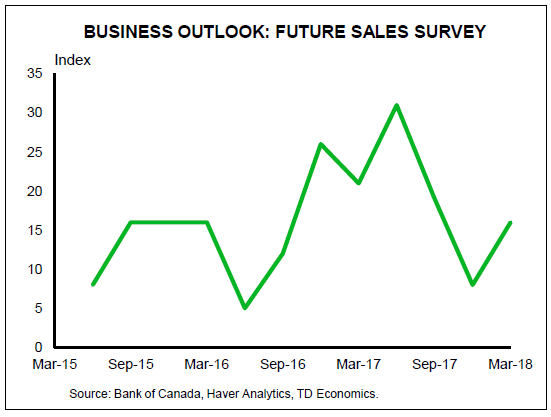
There will also be some "soft" data that will give analysts further insights into the current state of the Canadian economy. The Bank of Canada will publish survey data on the business outlook as well as its Senior Loan Officer survey, which measures the lending attitudes of Canadian banks.
Previous: 2.9% (Year-over-Year)
Point of View
Interest Rate Watch
Known-Unknowns
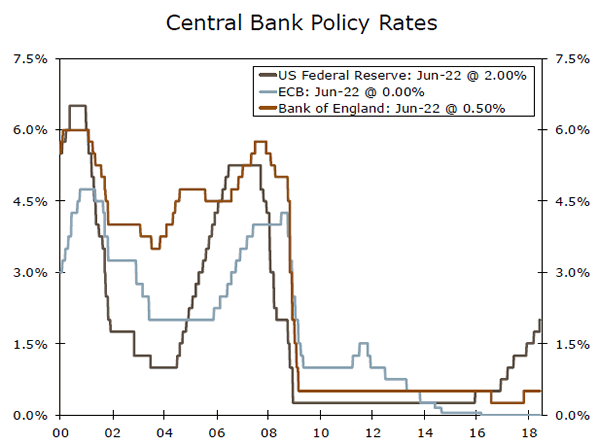
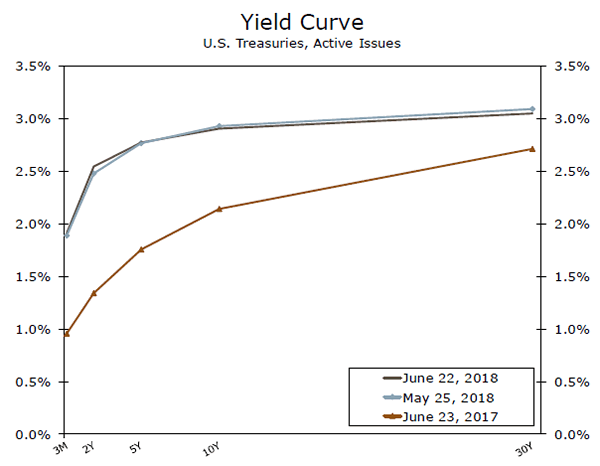
Monetary policymakers do not operate with perfect foresight. At times the most pressing factors to the outlook cannot be put into models, or they come with a high range of uncertainty. This week FOMC Chair Powell highlighted two factors that make the outlook less clear for the Fed and hence market-watchers.
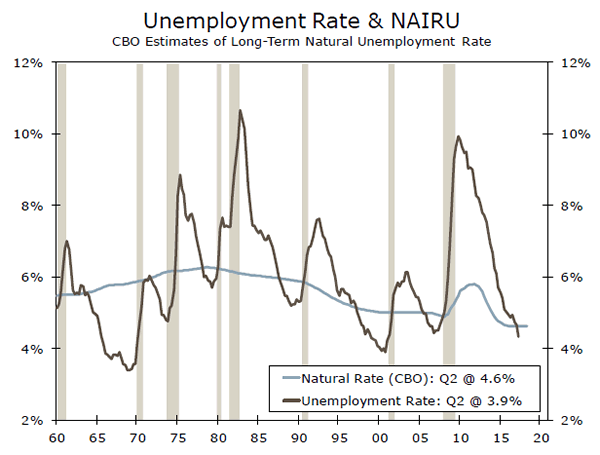
Where Is NAIRU?
The unemployment rate currently sits 0.7 percentage points below the FOMC's estimates of full employment. Yet, the natural rate of unemployment tends only to be determined after the fact, when wages begin to accelerate.
The last time the unemployment rate stayed as low as 3.8 percent for an extended period was in the late 1960s, when NAIRU is estimated to have been about 5.75 percent. At the time, however, estimates placed it around 4 percent, implying the economy was not nearly as overheated as it turned out to be.
Trade Tensions: Sailing in a Fog
Tit-for-tat measures have raised concerns over an all-out trade war in recent weeks. As tensions escalate, uncertainty about the outlook is starting to percolate into businesses plans for hiring and investment.
With no firm indication of the amount, makeup and timing of further trade barriers—if they occur at all—the extent of the effects on growth, employment and inflation are difficult to pin down. "We don't have any way to know how to put [trade] in the outlook just yet" Powell said. Therefore, the current trade environment is one more factor clouding the proper path of monetary policy over the near term.
Forgoing Forward Guidance
Alongside these two known-unknowns comes reduced forward guidance. As the economy has healed, there has been less of need to pledge a certain policy stance. Consequently not only are policymakers less certain about the forecast, but they will be offering up fewer assurances about the near- to medium- term path of policy.
Credit Market Insights
Moderating Financial Expectations
The Federal Reserve Bank of New York recently released the results of its May Survey of Consumer Expectations, which showed that household financial expectations deteriorated slightly over the month. While various sentiment measures suggest that consumers still remain broadly confident about current economic conditions, future expectations have moderated slightly.
The share of survey respondents expecting tighter credit conditions a year from now increased to more than 30 percent in May. These expectations are likely due in part to a steadily rising cost of credit as the Fed continues along its tightening path. As such, survey respondents were less optimistic about their future financial situation, with 13.7 percent of respondents expecting to be worse off financially a year from now, up from 11.8 percent in April.
Although financial expectations have moderated, household balance sheets generally remain strong, likely buoyed by rising incomes and a tight labor market. The Federal Reserve also recently released Q1 data on aggregate household financial accounts, which showed that total household net worth surpassed $100 trillion for the first time in series history. Household net worth has been steadily rising in this expansion, and should likely provide a cushion to most consumers against rising interest rates and tightening credit standards, at least for the foreseeable future.
Topic of the Week
Logjam: Tight Supply Chain Effects
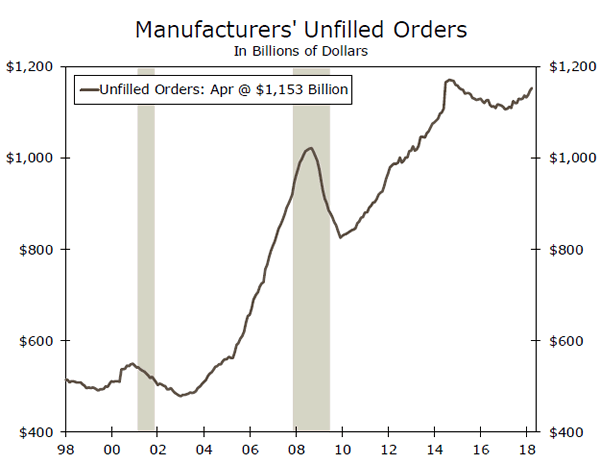
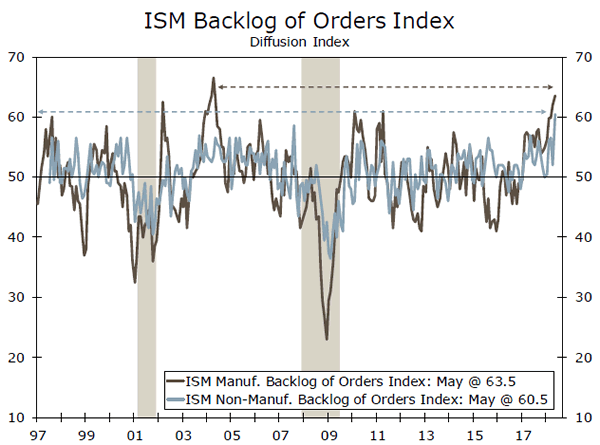
There is growing evidence that the economy is experiencing some congestion in the production pipeline. Despite only modest levels of capacity utilization, an increasing number of firms are citing longer delivery times and a steady increase in unfilled orders. Businesses have been adding to inventories at only an incremental pace, while firms are more likely to cite inventory shortages in their customer inventories than they have been at any other point in more than five years.
The dwindling slack in the manufacturing sector accentuates the vulnerability of the supply chain. At various earlier points in the current expansion, events that might have caused major disruptions, from natural disasters to port closures, have caused only mild interruptions to supply chain managers because a degree of slack in the system allowed some supply chain flexibility. This is not the case today.
The current log-jammed environment stands to be supportive of stronger investment spending or higher inflation, however, upward price pressures appear more immediate. Inventory shortages, increasing input prices as well as a steady increase in unfilled orders present scope for firms to raise prices in order to maintain or increase profit margins while meeting customer demand. The Fed will monitor inflationary pressures, and it may have to adjust its path of policy if price pressures build earlier than anticipated.
We make two primary points in our recent paper. The first is that by most measures, the economy is firmly in expansion mode, but it is also more vulnerable to supply chain disruption than it has been at earlier points in this cycle. The second is that even absent any disturbance, the log-jammed environment that exists today is likely to be inflationary, perhaps more than some market participants would expect, given the otherwise benign readings for capacity utilization. For our full analysis, please see "Logjam: Tight Supply Chain Effects on Prices & Capex."
The Weekly Bottom Line: Let the Good Times Roll!
U.S. Highlights
- The U.S. economy is barreling ahead with more momentum than we had expected. Our latest forecast upgrades real GDP growth to 3.0% in 2018, from 2.7% in March.
- 3% is difficult to sustain over the medium term. As the fiscal boost fades, higher interest rates weigh and structural constraints bind, growth in 2019 is set to slow.
- Even with slower growth, the U.S. is still set to out-perform its G7 peers. The main downside risk to the outlook is an escalating trade war. While this presents a serious risk to its trading partners that are dependent on access to the U.S. market, America has sufficient cushion to withstand the hit.
Canadian Highlights
- Canadian economic data were generally gloomy this week. April's wholesale trade numbers came in flat, while auto sales led retail trade lower.
- Prices also failed to gain momentum, with inflation unchanged at 2.2% in May.
- Trade tensions and softening data led traders to lower the odds of a July Bank of Canada rate hike to an effective coin toss – an underestimate in our opinion. The upcoming speech by Governor Poloz is one to watch as we get ready for the next monetary policy decision on July 11.
U.S. - Let the Good Times Roll!
Our new quarterly forecast is titled Full Steam Ahead, which is an accurate description of our forecast. The American economy is barreling ahead with more momentum than we had expected. Real GDP growth is tracking 3.0% in 2018, revised up from 2.7% in our March forecast. This is a notable improvement from 2.3% in 2017, thanks in large part to fiscal stimulus.
A healthy economy is set to push the unemployment rate even lower over the coming quarters. This in turn will add to inflation pressures. Stronger economic momentum and firming inflation have prompted us to edge up our rate-hike expectation by an additional 25 basis points for this year, taking the upper end of the policy range to 2.5% by year end.
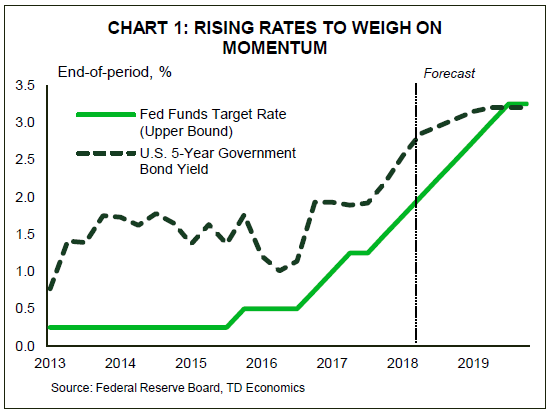
At the risk of sounding like a broken record, 3% growth is difficult to sustain beyond a near-term cyclical updraft. The boost from tax cuts and government spending increases will start to fade next year. Add to that the reduced lift from monetary policy. The Fed has raised its policy rate 150 basis points over the past 18 months, and is expected to raise it 125 more over the next 18 months (Chart 1). Higher oil prices than in our previous forecast will also nip at consumer and businesses' purchasing power. These cyclical concerns add to the underlying structural dynamics of the US economy. Even with an expected improvement in productivity growth, an aging population holds potential growth in the economy to roughly 2%.
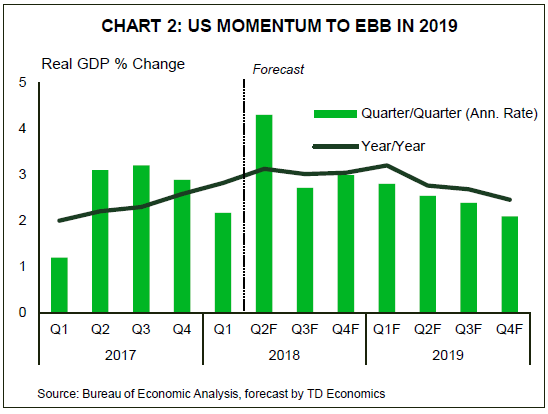
All of these factors mean that on a quarterly basis growth is set to slow over the course of 2019, to 2.1% by the end of the year (Chart 2). Still, this should be kept in perspective. Even as the U.S. slows, it is expected to outpace all other G7 economies (see Global Outlook). And, when an economy is already running at 3%, the only real direction for it is to slow.
Now is the time in the economic cycle where so –called "animal spirits" can lead to excess risk taking, and sow the seeds of the next recession. For the U.S. it is as yet unclear what these unknowns might be. Indeed the factors that cause the next recession may come from outside the U.S.'s borders. But one potential risk is self-inflicted. An escalating trade war is a clear downside risk, particularly for the U.S.'s key trading partners (see impacts of auto tariffs on Canada), which would have knock on impacts at home. Even so, with the economy doing so well, it has sufficient economic cushion to absorb some negative shocks.
In an otherwise quiet week for economic data, we did get an update on the trigger of the last recession – the housing market. There a few signs of froth there. Housing starts continued their gradual upward trend in May. Residential construction has been on a stronger footing this year after weakness in multi-unit structures drove a lull in 2017. The existing home market, on the other hand, was a bit disappointing in May. Sales have trended down recently, as the market struggles with a lack of listings. Forward looking indicators suggests activity should improve in the months ahead. In time, construction of new homes should help, but improvement is expected to be gradual as affordability constrains demand.
Canada - Back To You, Governor
Data released this week provided additional signals of how the Canadian economy is shaping up in the second quarter. Wholesale trade figures came in effectively flat, as a pull-back in autos weighed on overall activity. Notably, this came on the back of an impressive (and now upwardly revised) earlier performance, making April an all-time high.
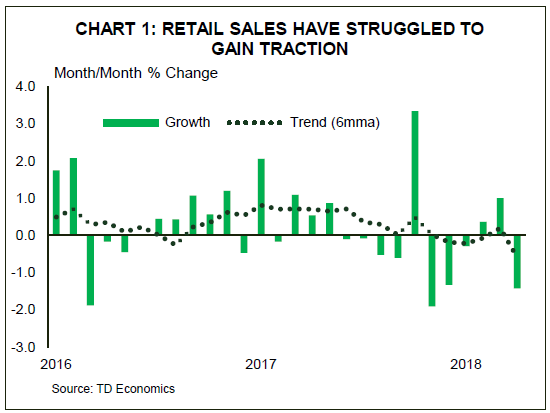
Weak data became a theme for the week as retail sales recorded a sizeable decline, and inflation came in on the soft side. On the retail front, the pull-back was driven almost entirely by the decline in auto sales. A decline was largely expected, given outsized gains in the months prior, but the correction was more severe than anticipated. Although Statistics Canada suggests that at least some of the decline was related to poor weather, the weakness comes at a time when retail sales were already struggling to gain traction (Chart 1). April's decline marks the fourth in six months. So while the data disappointed, it is at least consistent with recent trends.
The inflation report also disappointed, with year on year price growth unchanged at 2.2% in May, well short of market expectations. Here too some one-off factors impacted the data, with a 7.1% y/y drop in telephone service costs standing out. However, since the Bank of Canada's core measures also pulled back, the softness in inflation appears more widespread.
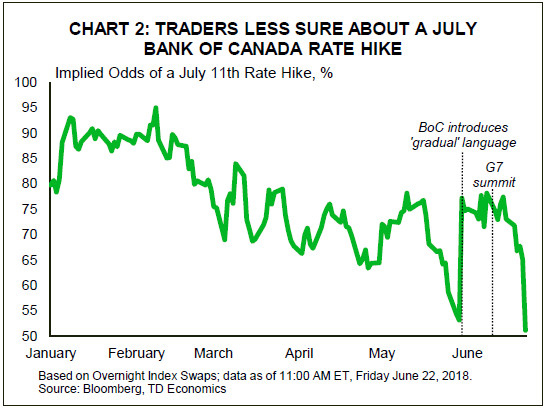
Chart 2: Traders less sure about a july Bank of Canada rate hike
Looking ahead, these signals will become a signpost with the release of April's GDP report on Friday. The figures will likely show the economy started the second quarter on the back foot. However, the main event will likely be the speech by Bank of Canada Governor Poloz on Wednesday. The title "Let Me Be Clear: From Transparency to Trust and Understanding" telegraphs a high-level discussion on monetary policy, but with the next decision coming two weeks later every word will surely be scrutinized. Recent communications have been on the hawkish side, but in the wake of trade tensions, the market-implied odds of July action have been falling, with today's soft data relegating it to an effective coin flip (Chart 2). This shift in sentiment seems a bit overdone. To be sure, as our recent 'what if' analysis of potential auto tariffs demonstrated, the impacts of further trade actions would be significant. Fortunately, for now, these are just risks, and they are not new. In fact, these very risks sit at the core of what the Bank has termed a 'gradual' approach to monetary policy, alongside concerns over leverage and housing markets.
So it remains the case, as outlined in our latest Quarterly Economic Forecast, that for the Bank of Canada, risks do not imply inaction. So long as the data remains broadly constructive, the Bank is likely to feel comfortable continuing to remove stimulus. On that front, the Business Outlook Survey, due Friday, as well as the monthly household credit data, likely to come the following weekend, will be useful to watch. The term 'gradual' implies that this process should be much slower than past experience would suggest. Unless these risks are sufficiently reduced or Canada's economy accelerates markedly, we expect the Bank to move its policy rate by only 50bps (i.e. two hikes) per year. As it stands, July remains most opportune time to hike, but with inflation remaining tame it is hard to expect much urgency. Suffice it to say that there will be much in the coming weeks to test this view – stay tuned.
U.S.: Upcoming Key Economic Releases
Personal Income & Spending - May
- Release Date: June 29, 2018
- Previous Result: Income 0.4% m/m, Spending 0.2% m/m
- TD Forecast: Income 0.3% m/m, Spending 0.4% m/m
- Consensus: Income 0.4% m/m, Spending 0.4% m/m
We expect an upbeat tone from May PCE data with few surprises. PCE inflation should accelerate to 2.2%, with energy and food prices offsetting each other on a m/m basis and core PCE printing 0.2% m/m. That will lead the Fed's inflation gauge higher to 1.9%, just below target. Personal spending should advance 0.4%, supporting robust Q2 expenditures above a 3% pace.
Canada: Upcoming Key Economic Releases
Real GDP – April
- Release Date: June 29, 2018
- Previous Result: 0.3% m/m
- TD Forecast: -0.1%
- Consensus: N/A
TD looks for industry-level GDP to edge 0.1% lower in April. Manufacturing output will be constrained by refinery shutdowns, which drove an outsized pullback in factory sales for the month, but stronger motor vehicle output should provide a partial offset. Construction should also provide less of a tailwind than recent months on the slowdown in the residential component. For services, we expect continued weakness in real estate due to the soggy housing market while food services and retail add another source of downside due to inclement weather. This may seem like a shock of cold water ahead of the July BoC, but we would note that the 0.3% print in March provides some insurance for Q2 should we get a weak print in April. Thus, we think the Bank will be comfortable to look through one month of poor data, especially considering weather and other one-offs, and hike rates in July as trade risks will continue to generate noise in the months ahead.
Business Outlook Survey - Q2
- Release Date: June 29, 2018
We look for the Business Outlook Survey to balance an upbeat assessment of current business conditions with more temperate forward looking commentary as trade risks cast a dark shadow over an otherwise healthy base case, underpinned by strong US demand. While most of the recent apprehension towards the BoC reflects a perceived increase in trade tensions out of the G7, this is the same type of environment that the Bank has operated in since President Trump announced his intent to renegotiate NAFTA in May 2017. Thus, the BoC will not overreact to noise, until that noise starts to impact investment decisions. In this light the quantitative indicators in the BOS should provide more insight than the anecdotes and we do not expect to see any significant deterioration since April, especially considering the consultation period concluded by early June at the latest.
OPEC Agrees to Boost Daily Production to Ensure Oil Market Stability
At the 174th Meeting of the OPEC Conference, OPEC members agreed that global crude oil market conditions further improved since its meeting last November, citing a strong global economy that is helping to spur relatively robust demand for oil. They agree that there is evidence that market is continuing to rebalance, and that the return of more stability and optimism to the industry is a welcome development.
OPEC production adjustments in place since November 2016 originally intended to remove about 1.2 million barrels per day (mb/d) from the global oil market have worked very well. However, as of May 2018, OPEC member countries have exceeded the required level of supply cuts by an additional 624,000 b/d. This is largely a reflection of falling production in OPEC member nations such as Venezuela, Angola, Algeria, Qatar, the UAE, and temporary disruptions in Libya.
In OPEC's view this degree of overcompliance risks the long-term stability of the oil market. As a result, media reports indicate that they agreed to increase production as of July 1st by about 1 mb/d. However, due to the inability of some OPEC members to ramp up production on such short notice, daily production is expected to effectively rise by about 600-700k barrels.
Accordingly, last November's Declaration of Cooperation appears to remain in full effect, suggesting that non-OPEC producers such as Russia will continue to maintain production at current levels at least until the next meeting this upcoming December.
Key Implications
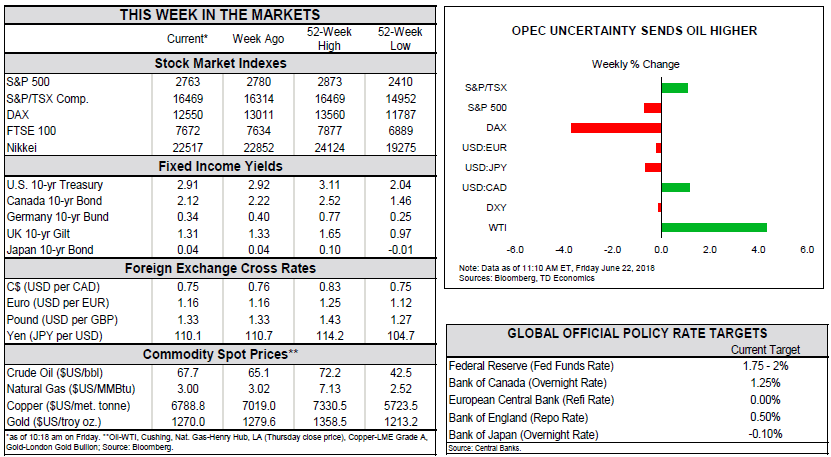
Today's OPEC announcement of a slight increase in production of about 600,000 b/d was largely in line with market expectations. Nevertheless, both Brent and WTI rallied on the news, with WTI reaching US$68.65, or roughly +4.8% on the day as at the time of writing.
The oil market is largely seen as having moved more into balance as a the end of the first quarter, and is expected to remain in balance through the end of the year. Inventories have fallen, largely as a result of stronger than expected foreign demand to start the year. With the global economy expected to expand at a robust 3.8% pace this year, rising demand for energy will have to be matched by supply in order to keep prices just high enough to support economic activity in oil exporters, but not high enough to risk demand destruction. Overall, we anticipate that WTI is likely to remain in the US $65-70 per barrel range at least through the end of this year.
U.S. shale remains a key downside risk to oil prices. In April, oil production stateside reached an all-time high of about 10.7 mb/d, and is expected to reach 11 mb/d by year-end, surpassing Russia to become top global producer. However, transportation bottlenecks and a dearth of skilled workers could delay plans to increase production from current levels, and is likely to keep a wide spread between Brent and WTI for some time to come.