Sample Category Title
TrendTrader Plus
Market Entry Tools Right On Time
The most effective and user-friendly trading approach and related set of tools available anywhere for identifying a strongly trending Forex market, and timing entry points in the direction of trend with high precision and low risk.

- Do you wish to cut down on the amount of time and effort it takes to finding tradable opportunities?
- Are you having trouble figuring out when Forex markets are moving with sufficient clarity?
- Do you wish for a more efficient way of scanning for low-risk entry opportunities?
- Are you looking for more objective exit strategies?
TrendTrader Plus is a robust trading methodology designed to help you identify and exploit strongly trending Forex markets. (Having said that, the methodology is easily adaptable to virtually any highly liquid markets including futures, indexes, stocks, etc). Our set of tools and techniques provides a real-time, automated market screener facility which quickly and efficiently directs your attention only to those pairs (from amongst a screener portfolio of 27) which may be trending strongly. That feature allows you to bypass markets that may not be trending, saving you much potentially wasted time and effort.
TrendTrader Plus also comprises a clear, rules-driven methodology for indentifying corrective dips against the uptrend or corrective rallies against the downtrend, and for identifying the specific junctures where it is expected that the market returns to trend with a so-called Momentum Push. Our trading toolkit generates signals that specifically tell you when to consider entering the trade when the top-down reading is in agreement, from Daily all the way down to 5m. The twin rationales for doing so are to time entry points well with limited risk, and to exploit markets that can be expected to generate runs of sufficient size so as to enable high Reward/Risk multiples, a critical determinant of long-term trading system Net Profitability.
It all begins with a proprietary, logic-based indicator (called "TTHisto", which is short for Trend Trader Histogram) that was developed over a two year period to ensure its reliability and effectiveness. TTHisto is totally unique and you cannot find it anywhere else, as it was developed exclusively for Forexmentor. It continuously applies five different logical tests for trend, resulting in only one of three possible readings: Up, Down or Neutral. The indicator combines in certain ways between the Daily and 4hr charts to provide a so-called "anchor" trend reading: Either UP for a long-only bias, DOWN for a short-only bias, or NEUTRAL which means no actionable trading bias. Our methodology specifies that we only trade in the direction of an Up or Down anchor trend reading, never against, nor on a Neutral reading.
From there, we drill down to three specific intraday timeframes (60m, 15m and 5m) looking for an instance of a "PRE" screen momentum reading, which may indicate corrective action on the timeframe on which a counter-trend TTHisto reading is found (i.e. in opposition to an Up or Down anchor reading). We then prepare for trade entry on either the first 5m or 15m candle close which results in a so-called "POST" screen momentum reading after the retracement is done, which is when all five of the "core" timeframes we use to structure a trade (Daily, 4hr, 60m, 15m, 5m) align in the same direction. In our experience, having the same TTHisto reading appearing concurrently on multiple timeframes top-down is the strongest indication of a trending market that is possible to attain by any means whatever, whether indicator-based or otherwise.
The trade entry overview provided in the preceding paragraph pertains to one of two methods prescribed in our six-part Foundation Course, which we refer to as a "Type 1" trade entry. We also specify an alternate methodology for entering the trade specifically by way of a Limit Entry order as price tests an identifiable Support or Resistance level in conjunction with a PRE screen result. We refer to this as a "Type 2" entry, and it is ideal for those who prefer to try to get into the trade as close to a corrective top or bottom as is possible.
The Ultimate Divergence Trading Course
A unique combination of price action, divergence analysis, and pattern recognition what will change the way you view the Forex market.

For the first time ever Chris Mathis is making his complete Divergence trading methodology available to retail Forex traders.
Now you can learn the powerful trading methods that propelled Chris from the retail trading world to managing funds for high net worth clients!
His unique combination of price action, divergence analysis, and pattern recognition will change the way you view the Forex market and give you the confidence you need to become consistently profitable.
Fully scalable - Divergence can be used by any type of trader, on any time frame, in any market session. It doesn't matter if you trade 5 minute charts during London, 15 minute charts during New York, or even daily charts for medium to longer term trading, this method will work for you.
A dynamic method you can trade forever– we all know the market changes over time and volatility increases and decreases rendering some trading methods obsolete. You will never have to worry about that when you learn to trade price patterns and divergence because they naturally adapt to the volatility of the market. In other words you can be confident this is the only method you will ever need.
A true understanding of the method – We utilize the tools that have been around the market for a long time and are freely available for everyone to use. No proprietary indicators with protected source code here. You can fully understand why you are making trading decisions with the confidence that is needed to properly manage the emotional aspects of the trading business.
A true methodology not just another system - This is not your everyday rigid trading system or just another simple strategy, but a dynamic and robust trading methodology that can be used to trade very objectively, or more discretionary depending on your own trading needs or preference.
But that is not all, you will also get a complete trading education from A-Z covering all the essential components of successful trading.
HERE ARE SOME SKILLS YOU WILL LEARN...
- Divergence Explained
- What Is Divergence
- Why Trade Divergence
- How Divergence Will Help Improve Your Trading
- Does Divergence Work on All Time Frames
- What Trading Style is the Best Fit For Divergence Trading
- Divergence Trading is a Dynamic Approach for a Dynamic Market
- Divergence Trading Applied
- Divergence Trading in a Nutshell
- Regular Divergence
- Hidden Divergence
- Slope Divergence
- Setting Up Your Charts for Divergence Trading
- Preparing Your Trading Day for Divergence Trading
- Identifying Levels of Support and Resistance to Create Trading Zones
- How to Spot a Divergence Setup
- Advanced Divergence Techniques
- How to Use Trend Lines for More Aggressive Divergence Trade Entries
- How to Use Candles for More Aggressive Divergence Trade Entries
- Divergence Trade Targets
- Simple Objective Divergence Trading Strategy
- The Stacked Limit Order Entry
- The Extension Entry Method
- Real World Divergence Trade Examples
AFTER COMPLETING THE COURSE, YOU WILL KNOW HOW TO..
- Apply my unique divergence and pattern trading methodology to extract consistent profits from the market.
- Spot and take advantage of objective low risk high reward divergence setups
- Use smaller time frame divergence and extension setups to enter in larger time frame swing trades
- Dynamically set your stop losses to account for the dynamic and volatile nature of the Forex
- Set your profit targets for maximum profitability
- Properly manage your divergence trades and positions
- Avoid the common pitfalls that the majority of traders fail to see
- Understand the basic macro and micro fundamental data that we see from day to day and how it effects our trading
- Apply inter-market analysis to understand the scope of the market, and how commodities and equities can effect specific currencies.
The Ultimate Divergence Course is much more than just a basic strategy course, you have at your disposal a highly comprehensive and completeForex training trading course that offer you a complete array of resources to make you into a professional trader.
Traders Turned More Bearish on Precious Metals as US Dollar Jumped
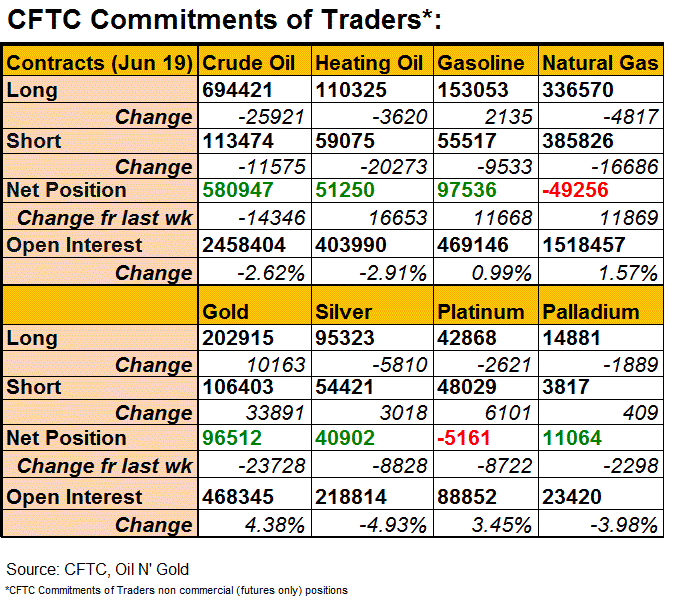
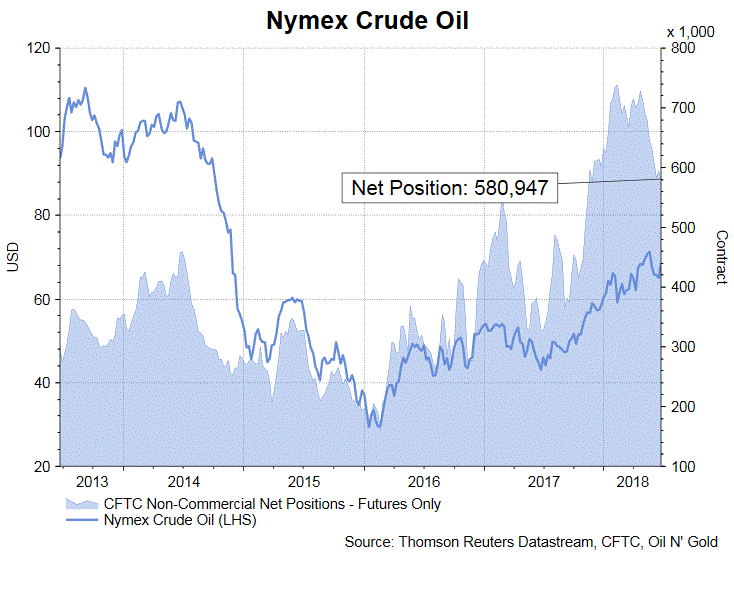
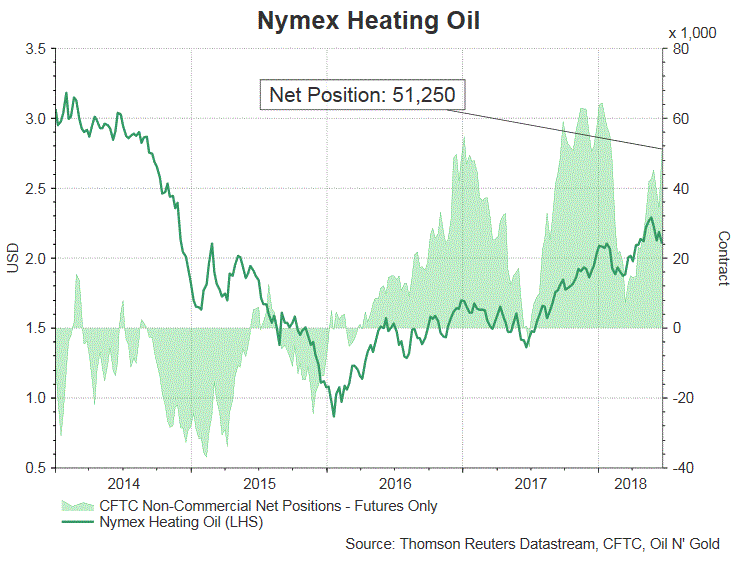
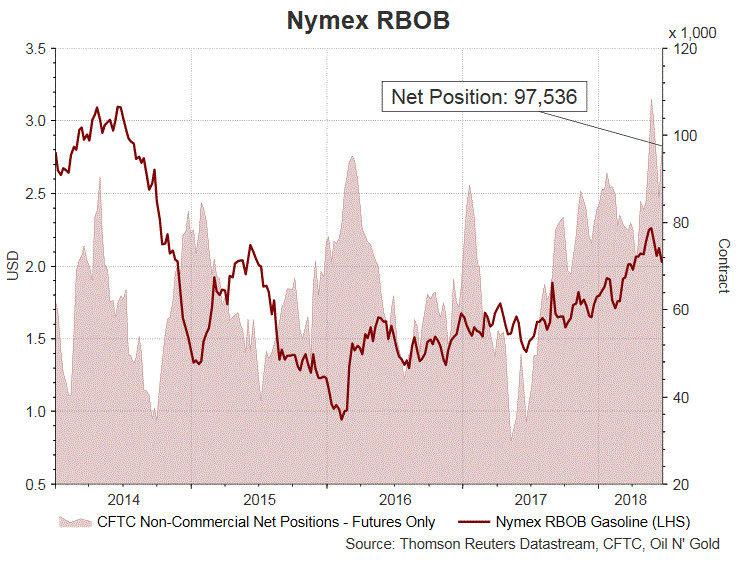
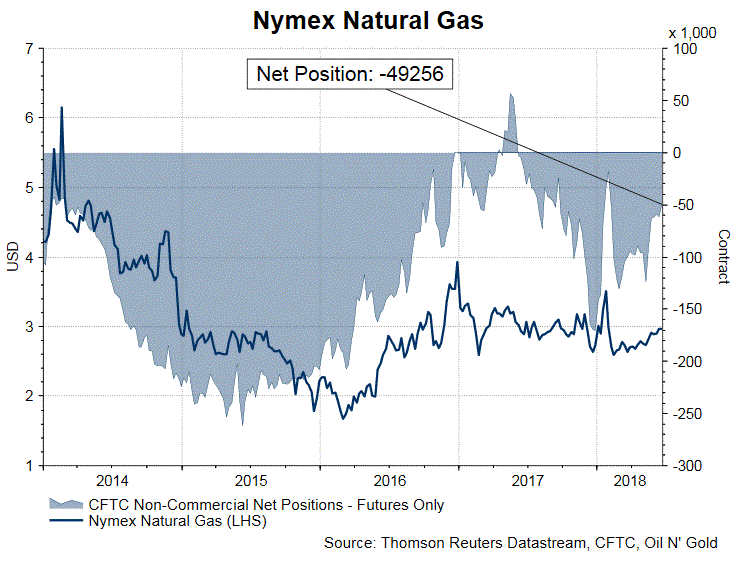
According to the CFTC Commitments of Traders report for the week ended Jun 19, net LENGTH for crude oil futures declined -14 346 contracts to 580 947. Net LENGTH for heating oil futures rose +16 653 contracts to 51 250 while that for gasoline soared +11 668 contracts to 97 536. Net SHORT for natural gas decreased +11 869 contracts to 46 256 for the week. During the week, prices of both crude oil benchmarks dropped, with the WTI and Brent contracts losing -1.94% and -1.05% respectively. For refined oil products, the Nymex heating oil and RBOB gasoline contracts fell -1.85% and -2.49% respectively. The Nymex natural gas contract was down -1.33% for the week.
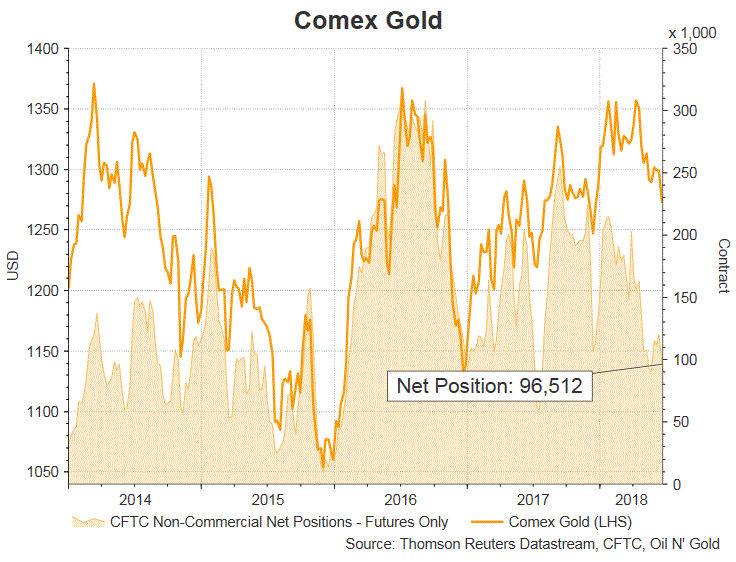
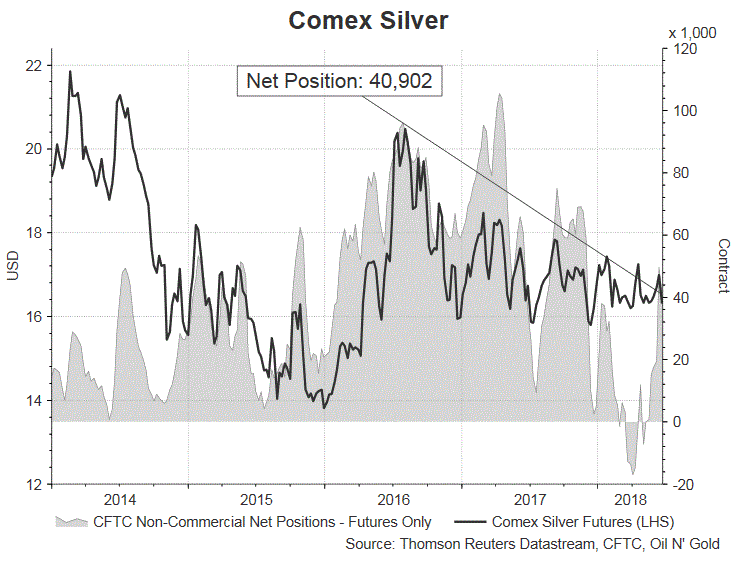
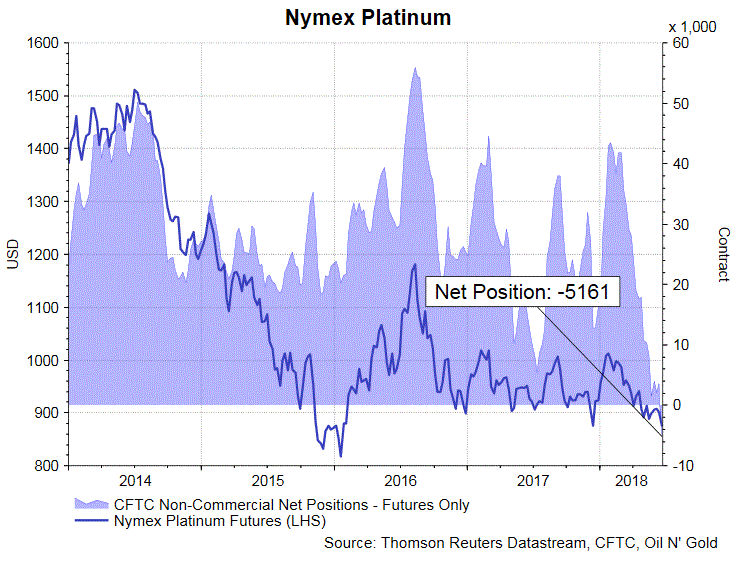
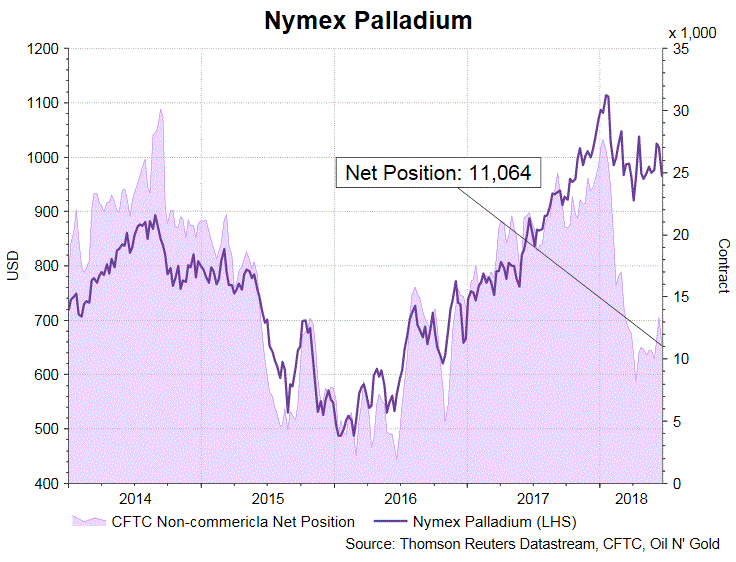
For the precious metal complex, Net LENGTH for the gold futures declined -23 728 contracts to 96 512 while that for silver fell -8 828 contracts to 40 902 for the week. The benchmark Comex gold and silver contract declined -1.51% and -3.24% respectively.For PGMs, platinum drifted to NET SHORT of 5 161 contracts while that for palladium dropped -2 298 contracts to 11 064. The Nymex platinum and palladium contract plummeted -4.07% and -5.58% respectively.
Forex Forecast and Cryptocurrencies Forecast for June 25-29, 2018
First, a review of last week’s forecast:
EUR/USD. Most experts (65%) expected the pair to make an attempt to break through the 1.1500 support, which actually happened. However, the attempt failed, the bears' strengths weakened and, against the background of a temporary lull in the trade war between the US and China, the dollar lost about 160 points to the euro, pushing the pair to the PivotPoint zone of the last six months and finishing the five-day period at 1.1657;
60% of analysts spoke in favor of the fact that the GBP/USD could break through the lower boundary of the four-week channel 1.3200-1.3470 and fall to the horizon 1.3050. This forecast was correct: on Tuesday, June 19, the pair was below the support of 1.3200, and on Thursday, June 21, it reached the level of 1.3100. However, then the Bank of England presented a small unexpected surprise. Instead of the projected 2 votes against 7, the interest rate increase received 3 votes. Of course, this did not bring any basic changes, but the bulls understood such a result as a hint of a possible rate hike in August and began to push the pound up. As a result, by the end of the week session, the pair was able to rise to 1.3260;
USD/JPY. The results of the previous week showed once again that signals of even a small part of oscillators should be taken into account. So, this time 20% of the oscillators signaled the pair was overbought. They were supported by a third of analysts and graphical analysis on H4 and D1, indicating the main support in the zone 109.40. Taking a standard backlash into account, this forecast turned out to be absolutely accurate: the pair reached the local bottom at 109.54 on Tuesday, after which it rebounded up to a height of 110.75, and then returned to the main medium-term support/resistance line in the 110.00 zone;
Cryptocurrencies. Back in early June, the total capitalization of this market was $330 billion, now it is $283 billion, that is, in just a few weeks the market was "blown away" by about 15% (more than 50% since the beginning of the year).
If you look at the BTCUSD chart, you can observe the same picture for the seventh week: strained bulls' attempts to raise the pair up, and then a weekly sharp collapse, which negates all their efforts. As a result, having fallen to the level of $5,925, the bitcoin has reached the minimum of February 6, 2018.
It really does not make sense to talk about the reasons for such falls now - whether this is a negative decision of yet another regulator, or hacking of yet another exchange. All these are just reasons to "sink" the rate of the main crypto currency by another few hundred dollars. Altcoins included in the TOP-10 in terms of capitalization - etherium, ripple, litecoin and others, - obediently follow the bitcoin down, adversely affecting the mood of the market.
As for the forecast for the coming week, summarizing the opinions of a number of analysts, as well as forecasts made on the basis of a variety of methods of technical and graphical analysis, we can say the following:
As for the economic data, which can continue pushing the EUR/USD upwards, we can note only a slightly noticeable growth of the Eurozone composite PMI index. Apparently, this is the reason why 55% of experts give only a very cautious forecast, indicating the zone 1.1725-1.1750 as a target. The vast majority of indicators on H4 are also painted green, but it is already 15% of the oscillators that indicate that the pair is overbought.
The remaining 45% of analysts are sure that the growth of the euro is a temporary phenomenon, and the pair will once again test the level of 1.1500, and in case of its breakdown it will drop 100 points lower.
But the graphical analysis on D1 offers a compromise option: first the pair's fall into the zone 1.1450-1.1500, and then its growth to the height of 1.1840;
the main trend for the GBP/USD so far is formed by the chief economist of the Bank of England Andy Haldane, who gave his vote on Thursday for raising the interest rate. In addition, the regulator has given a positive assessment to the British economy as a whole and indicated a readiness to reduce the balance after the rate rises to 1.5% (against 0.5% of today). Such "hawkish" statements led to the fact that 65% of experts expect the continuation of the uptrend and the pair's transition to the zone 1.3350-1.3450.
The remaining 35% of analysts seem to belong to the conspiracy theorists and believe that all statements of the regulator are only attempts to support the rate of the pound, which has lost more than 1,000 points since April. Proceeding from this, these experts believe that the fall of the pair will continue and it will reach the level of 1.3100 in the near future. The next support is 100 points lower.
As for the pair USD/JPY, the opinions of analysts were divided equally - half are for the growth of the pair, half are for its fall, and both indicate a decrease in volatility. The support levels are 109.85 and 109.50, the resistance is 110.25 and 110.60. The graphical analysis on H4 agrees with the experts, indicating a gradual consolidation in the 110.10 zone.
It should be noted that about 15% of the oscillators indicate the pair is oversold, suggesting the correction of the pair up in the near future.
Cryptocurrencies. It seems that the critical time is approaching, when market makers will have to decide whether the bitcoin should continue falling, or the trend should turn upwards.
If the BTC/USD confidently passes the support in the $5,900-6,100 zone, it is highly likely that after some time it will be seen near the horizon $4,300, where it stayed for a long time in last August-September.
If this support proves invincible, the bulls will do their best to bring the bitcoin back to the May highs and maybe even reach the coveted mark of 10,000.
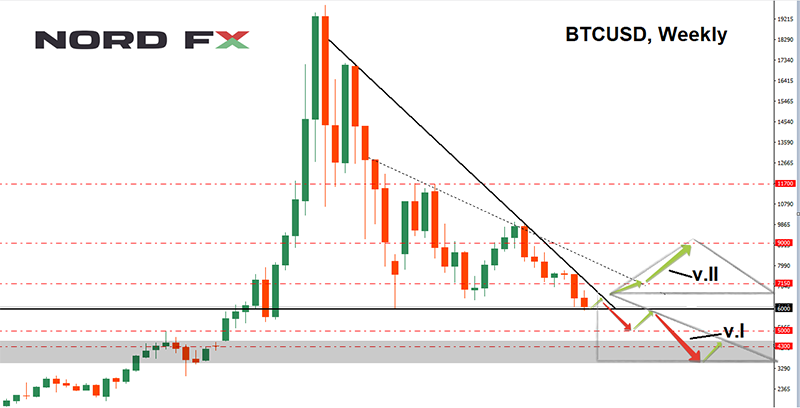
The struggle in the main virtual currencies market is expected to be serious in the near future, and in conditions of such uncertainty, it is possible that crypto traders should not wait for any obvious powerful trend to appear, but it makes sense to focus on intraday trading .And this concerns not only the bitcoin, but also all the basic altcoins.
EUR/USD Weekly Outlook
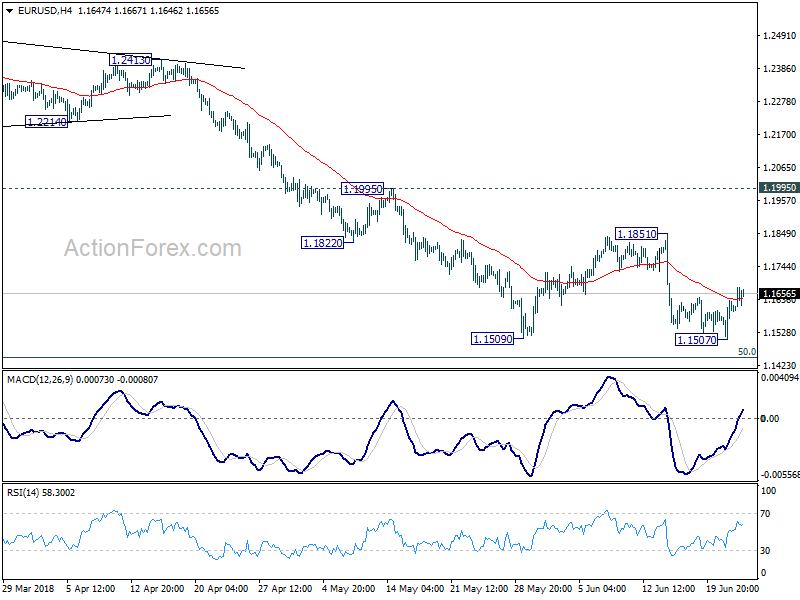
EUR/USD breached 1.1509 to 1.1507 last week but quickly recovered. Initial bias stays neutral this week as consolidation from 1.1509 is extending. Upside of recovery should be limited by 1.1851 resistance to bring fall resumption. On the downside, break of 1.1507/9 will resume the whole fall from 1.2555 through 50% retracement of 1.0339 to 1.2555 at 1.1447 to 61.8% retracement at 1.1186.
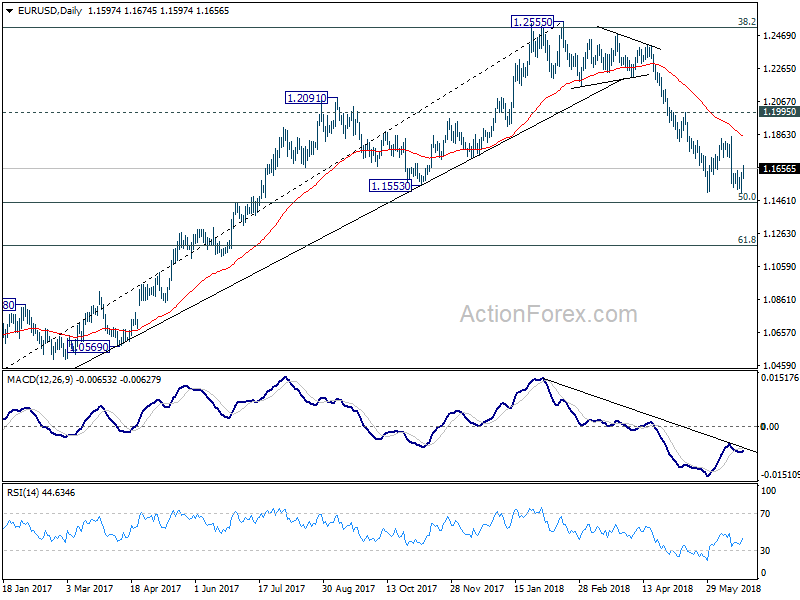
In the bigger picture, current development suggests that EUR/USD was rejected by 38.2% retracement of 1.6039 (2008 high) to 1.0339 (2017 low) at 1.2516. And, a medium term top was formed at 1.2555 already. Decline from there should extend further to 61.8% retracement of 1.0339 to 1.2555 at 1.1186 and below. For now, even in case of rebound, we won't consider the fall from 1.2555 as finished as long as 1.1995 resistance holds.
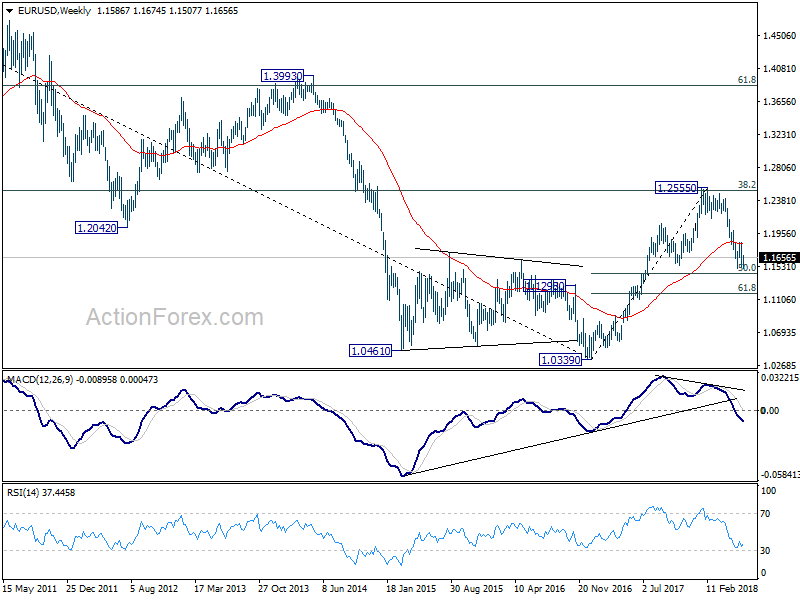
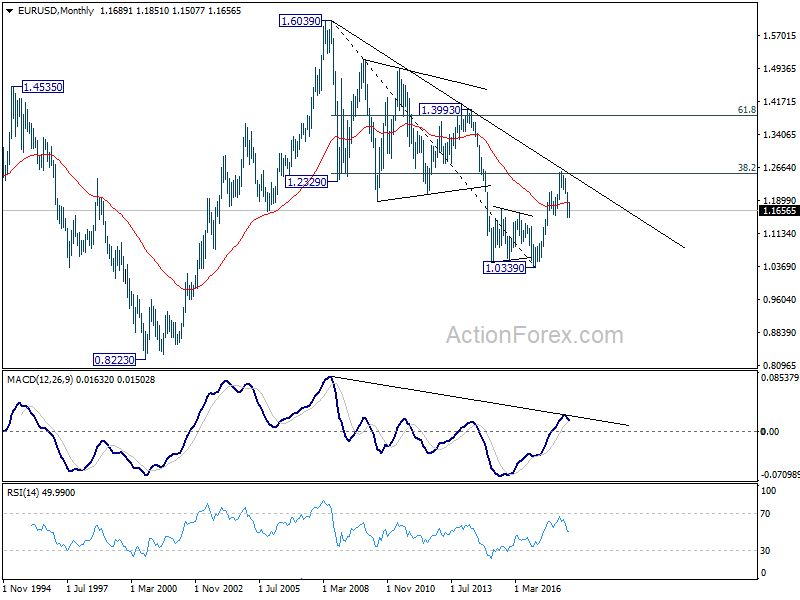
In the long term picture, the rejection from 38.2% retracement of 1.6039 to 1.0339 at 1.2516 argues that long term down trend from 1.6039 (2008 high) might not be over yet. EUR/USD is also held below decade long trend line resistance. Focus will now turn to 1.1553 support. Sustained break there would raise the chance of retesting 1.0339 low. It's early to tell, but the chance of long term bullish reversal is fading.
USD/JPY Weekly Outlook
Current development suggests that USD/JPY's rebound from 108.10 has completed at 110.89 already. And, consolidation pattern from 111.39 is going to extend with another falling leg. On the downside, break of 109.54 will turn bias to the downside for 108.10 and possibly below. But, we'd expect strong support from 61.8% retracement of 104.62 to 111.39 at 107.20 to contain downside and bring rebound. On the upside, above 110.89 will extend the rise from 108.10 towards 111.39 instead.
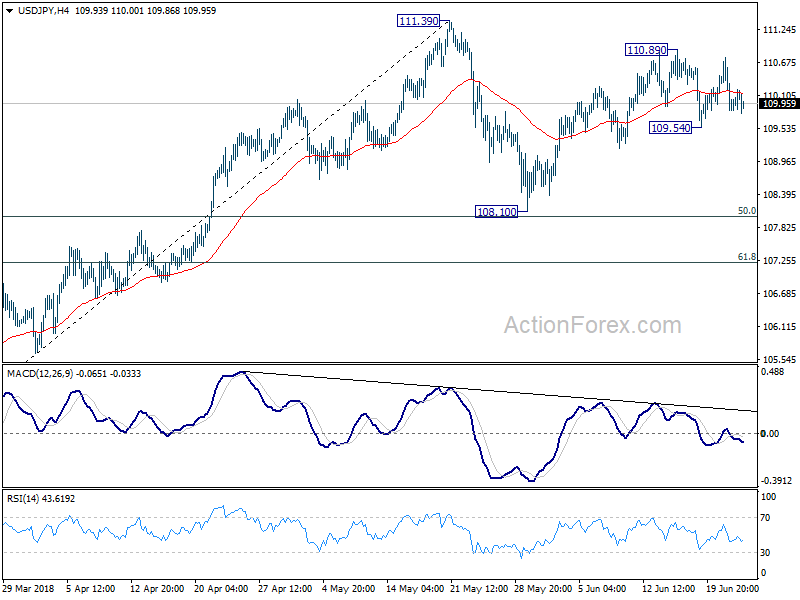
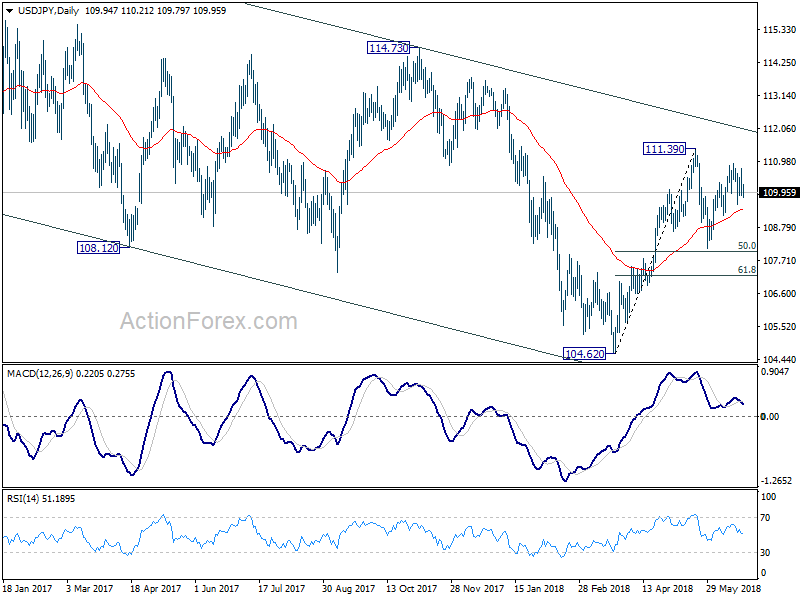
In the bigger picture, at this point, we're slightly favoring the case that corrective decline from 118.65 (2016 high) has completed with three waves down to 104.62. Above 111.39 will affirm this view and target 114.73 for confirmation. However, it should be noted that USD/JPY is bounded in medium term falling channel from 118.65 (2016 high). Sustained break of 61.8% retracement of 104.62 to 111.39 at 107.20 will likely resume the fall from 118.65 through 104.62 low.
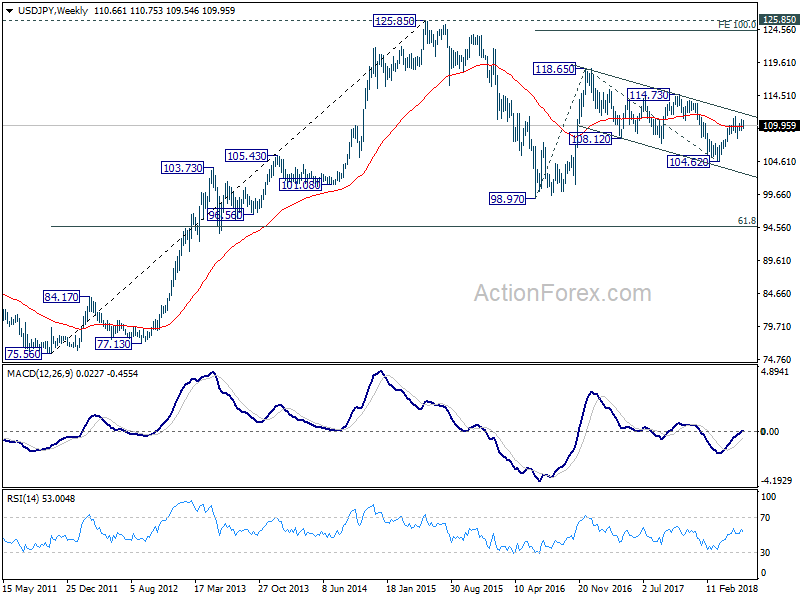
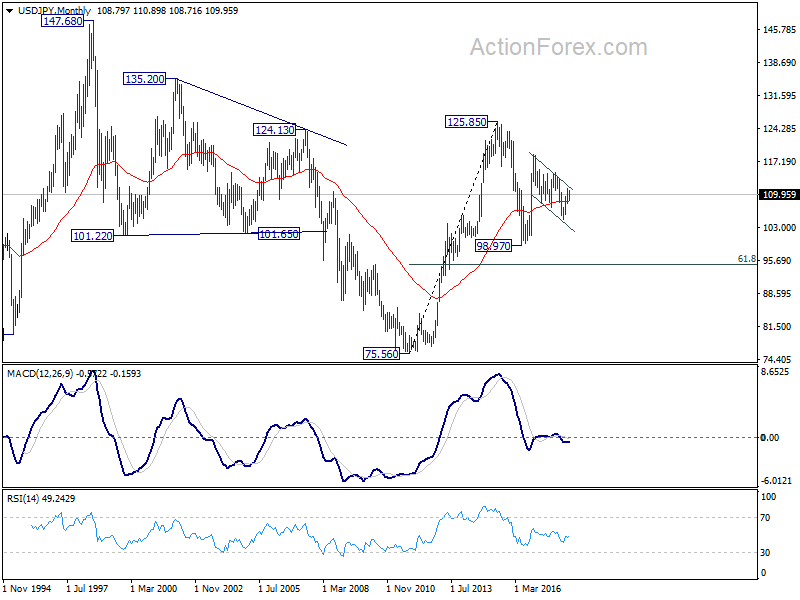
In the long term picture, the rise from 75.56 (2011 low) long term bottom to 125.85 top is viewed as an impulsive move, no change in this view. Price actions from 125.85 are seen as a corrective move which could still extend. In case of deeper fall, downside should be contained by 61.8% retracement of 75.56 to 125.85 at 94.77. Up trend from 75.56 is expected to resume at a later stage for above 135.20/147.68 resistance zone.
GBP/USD Weekly Outlook
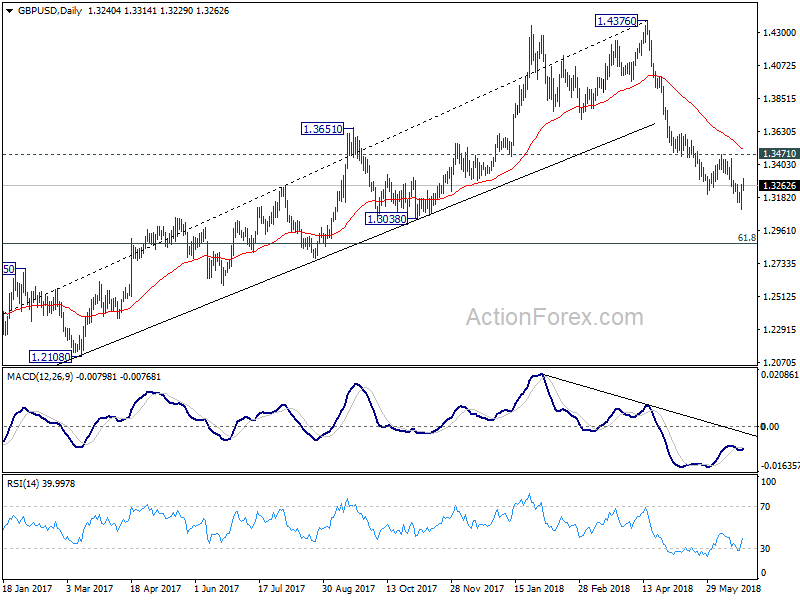
GBP/USD dropped further to 1.3101 last week but formed a temporary low there and recovered. Initial bias remains neutral this week for consolidations first. Upside of recovery should be limited by 1.3471 resistance to bring fall resumption. On the downside, break of 1.3101 will resume the whole decline from 1.4376 and target 61.8% retracement of 1.1946 to 1.4376 at 1.2875 next.
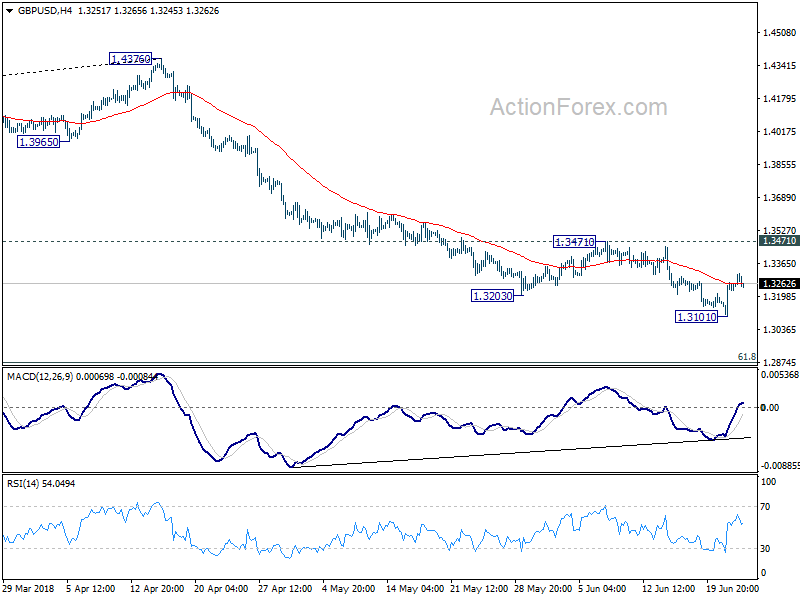
In the bigger picture, current development suggests that whole medium term rebound from 1.1936 (2016 low) has completed at 1.4376 already, with trend line broken firmly, on bearish divergence condition in daily MACD, after rejection from 55 month EMA (now at 1.4177). 61.8% retracement of 1.1936 (2016 low) to 1.4376 at 1.2874 is the next target. We'll pay attention to the reaction from there to asses the chance of long term down trend resumption. For now, outlook will stay bearish as long as 55 day EMA (now at 1.3507) holds, even in case of strong rebound.
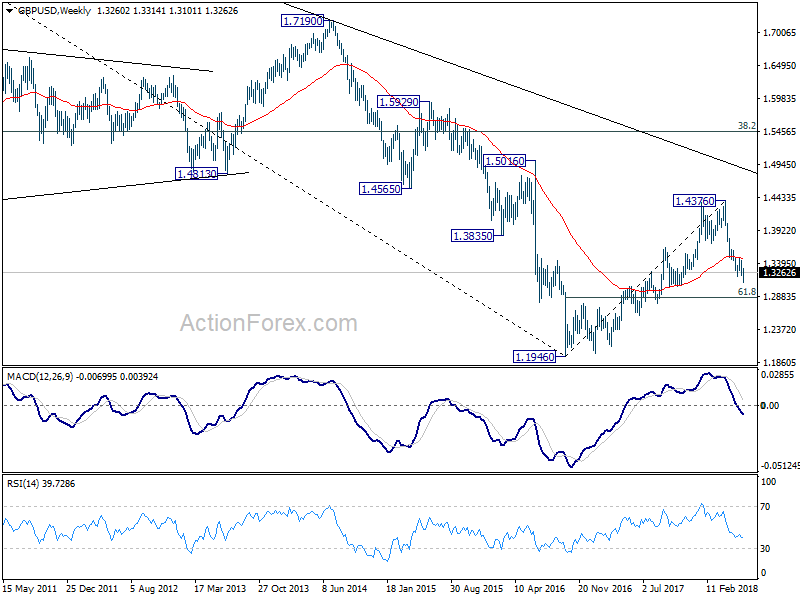
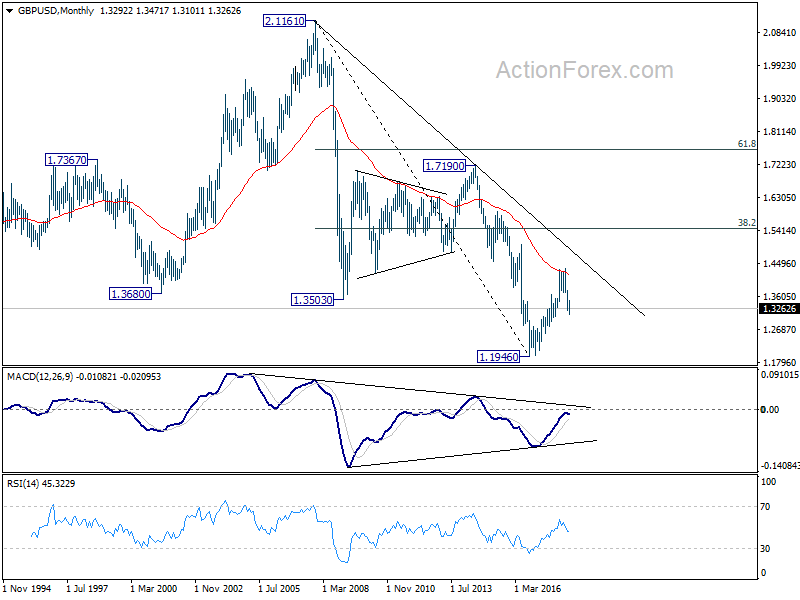
In the longer term picture, rise from 1.1946 (2016 low) is viewed as a corrective move, no change in this view. Rejection from 55 month EMA argues that it might be completed already. Larger down trend from 2.1161 (2007 high) could extend to a new low. This will now be the preferred case as long as 1.4376 resistance holds.
USD/CHF Weekly Outlook
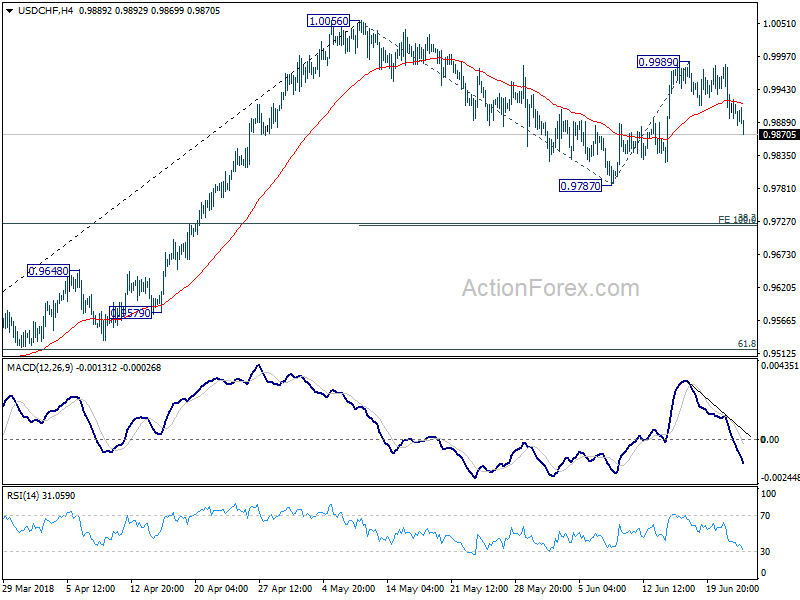
USD/CHF dropped sharply towards the end of last week. The development suggests that rebound from 0.9787 has completed at 0.9989 already. More importantly, the corrective pattern from 1.0056 is extending. Initial bias remains on the downside this week for 0.9787 and below. Though, we'd expect strong support from 0.9720/4 cluster support (38.2% retracement of 0.9186 to 1.0056 at 0.9724, 100% projection of 1.0056 to 0.9787 from 0.9989 at 0.9720) to bring rebound. On the upside, above 0.9989 will bring retest of 1.0056 high first.
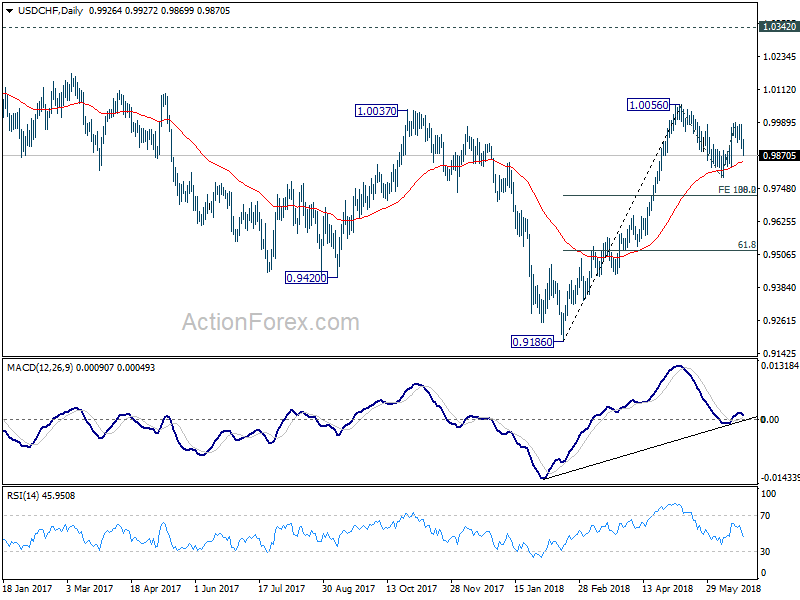
In the bigger picture, medium term decline from 1.0342 has completed with three waves down to 0.9186. Rise from there is currently viewed as a leg inside the long term range pattern. Hence, while further rally would be seen, we'd be cautious on strong resistance from 1.0342 to limit upside. For now, further rise is expected as long as 38.2% retracement of 0.9186 to 1.0056 at 0.9724 holds. However, sustained break of 0.9724 will dampen this bullish view and would at least bring deeper fall to 61.8% retracement at 0.9518.
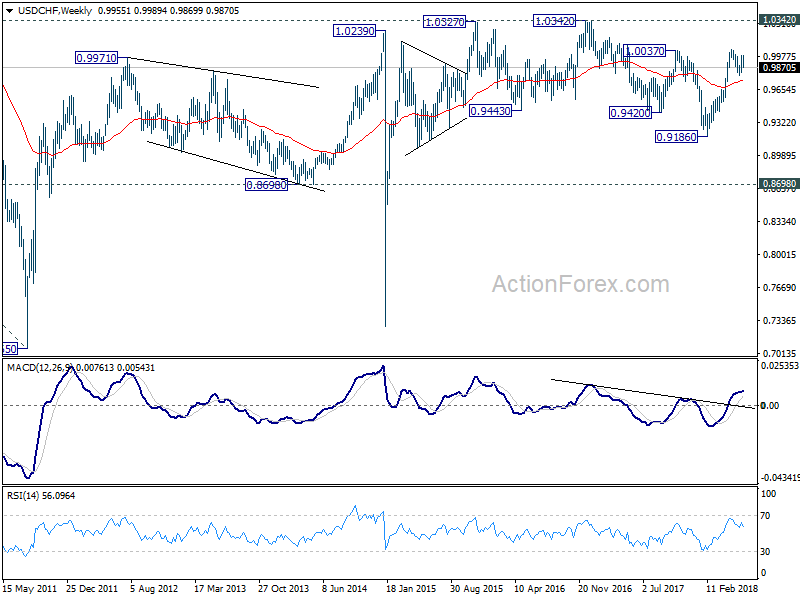
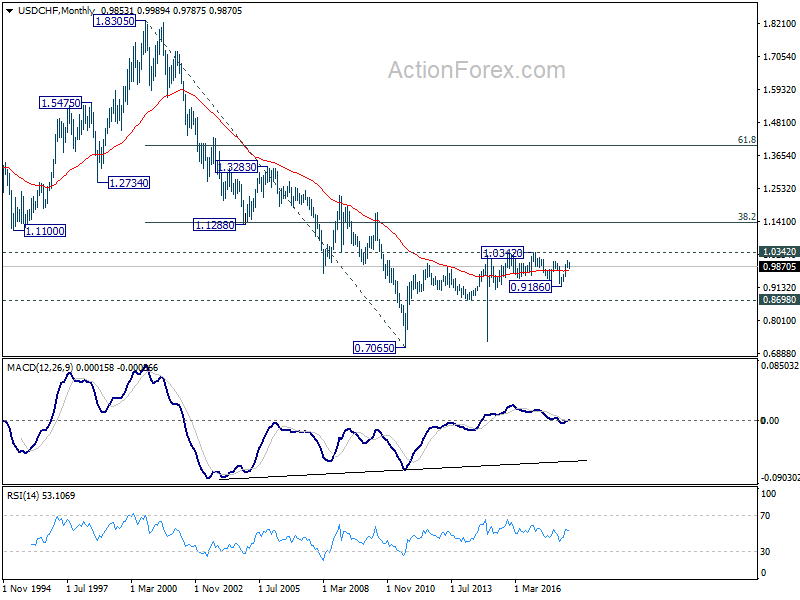
In the long term picture, price actions from 0.7065 (2011 low) are not clearly impulsive yet. Thus, we'll treat it as developing into a corrective pattern, at least, until a firm break of 1.0342 resistance.
AUD/USD Weekly Outlook
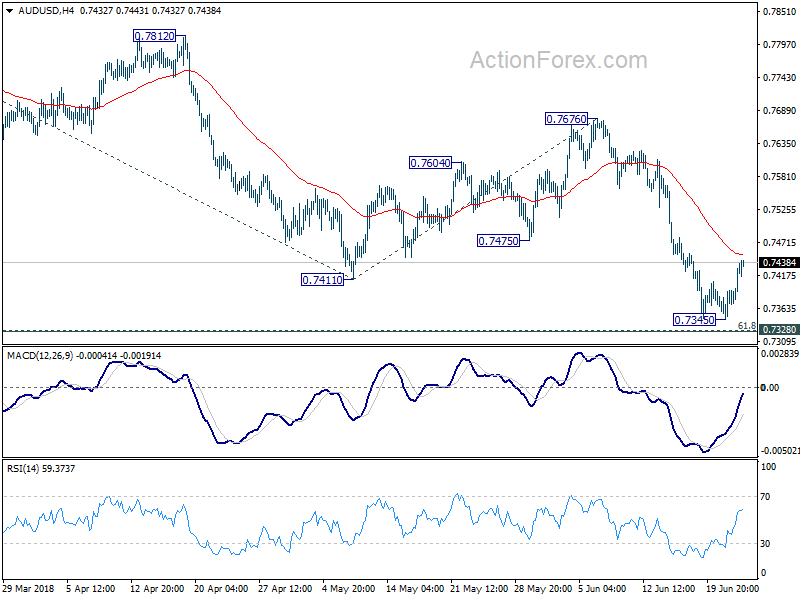
AUD/USD dropped further to 0.7345 last week but formed a temporary low ahead of 0.7328 cluster support (61.8% retracement of 0.6826 to 0.8135 at 0.7326). Intraday bias is mildly on the upside this week for rebound. But upside should be limited below 0.7676 resistance to bring fall resumption. ON the downside break of 0.7328 cluster support will target 61.8% projection of 0.8135 to 0.7411 from 0.7676 at 0.7229 next.
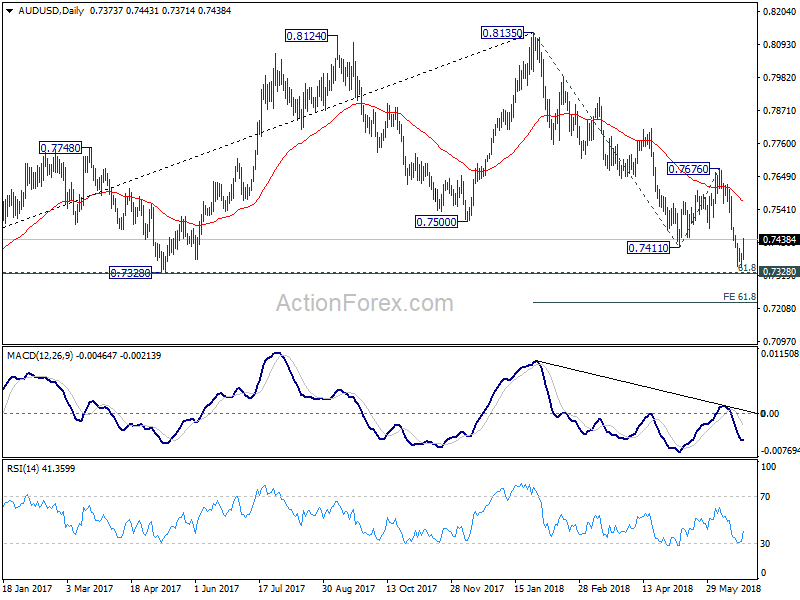
In the bigger picture, medium term rebound from 0.6826 is seen as a corrective move that should be completed at 0.8135. Deeper decline would be seen back to retest 0.6826 low. This will now remain the favored case as long as 0.7676 resistance holds.
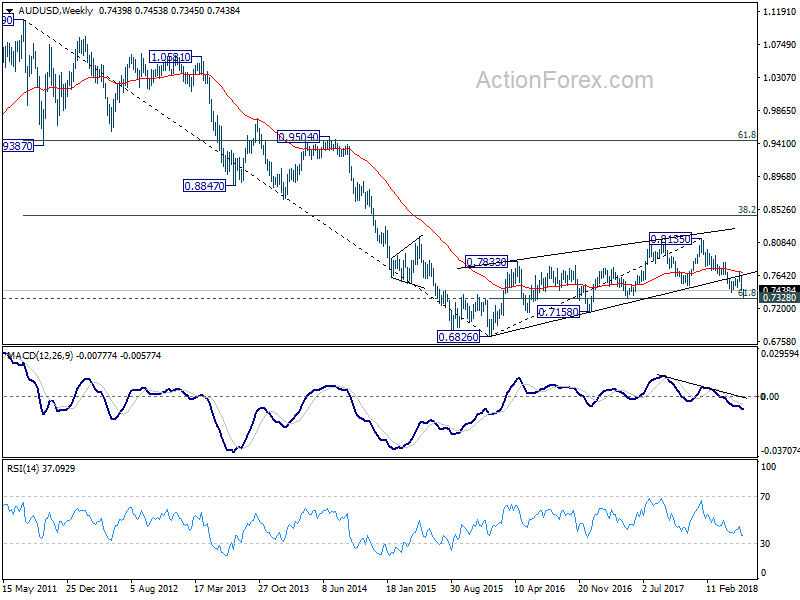
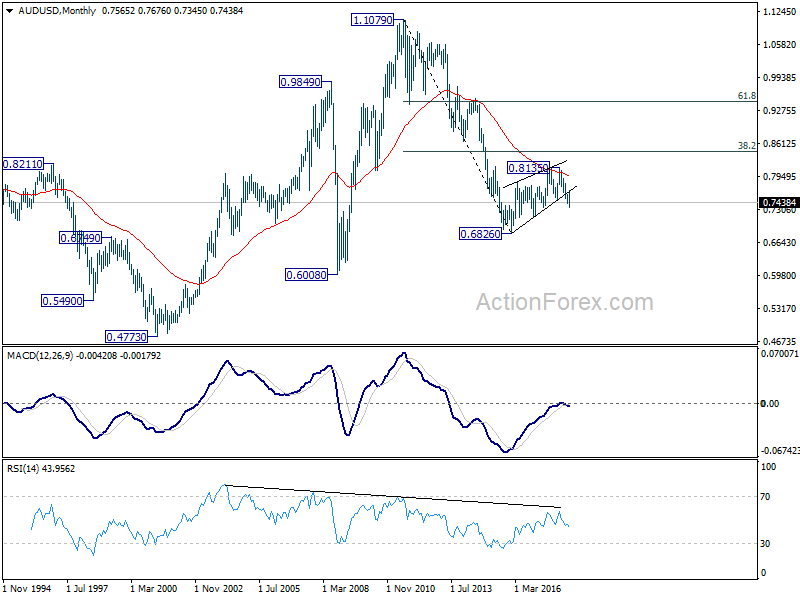
In the longer term picture, 0.6826 is seen as a long term bottom. Rise from there could either reverse the down trend from 1.1079, or just develop into a corrective pattern. At this point, we're favoring the latter. And, as long as 38.2% retracement of 1.1079 to 0.6826 at 0.8451 holds, we'd anticipate another decline through 0.6826 at a later stage. But strong support should be seen between 0.4773 (2001 low) and 0.6008 (2008 low).
USD/CAD Weekly Outlook
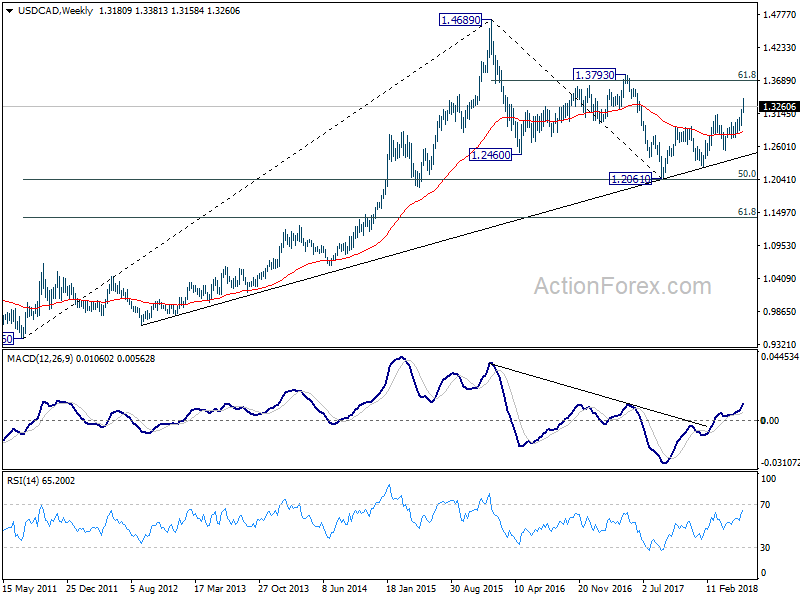
USD/CAD rose further to 1.3381 last week but subsequent fall suggests temporary topping, ahead of 100% projection of 1.2246 to 1.3124 from 1.2526 at 1.3404. Initial bias is turned neutral this week first. Deeper pull back could be see to 4 hour 55 EMA (now at 1.3190) and below. But downside should be contained above 1.2948 support to bring another rally. ON the upside, firm break of 1.3381 should target 1.3685 medium term fibonacci level next.
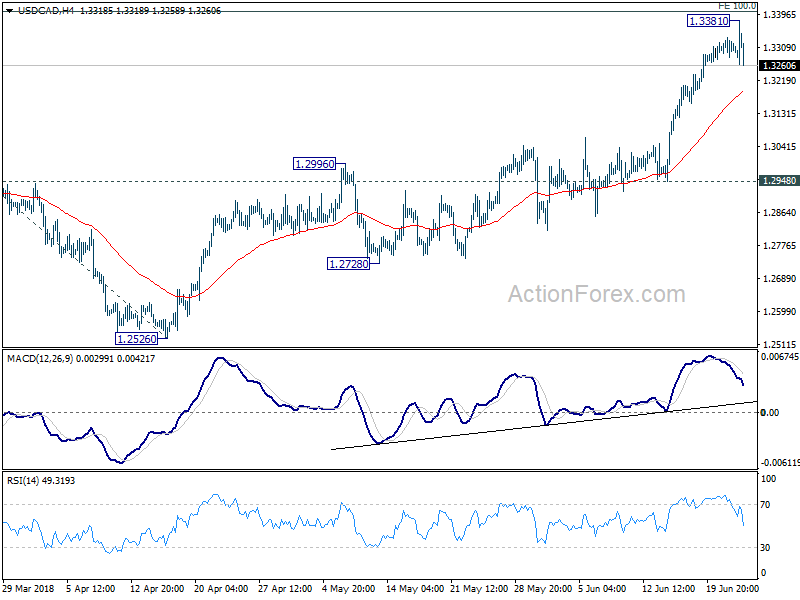
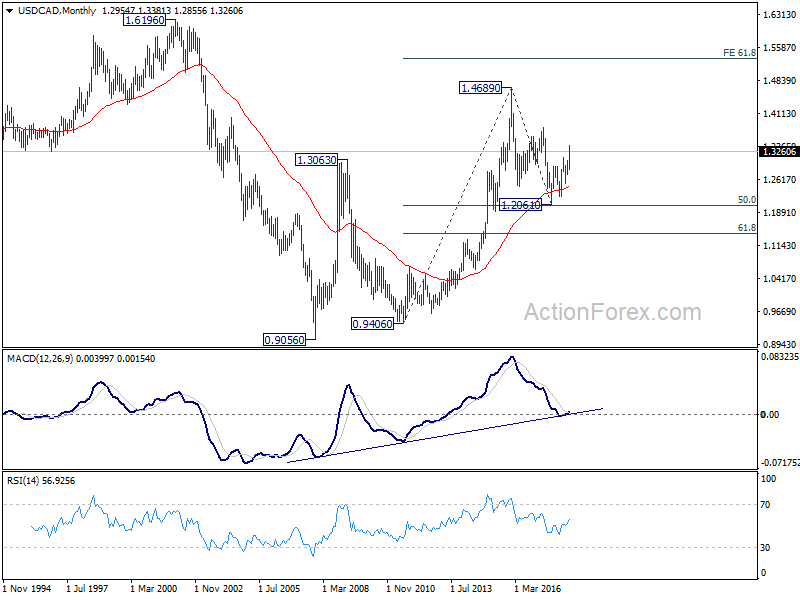
In the bigger picture, current development solidify the view of bullish trend reversal. That is fall from 1.4689 (2015 high) has completed at 1.2061, ahead of 50% retracement of 0.9406 (2011 low) to 1.4689 (2015 high) at 1.2048. Further rally should be seen for 61.8% retracement of 1.4689 to 1.2061 at 1.3685 and above. This will now be the preferred case as long as 1.2916 resistance turned support holds, even in case of deep pull back.
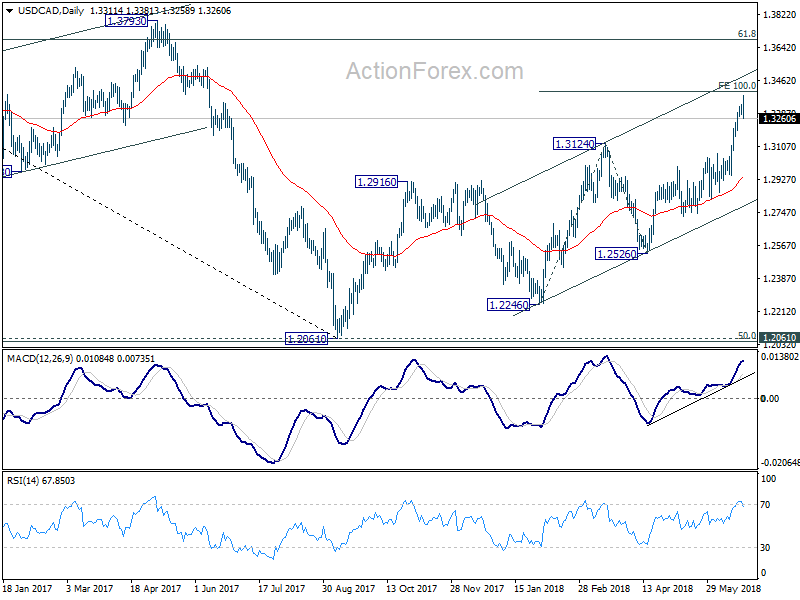
In the longer term picture, corrective fall from 1.4689 (2015 high) should have completed with three waves down to 1.2061, just ahead of 50% retracement of 0.9406 (2011 low) to 1.4689 (2015 high). The development keeps long term up trend from 0.9406) and that from 0.9056 (2007 low) intact. It's early to tell, but there is now prospect of extending the long term up trend to 61.8% projection of 0.9406 to 1.4689 from 1.2061 at 1.5326 in medium to long term.