

Sample Category Title
Canadian Trudeau can’t accept why Trump damages his own auto industry
Canadian Prime Minister Justin Trudeau said yesterday that he couldn't imagine Trump damaging the car industry of the US by imposing auto tariffs. He said, "I have a hard time accepting that any leader might do the kind of damage to his own auto industry that would happen if he were to bring in such a tariff on Canadian auto manufacturers, given the integration of the parts supply chains or the auto supply chains through the Canada-U.S. border."
Trudeau tried to tone down Trump's personal attack on him. He said that "I'm not in a position to opine on motivations of the president. I'm going to stay focused on the relationship that we're building, on defending Canada's interests, on looking for ways to further push the benefits of improving and modernizing NAFTA ... in all three of our countries."
Accord to a recent poll by Ipsos conducted between June 13-15, approval rating of Trudeau jumped to 50%, with 12% of Canadian strongly supporting him and 39% somewhat supporting. That's a notable increase from the low of 44% at the end of March. That came after Trump's personal attack on Trudeau saying that he acted so "meek and mild" during the G7 meeting. And, Trump's trade advisor Peter Navarro said "there is a special place in hell" for Trudeau.
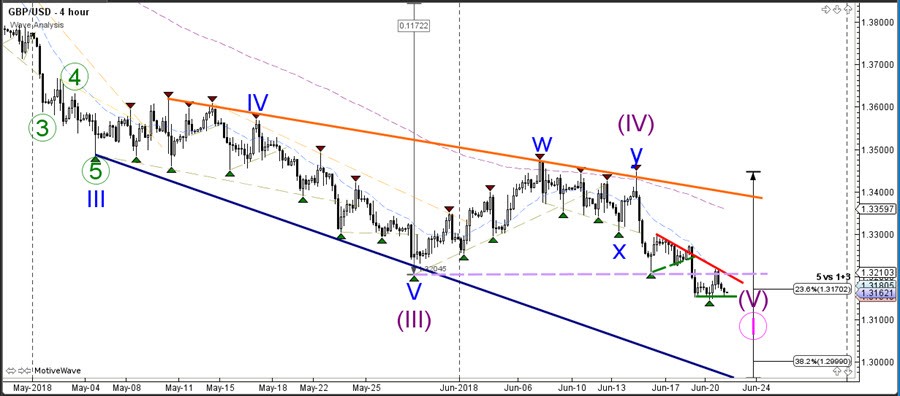
GBP/USD Bearish Breakout Has Fibonacci Targets At 1.30
The GBP/USD retested and bounced at the broken support level at 1.32 which now became resistance. A bearish continuation is likely if price manages to break the bottom.
The GBP/USD could aim for the next Fibonacci target at 1.30 if price manages to push below the support zone.
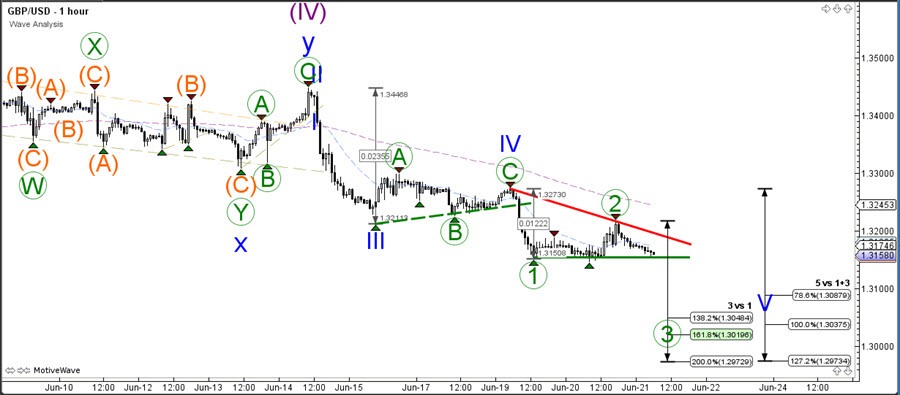
The GBP/USD retracement yesterday could have been a wave 2 pullback. Price will need to fall to at least 1.3050 before a wave 3 pattern as indicated here can be confirmed
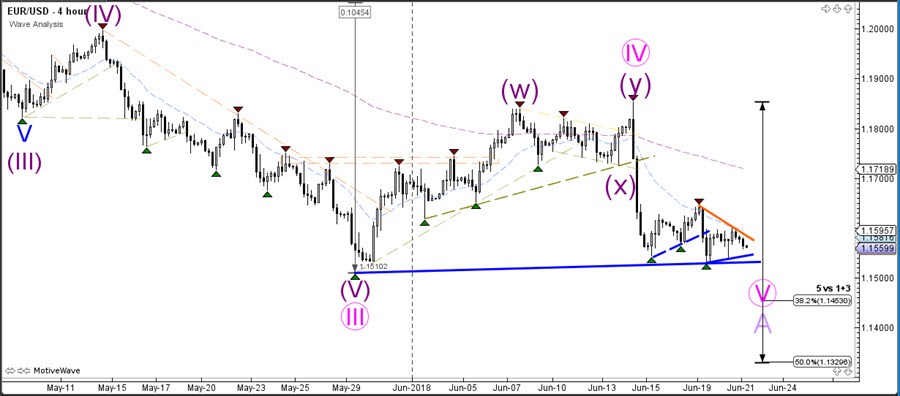
EUR/USD Downtrend Aims At 1.1450 After Pattern Breakout
The EUR/USD is building a consolidation zone around 1.16 but a bearish continuation still seems likely when considering overall downtrend and bearish momentum.
The EUR/USD needs to break below the support trend lines for a bearish continuation. The main target is at 1.1450 which is a 50% Fib from the weekly chart.
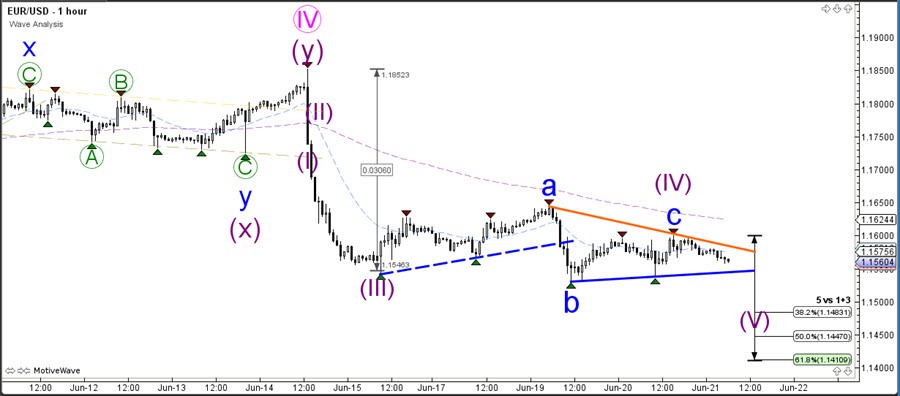
The EUR/USD is building a smaller consolidation triangle. A bearish breakout could be part of a wave 5 (purple).
USD/JPY Tests 78.6% Fib And Trend Line Resistance
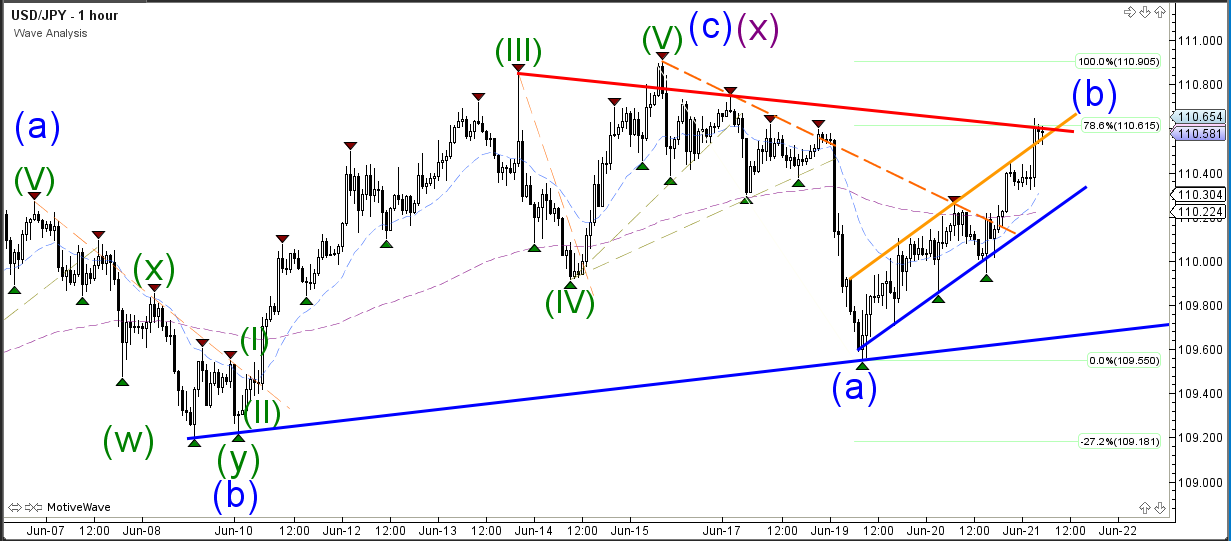
The USD/JPY is approaching a key resistance trend line (red), which is a critical bounce or break zone. A bullish breakout above the trend line would invalidate the current expected bearish ABC pattern whereas a bounce could see price complete a wave X (pink) at a lower low.
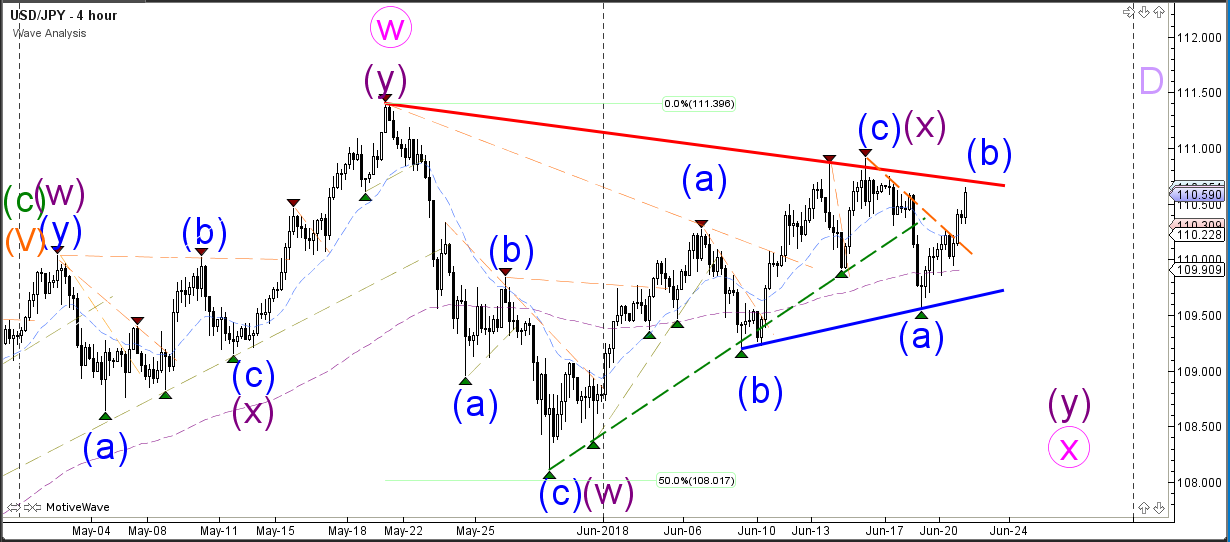
The USD/JPY is also testing the 78.6% Fibonacci resistance level and the top of the bullish channel (orange), besides the resistance trend line (red). These factors make this price zone a key area.
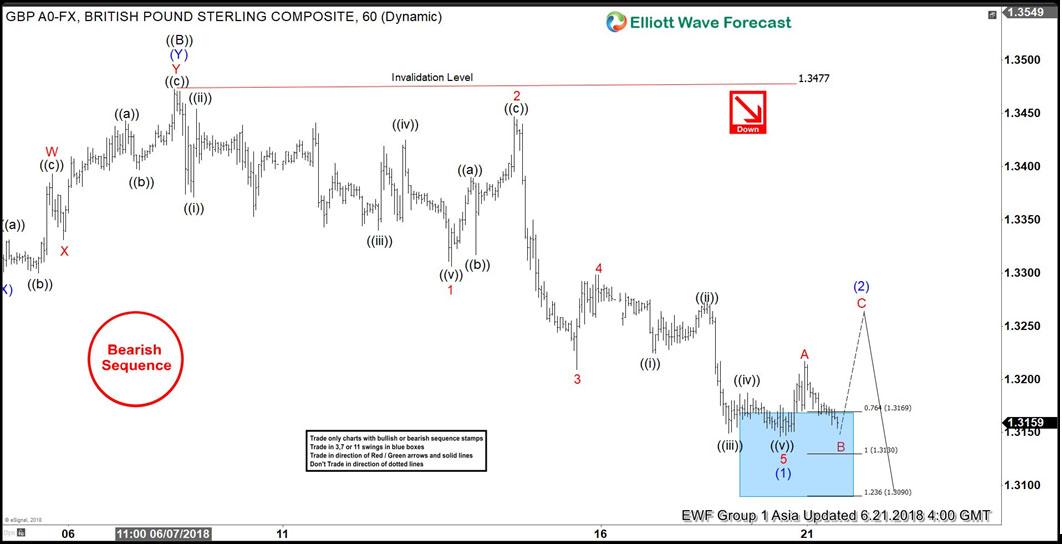
Elliott Wave Analysis: GBPUSD Showing Incomplete Sequence
GBPUSD short-term Elliott Wave view suggests that the recovery to 1.3473 on 6/07/2018 peak ended primary wave ((B)) bounce as double three structure. Below from there, the pair has managed to break below the previous low on 5/29 (1.3203) to confirm the next extension lower in primary wave ((C)) has started. With this break lower, the sequence from 4/17/2018 peak has become incomplete to the downside.
Down from 1.3473 high, intermediate wave (1) unfolded as an impulse structure with lesser degree sub-division showing 5 waves structure in Minor wave 1, 3 & 5. The internals of Minor wave 1 ended in 5 waves at 1.3306. The Minor wave 2 bounce ended at 1.3447. Then Minor wave 3 ended in another 5 waves at 1.3209. Minor wave 4 ended at 1.3298 & Minor wave 5 of (1) is proposed complete in 5 waves at 1.3146 low.
Above from there, pair could have started intermediate wave (2) recovery in 3, 7 or 11 swings. However, pair needs to make further separation from the lows to validate this view. If pair breaks below 1.3146 low instead, then it is still in the process of ending Minor wave 5 lower. Near-term, while pullbacks stay above from 1.3146 low, the pair is expected to do a bounce higher in intermediate wave (2). The it should find sellers in 3, 7 or 11 swings for further downside extension in the pair. We don’t like buying the pair in the proposed bounce. And expect sellers to appear in any rally in 3, 7, 11 swing for extension lower in the pair.
GBPUSD 1 Hour Elliott Wave Chart
Chinese Vice Premier to meet European Commission Vice President Katainen next week on trade
Chinese Vice Premier Liu He will be meeting with European Commission Vice President Jyrki Katainen in Bejing on June 25. That's the seventh China-EU high level economic and trade summit since 2007, when the mechanism was established.
Spokesman of the Ministry of Commerce said in a regular briefing that the meeting is an important platform for for communications and coordinations of economic and trade policies. And it's an important time when "trade and economic cooperation faces new historical opportunities."
Issues to be discussed will include " global economic governance, trade and investment, innovation-driven development, and interconnection that are of common concern to both sides". And, it's a "positive signal between China and the EU to oppose unilateralism and protectionism and support the multilateral trading system."
Market Morning Briefing: Euro Again Tested Levels Near 1.155-1.153
STOCKS
Dow (24657.80, -0.17%) closed below 24700 yesterday, reducing hopes of a bounce back just now. In case the index fails to rise above 24700 again, the index could turn significantly bearish in the coming sessions with chances of testing 24250-23750 on the downside.
Dax (12695.16, +0.14%) has attempted to move up slightly and if it manages to move above 12700 in the near term, the index could pick up some gains soon back to 13000. On the other hand if we see a fall again to levels below 12600, we would take a fresh look on the downside.
Nikkei (22681.38, +0.56%) has bounced from 22200 as expected and while that holds, the index could move up towards resistance at 22800 again. 22800 is a decent near term resistance and while that holds some range-bound movement within 22800-22200 is possible.
Shanghai (2927.70, +0.41%) seems to be holding above 2850 just now and could test 3000 before seeing another fall from there. Near term rise to 3000 is likely within a longer term bearish view.
Nifty (10772.05, +0.58%) continues to trade in the 10650-10850 region with no directional clarity for the medium term just now. continues to remain stable near 10800. A sharp down move is required to take it lower towards 10600. Sensex (35547.33, +0.74%) is also trading within the narrow 35250-35750 region and could soon come out of the range in the next 4-5 sessions.
COMMODITIES
Brent (74.63) has near term resistance at 76 which looks strong just now and may hold for a few sessions keeping the Brent prices lower. While below 76, Brent could test 73-72 before attempting a bounce back towards 76+ levels.
WTI (65.69) is stable for now and could range in the 64-67 region in the near term. While below 67, the price looks bearish but we do not see a fall below 64 just now. Overall some sideways movement is possible in the next few sessions.
Gold (1269.80) has broken below 1270 and while that sustains, medium term view turns bearish with possibilities of testing 1250-1240 in the coming sessions.
Copper (3.05) has come down sharply in the last 1-week and may bounce back from 3.0. On the other hand if the price fails to remain above 3, it could indicate a test of 2.95-2.90 in the near to medium term.
FOREX
Euro (1.1574): Euro again tested levels near 1.155-1.153 yesterday and has already dipped below crucial support on weekly candles near 1.156. While above 1.153, it might rise to 1.16 again in today's session. A break below 1.153 could make it bearish towards 1.145 (89 weeks MA).
Dollar Index (95.15): Dollar Index is gradually moving up towards resistance near 95.5-95.6 on the 3 day line chart, which could be tested by next week. A test of 1.145 by the Euro could correspond to a test of 96 by the Dollar Index in the coming 1-2 weeks.
Dollar Yen (110.56): As expected, Dollar Yen is continuing its oscillation between 111.0-109.5 this week. However Yen strength might resurface in the weeks ahead as markets get increasingly risk averse. A break below support on daily candles (near 109.5-110.0) sometime next week, is likely to make it bearish towards 107 in the medium term.
Euro Yen (127.98): Repeating yesterday’s comment: chances of bearishness in both Euro and Dollar Yen imply a possible break of horizontal support on weekly line chart (near 127.0) by Euro Yen in the next week. Dollar Yen @ 108 and Euro @ 1.145 gives a target near 124 (support on weekly candles) for Euro Yen - which could be possibly tested in 2-3 weeks.
Pound (1.3171): Pound is approaching support on 3 day candles near 1.31. There might be some support near 1.315, which is delaying a test of 1.31. However, we expect a downmove to 1.31 to happen by next week and a further dip towards 1.30 after that.
Dollar Rupee (68.075): Support seen at 68.00-67.90. Longer term trend points to rise towards 68.50.
INTEREST RATES
Yesterday, the US Fed Chairman reiterated at a Central Banking Forum in Sintra (Portugal) that a gradual rise in interest rates would continue. This led to a slight pause in the risk averseness which had set in due to the increasing prospects of a US-China trade war.
The US 10 year yield rose from lows near 2.88% towards 2.94%. As we have been saying in the last few briefings, the 10 year yield is close to support on medium term chart near 2.9%. It's inability to rise decisively above 3% indicates that the risk averse sentiment is strong and a decisive break of the support for a test of levels near 2.6% is a possibility in the weeks ahead.
Current US Yields: US 10 year (2.94%), 30 Year (3.08%), 5 Year (2.82%), 2 Year (2.57%)
Also as mentioned yesterday, US Yield curve inversion fears are gripping the bond markets. The less talked about US 10-7 Year spread is now near 0.031% and could possibly invert ie go negative soon. In the past, it has been a precursor to more important spreads ie (10-5 and 10-2) inverting. The 10-2 Year spread had broken long term support near 0.4% in the last few days and is currently near 0.37%.
German 10 year yield (0.38%) could move lower towards support near 0.3% on the medium term chart in the next 1-2 weeks.
New Zealand GDP grew 0.5% qoq, a look at bearish NZDUSD
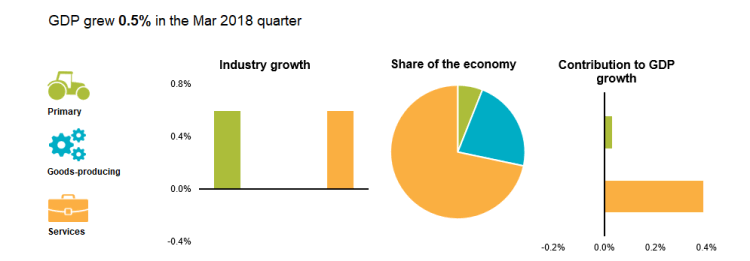
New Zealand GDP grew 0.5% qoq in the March quarter, slowed from 0.6% qoq in the prior quarter and met expectation. Over the year, GDP grew 2.7% ended March 2018. Per capita GDP was unchanged, down from 0.1% qoq rise in the prior quarter. Services industries grew 0.6%, notably slowed from prior 1.1%. Good-producing industries were flat as jump in manufacturing was offset by fall in constructions. Primary industries rebounded by growing 0.6%, up from prior quarter's -2.6%.
New Zealand Dollar remains pressured after GDP data and is extending the recent broad based decline. It's trading as the weakest for today and for the week.
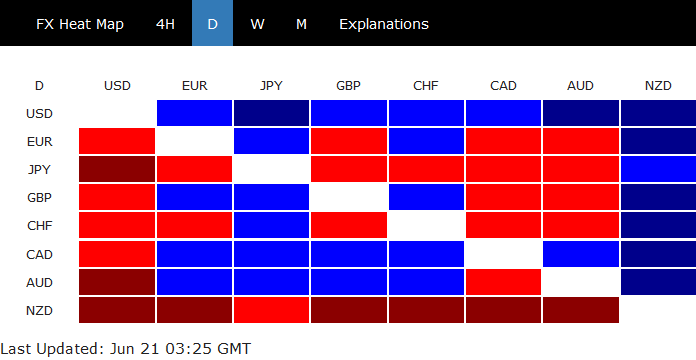
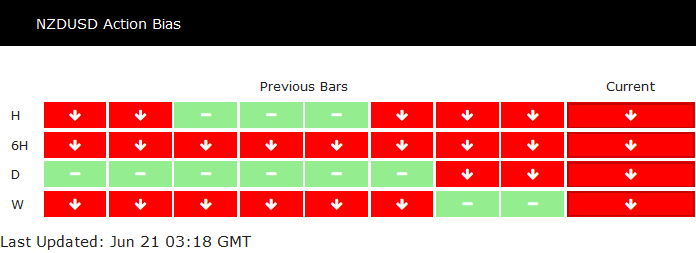
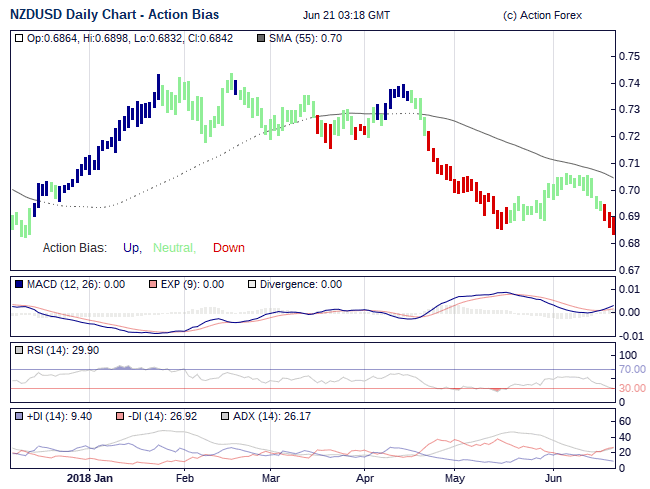
NZD/USD breaks May's low at 0.6850 to resume recent down trend from 0.7436. NZD/USD action bias table and the D action bias chart show that the down trend is picking up downside momentum again.
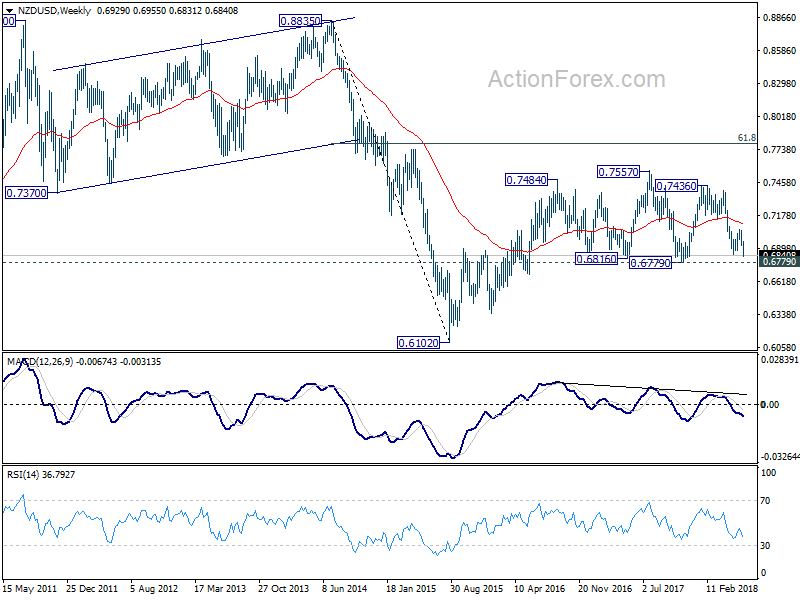
Nonetheless, we'd like to point out that 0.6779 (2017 low) is a key support level decisive break there will confirm completion of the corrective rise from 2015 low at 0.6102. And that will very likely resume the long term down trend from 2014 high at 0.8835, through 0.6102. So for quick trading, selling NZD/USD is the strategy for sure. But one has to be alerted as it touches 0.6779. For position trading, we'd prefer to see if 0.6779 would be taken out firmly first.
GBP/JPY Upsides Remain Capped By 146.00
Key Highlights
- The British Pound declined recently and settled below a major support at 146.20 against the Japanese Yen.
- There is a key bearish trend line in place with resistance at 146.90 on the 4-hours chart of GBP/JPY.
- Recently in the UK, the CBI Industrial Trends Index increased from -3 to 13 in June 2018.
- Today in the UK, the BOE interest rate decision is lined up and the central back is likely to keep rates at 0.5%.
GBPJPY Technical Analysis
The British Pound faced a solid selling interest near 148.00 recently against the Japanese Yen. The GBP/JPY pair started a downside move and broke a major support at 146.20.
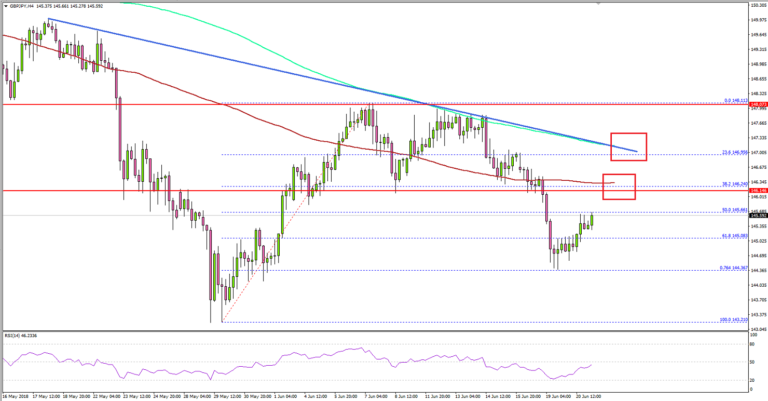
Looking at the 4-hours chart, there was a rejection noted from the 148.00 resistance zone. The pair is now trading well below 147.00, 100 (red) and 200 (green) simple moving average (4-hour).
There was even a break below the 50% fib retracement level of the last wave from the 143.21 low to 148.11 high, which is a bearish sign.
Recently, the pair traded close to the 144.30 support and tested the 76.4% fib retracement level of the last wave from the 143.21 low to 148.11 high. It is currently consolidating losses and it could correct a bit in the near term.
However, there are many resistances on the upside around the 146.00 and 146.20 level. Moreover, there is a key bearish trend line in place with resistance at 146.90 on the 4-hours chart of GBP/JPY.
Therefore, any major recoveries from the current levels are likely face a strong selling interest above the 146.00 level. On the downside, supports are at 144.50 and 144.30.
Economic Releases to Watch Today
- Swiss Trade Balance for May 2018 – Forecast 1,890M, versus 2,289M previous.
- BoE Interest Rate Decision – Forecast 0.50%, versus 0.50% previous.
- US Initial Jobless Claims – Forecast 220K, versus 218K previous.
- US House Price Index for April 2018 (MoM) – Forecast +0.3%, versus +0.1% previous.
Onwards And Upwards
Equity market
The US stock markets rose overnight as investors, at least for today have put trade fears in check, as the US tech sector beckons and roars. While markets remain unsure if we're in the calm after the storm, the lull between storms or even in the eye of the hurricane, but there's certainly a pattern forming that while equity markets quiver during the trade dispute, stocks come roaring back with FAANG (Facebook, Apple Amazon, Netflix and Google) consistently leading the charge. Despite the huge question mark over global trade, Wall Street quickly returns focus to the US economy and to which there is no denying it is doing exceptionally well. Investors are showing no fear as it's onwards and upwards for Facebook and Netflix!! Indeed, the five heavyweights remain the undisputed champions of US equity markets!
Oil Market
Despite the bearish overtones ahead of the OPEC meeting, prices have been trying to rally after the most significant weekly drop in inventories since January. But as we're less than a day away from one of the most anticipated and focused on OPEC and non-OPEC meeting in years, the market is still in search of some semblance of clarity. While clarity brings power, but I suspect it will also bring waves of volatility as we're indeed headed for some collision given the different takes, positioning and flat-out guesses heading into the meeting. While playing the edges of the well-worn ranges on the build-up to OPEC did prove to be a predictably good trade, but it's time to strap in and put on your trading caps, as Monday's futures open could be ” banger” of an event.
While Iran continues to put up a fuss about an increase, there appears to be an air of confidence that this deal will move through. Of course, much of Iran's consternations are as much political in nature as they are economical, suggesting a compromise will be forthcoming.
Despite the market's bearish lean, I remain bullish on oil expecting a production rise towards the lower end of the perceived range while global demand, particularly in Asia will continue to soar. But make no mistake this oil trade remains exceptionally vulnerable to OPEC.
Finally, based on overnight price action, it's probably a foreshadowing of things to come over the next 24 -48 hours. As anticipation reeves up for the Vienna summit, crude oil prices will become highly reactive to any headlines. If you like “chop fest”, this will be the market for you but be forewarned, it could be a bumpy ride.
Gold Market
With equity markets and the USD on the ups, gold remains entirely out of favour as precious metal traders took note of Fed Chair Powell reiterating his hawkish monetary policy stance. With trade war fears ebbing yet again, gold investors are finding little support from escalating geopolitical tensions.
We saw some new buying on the dip below $1270, but it appears to be hot money looking to flip on a bounce back to $1275. But with the current momentum clearly to the downside, in this bullish US dollar climate, upticks will continue to be sold.
As for the USD dollar signals, I'm not sure if this comes from the fact I cut my trading chops on Bay street trading $/ CAD. But the loonie is s providing some definitive signals for the ” big” dollar momentum, so in my view, any move to and above USDCAD 1.3350 could see a considerable extension lower on gold prices. Indeed, buyer beware in this dollar bull environment.
Currency Markets
As noted in yesterday afternoon update, it feels like we're moving back to the differential theme, but the big question is, why isn't the Euro lower!!
EUR: Entering the week, an extension lower was always going to be a data-dependent trade, and despite the test of 1.1535 there has been a fair amount of profit taking on the short EUR trades this week, but this could be falsely predicated on fears of a crowded trade. I don't believe this is the case, and I think it's the lack of tier one US economic data has traders erring on the side of caution as no one what to be short in the low 1.1500 in the event of a data surprise or another ECB flip-flop. The Euro has been served up on a silver platter two way's (Dove ECB Hawk FED), yet traders are s reluctant to engage shorts below 1.1550-75 levels. A bit of a head-scratcher but there it is none the less.
AUD: A clear path lower? Traders are merely biding time holding shorts awaiting the next wave rhetoric/escalation out of the US and China which will most certainly happen. Besides the Aussie sensitivity to lower commodity prices, there's that no less important issue of extreme RBA dovishness that continues to hang like an anvil around the AUD neck.
JPY: The long USDJPY is such a temptress, but with the constant stream of risk blow ups, it remains the dollar of least interest on my horizon.
MYR: USDMYR trading above 4.01 was both a surprise and proved to be an excellent near-term entry point. But my view on the MYR and local assets, in general, is on the expectation that we could be on for a long-term battle of attrition. While remaining entirely neutral on the MYR, it's hard to ignore opportunistic moves especially if you're sitting in the bullish oil camp, Brent moving back toward $80 could be a real cure-all for all that ails the Ringgit. So, let's see what surprises OPEC has on offer, fingers crossed for the MYR.