Sample Category Title
Dollar Rises as US Jobs Outperform Despite Trade Fears
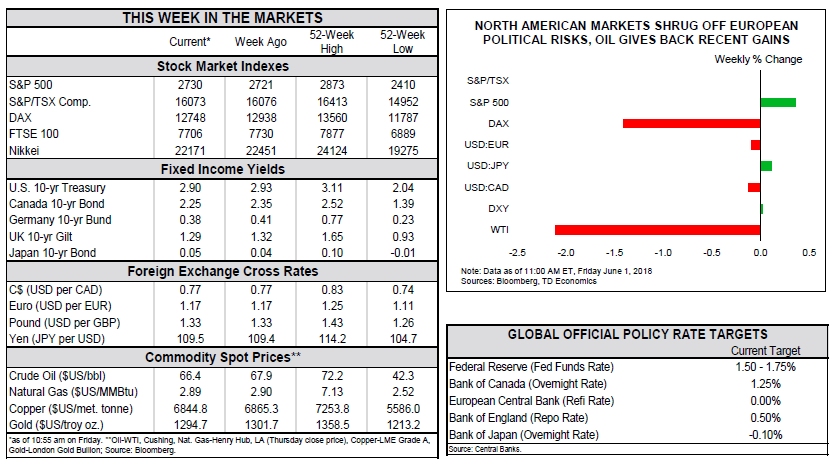
The US dollar is higher against major pairs on Friday after a strong US jobs report was published. The U.S. non farm payrolls (NFP) report showed the economy added 223,000 jobs last month driving the unemployment rate to a 18-year low of 3.8 percent. Wage growth surprised to the upside with a 0.3 percent gain that validates the comments from U.S. Federal Reserve members about the need for more rate hikes this year. The market has already priced in a lift in June, that could be joined by higher interest rate decision on the September and December FOMC meetings.
- Reserve Bank of Australia (RBA) to hold rates at 1.50 percent
- US Non manufacturing PMI to keep improving
- Trade war discussion to be top of mind
EUR Higher After Italian Drama Trade War Ahead
The EUR/USD gained 0.13 percent in the last five days. The single currency is trading at 1.1664 despite Friday’s release of the U.S. non farm payrolls (NFP). The EUR was near the 1.15 price levels as the political situation in Italy grabbed headlines. The coalition of the 5-Star movement and the League was almost over as soon as it began and new elections were in the horizon. The reshuffle of some cabinet positions was enough to get the new government approved and the single currency appreciated soon after the news broke.
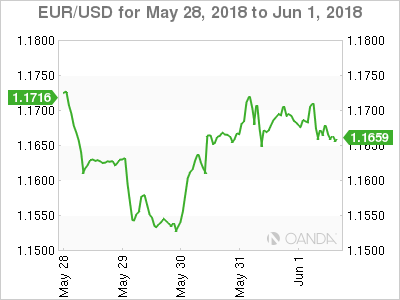
With Italy out of the way the market is now focusing on Spanish politics as Prime Minister Mariano Rajoy was ousted after failing a vote of confidence. The new PM Pedro Sanchez is focusing the priorities of his minority government in reversing social program cuts and improving the relationship with Catalunya. The back and forth on trade after the US announced the EU, Canada and Mexico would lose their aluminum and steel trade exceptions will dictate the pace in a week with little economic data to digest.
The week will be a quiet one for US releases with most of the action in Europe focused on the United Kingdom and Europe’s PMIs and German indicators. The response to US tariffs has been swift and retaliation has been announced from the EU, but the biggest development will be how this story evolves ahead of the G7 meeting in Canada.
Loonie Trapped Between BoC Optimism and Trade War Fears
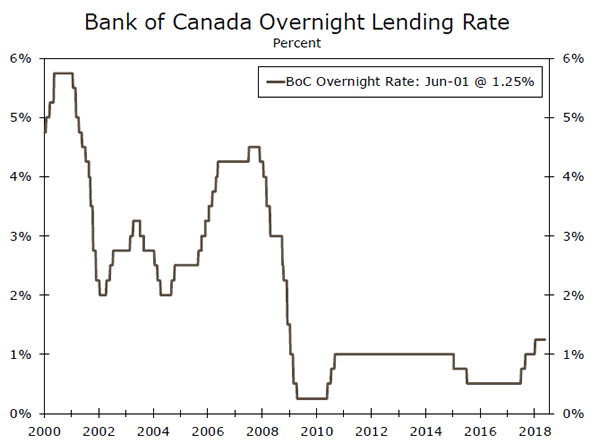
The USD/CAD lost 0.02 percent during the week. The currency pair is trading at 1.2967 after a volatile five days. The Bank of Canada (BoC) held the benchmark interest rate at 1.25 percent but was hawkish of a rate lift in July. The loonie was higher midweek only to suddenly depreciate after the announcement that the US was removing the exemption on steel and aluminium tariffs to Canada. NAFTA uncertainty has put downward pressure on the loonie since the Trump administration embarked in tough negotiation tactics.
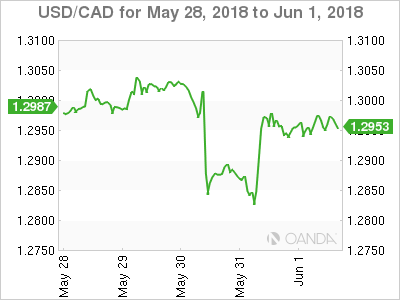
The biggest release for the Canadian dollar will be the publication of the jobs report on Friday, June 8 at 8:30 am EDT. The forecast calls for a gain of 17,000 jobs in May. A strong employment report would validate the prediction from economists of a 25 basis points hike in July. The U.S. Federal Reserve is expected to lift its benchmark Fed funds rate in June, so a move by the Canadian central bank would also serve to close the gap between the two rates.
The USD/MXN appreciated since the start of the week as first risk aversion made the USD a safe haven for investors that sold their emerging market positions as the Italian political drama unfolded. As that situation started to cool down the Trump administration announced that due to the slow progress of the NAFTA negotiations it would remove the exemption to steel and aluminum tariffs to Canada and Mexico. The currency pair started the week at 19.5013 and is trading on Friday at 19.9148 and inching closer to the 1.20 price level.
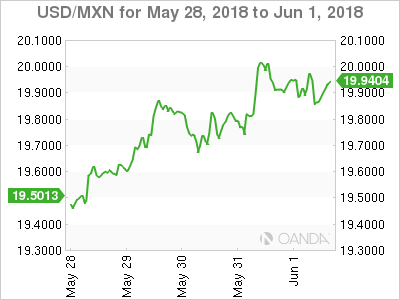
The Mexican peso is under pressure as Presidential elections are around the corner. The NAFTA negotiators were motivated to reach a deal ahead of the elections in Mexico as a new government could alter the position of the Mexican government. The party that is ahead in the polls is a leftist party, but so far its candidate Andres Manuel Lopez Obrador has managed to keep his policies aimed towards the center to avoid surrendering the lead ahead of the July 1 elections.
Market events to watch this week:
Monday, June 4
- 4:30am GBP Construction PMI
Tuesday, June 5
- 12:30am AUD Cash Rate
- 12:30am AUD RBA Rate Statement
- 4:30am GBP Services PMI
- 9:00am EUR ECB President Draghi Speaks
- 10:00am USD ISM Non-Manufacturing PMI
- 9:30pm AUD GDP q/q
Wednesday, June 6
- 8:30am CAD Trade Balance
- 10:30am USD Crude Oil Inventories
- 9:30pm AUD Trade Balance
Thursday, June 7
- 11:15am CAD BOC Gov Poloz Speaks
Friday, June 8
- 8:30am CAD Employment Change
- 8:30am CAD Unemployment Rate
*All times EDT
Weekly Economic and Financial Commentary: Global Outlook Remains Positive Amid Italy Turmoil
U.S. Review
Heading Into Summer, Labor Market Is Already Hot
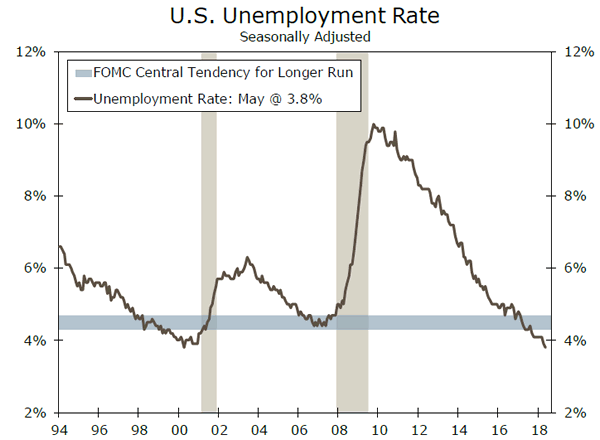
- The labor market strengthened further in May, with employers adding 223,000 new jobs, the unemployment rate falling to 3.8 percent and wages rising 0.3 percent.
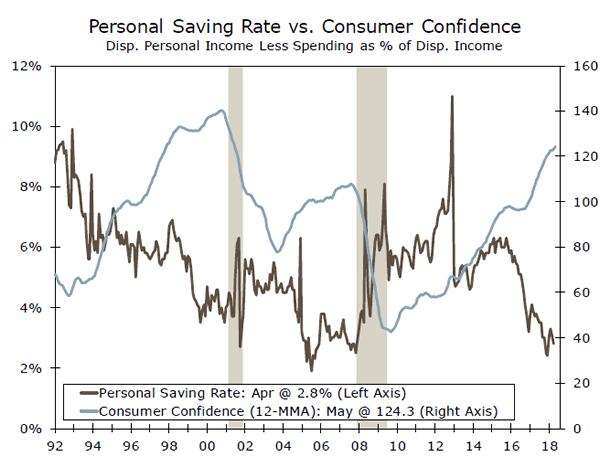
- The household saving rate edged lower, as consumer spending outpaced income for a second straight month. The boost to real disposable income from the tax reform is under pressure from rising inflation as gasoline prices have continued to climb.
- Consumers continue to maintain a high degree of confidence in the economy, with the Conference Board's measure increasing 2.4 points in May.
Heading Into Summer, Labor Market Is Already Hot
Despite a holiday-shortened weak, there was a lot to learn in recent days about the state of the American consumer. Consumer's confidence in the economy remained buoyant heading into summer, with the Conference Board's measure rising 2.4 points. Households viewed both current and future economic conditions more favorably, while the labor differential - the share of households reporting jobs as "plentiful" minus the share reporting "hard to get" - pointed to an increasingly tight labor market.
Consumers' optimism about the economy helped to fuel spending above and beyond income growth in April. Household spending rose 0.6 percent in April, while personal income rose 0.3 percent. Stronger spending has also been driven by the recent federal tax changes leading to lower withholding for many households. Income outpaced spending the first two months of the year when changes initially went into effect. Now with the tax savings accumulating (and more mild weather), households have stepped up spending. The saving rate, in turn, has fallen half a point since February, but at 2.8 percent remains above December's 2.4 percent rate.
Spending has also been lifted in recent months by climbing gasoline prices. Although gas prices typically rise heading into the summer driving season, the average national price of a gallon of gas according to AAA was $2.72 in April, a 13 percent increase over last year. With gas prices having climbed another 6 percent in May, real household spending power is coming under pressure despite the recent boost tax changes have provided to disposable income.
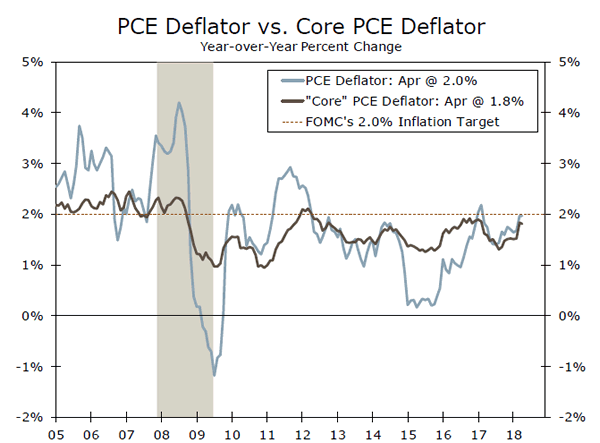
Inflation, measured by the PCE deflator, rose 0.2 percent in April, keeping it at 2.0 percent year-over-year. That is only the fourth month in the past six years inflation has been at or above the Fed's target. Beyond gasoline prices, however, inflation is firming. The core PCE index rose more than expected in April (0.2 percent), and, at 1.8 percent, is also closing in on the Fed's target.
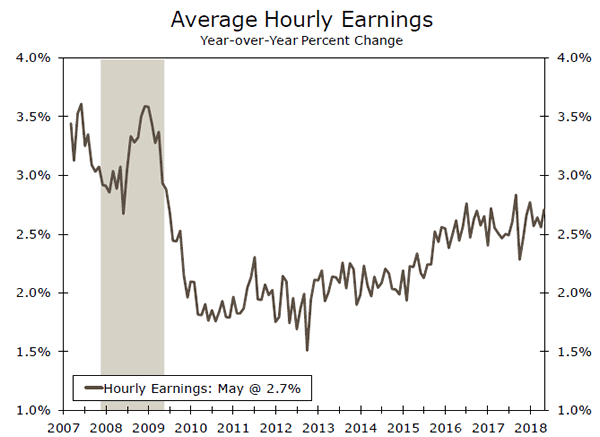
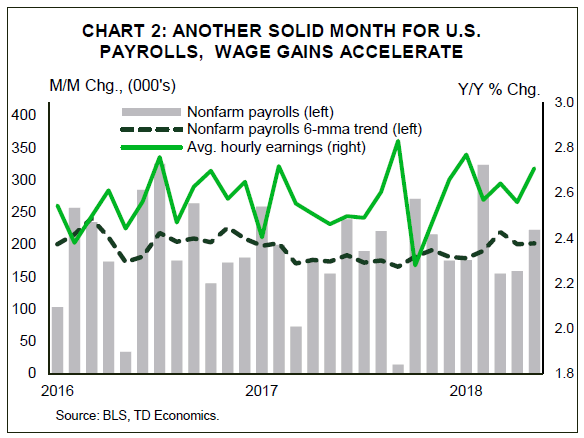
Rising inflation has made the need for stronger wage growth all the more pressing for workers. In May, average hourly earnings growth rose 0.3 percent, bringing the year over year rate up to 2.7 percent. Although that is still a bit below the pace registered a few months back, strong hiring continues to support aggregate income growth among households. The income proxy - total hours worked multiplied by average hourly earnings - has improved to a 5.4 percent annualized pace over the past three months, compared to 3.3 percent at the start of the year.
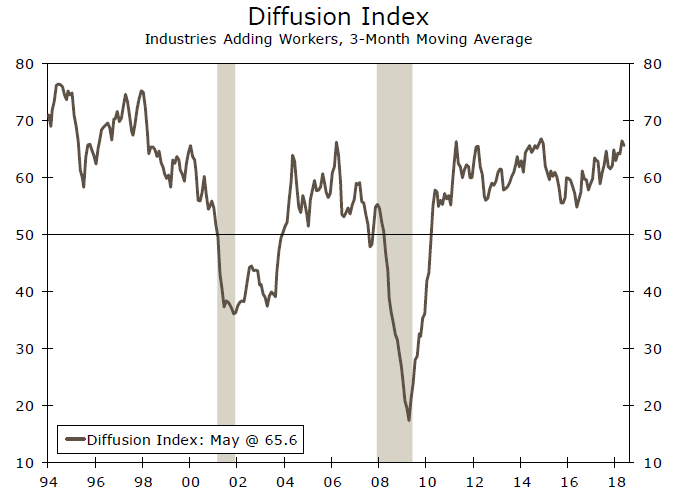
Employers added 223,000 new jobs in May, with gains widespread across industries. The diffusion index - a measure of the net share of industries adding jobs - improved to 67.6 in May and has been trending up over the past year. The supply of labor looks increasingly scarce and will likely place additional upward pressure on compensation costs. The unemployment rate fell to 3.8 percent, which matches the low of the 1991-2001 cycle. Labor force participation also ticked down, highlighting that structural challenges to bringing more workers back into the labor force linger.
U.S. Outlook
Factory Orders • Monday
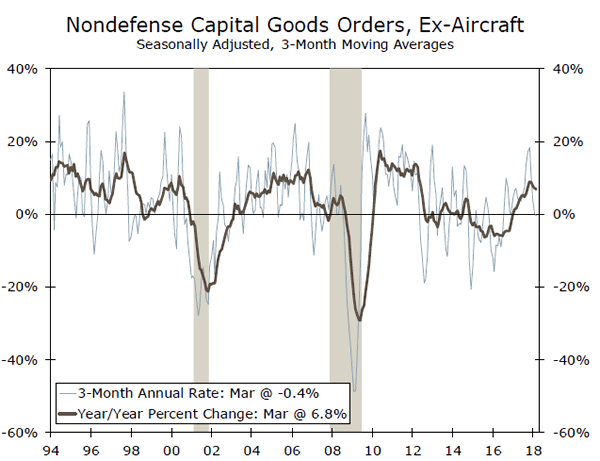
Factory orders beat expectations and increased 1.6 percent in March. Much of the gain, however, was attributable to civilian aircraft orders, which surged 44.5 percent for the month. Core capital goods orders and shipments both declined, which is not a positive sign for future growth in equipment spending. Orders for defense aircraft, motor vehicles, construction machinery, and industrial machinery were also all down for the month.
Factory orders have increased in seven of the past eight months, and capital spending has been adding to topline GDP growth in each of the past six quarters. However, the fastest quarterly growth rates for capital spending may well be behind us. The declines in core capital goods spending suggest limited upside for future capital spending at this late stage of the economic cycle; however, there is scope for equipment spending to remain supportive of growth in the coming quarters.
Previous: 1.6% Wells Fargo: -0.4% Consensus: -0.4% (Month-over-Month)
ISM Non-Manufacturing • Tuesday
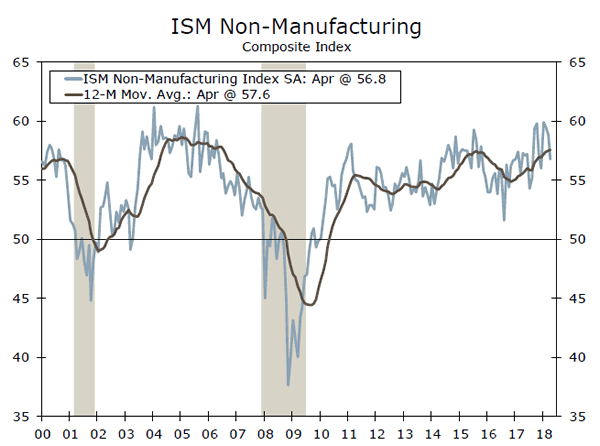
The ISM non-manufacturing index fell in April; however, it remained solidly in expansion territory at 56.8. New orders improved during the month, while current activity moderated and delivery times lengthened. Input prices also increased as cost pressures continued to pick up outside of the manufacturing sector. The employment component of the index also softened compared to the impressive pace posted over the past few months. While the hiring component of the index eased in April, this is largely in-line with our view that there is little slack left in the labor market and employment growth should continue to downshift.
Activity outside the industrial sector expanded at a slower pace in April. Despite registering more temperate activity, the forwardlooking new orders index increased last month, and the composite index remains at a level consistent with solid economic growth. We expect the composite index to trend higher this month.
Previous: 56.8 Wells Fargo: 58.0 Consensus: 57.8
Trade Balance • Wednesday
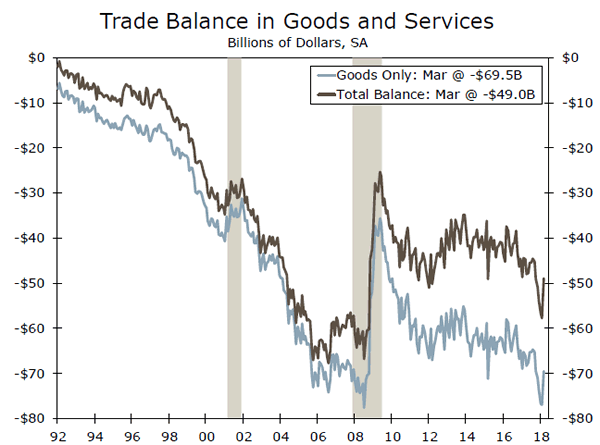
The U.S. trade deficit narrowed to $49 billion in March. The drop followed a nine-year high of $57.7 billion in February. A $4.2 billion increase in exports of goods and services, alongside a $4.6 billion decrease in imports, led March's significant drop in the trade deficit. Two transient factors likely played an outsized role in the sharp decline, namely a jump in volatile aircraft orders as well as port closures due to the timing of the Chinese New Year.
Real net exports were supportive of first quarter GDP growth. Exports of goods rose at solid pace in both February and March which suggests exports should continue to add to GDP growth in the second quarter. Meanwhile, imports fell 1.6 percent in March and are expected to have a limited effect on second quarter GDP. Looking ahead, global economic growth should continue to boost exports, while solid domestic demand will pull in imports. Overall, we expect real net exports to be neutral to GDP growth in the near term.
Previous: $-49.0B Wells Fargo: -$48.6B Consensus: $-51.3B
Global Review
Global Outlook Remains Positive Amid Italy Turmoil
- It was a busy week in the global economy, with the Italian political and debt challenges taking center stage, a topic we explore in more detail on page 7.
- Outside of Italy, a slew of countries reported Q1 real GDP growth. Economic growth in Sweden, Switzerland and India topped expectations, while Canadian growth was a bit softer than expected.
- Eurozone inflation, which had softened over the past few months, showed some signs of a turnaround in May. A stronger inflation print provides European Central Bank hawks with a bit more ammunition headed into the critical June 14 meeting.
Global Outlook Remains Positive Amid Italy Turmoil
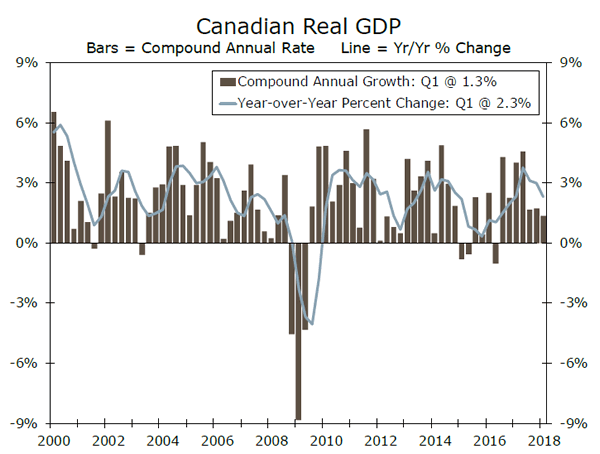
It was a busy week in the global economy, with the Italian political and debt challenges taking center stage, a topic we explore in more detail on page 7. Outside of Italy, a slew of countries reported first quarter GDP this past week. Starting with our neighbors to the north, Canadian GDP growth slowed to a 1.3 percent annualized pace in Q1, a continuation of the slowdown that began in H2-2017. Housing investment declined at a 7.2 percent annualized pace, subtracting 0.5 percentage points off of headline growth as the Canadian housing sector continues to roll over.
That said, the slowdown that has occurred over the past few quarters came on the heels of robust H1-2017 economic growth that helped drive 2017 full-year GDP growth in Canada to its fastest pace since 1998. We do not expect the Canadian economy to continue slowing, and it appears the Bank of Canada (BoC) is in agreement. At its meeting this week, the BoC remarked that first quarter economic activity "appears to have been a little stronger than expected," and cited more robust exports of goods, solid labor income growth and recovering investment as evidence for improving conditions. In our view, the statement adopted a moderately more hawkish stance, and potentially signals a faster pace of rate hikes than previously anticipated.
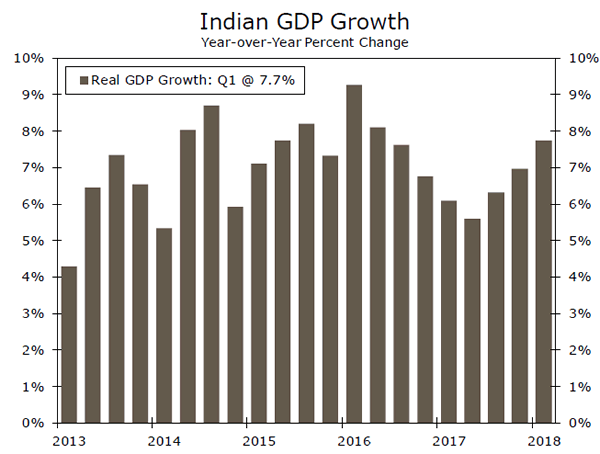
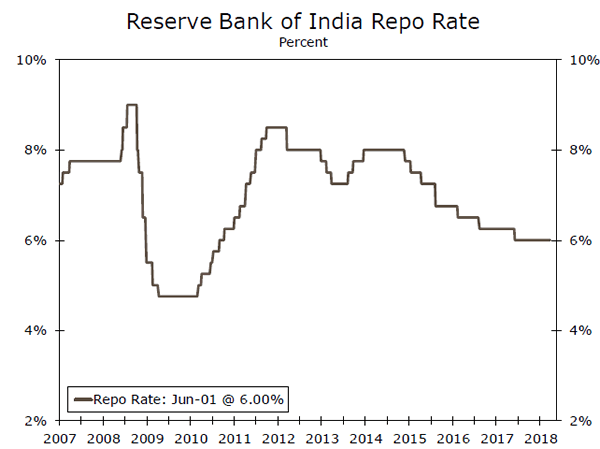
Elsewhere, India's economy accelerated for the third consecutive quarter, rising 7.7 percent year over year (middle chart). The data were supportive of our view that India's economy has turned the corner after an economic slowdown driven by structural reforms surrounding demonetization and the rollout of the goods and services tax. The Reserve Bank of India (RBI), which had been cutting its main policy rate over the 2015-2017 period to combat a slowdown in growth and inflation, has been on hold since last summer. With inflation in check and economic growth gaining momentum, the Reserve Bank of India seems content to assess the incoming data and let the recovery continue unperturbed.
In Europe, the Swiss economy strengthened further in Q1, with real GDP growing 2.2 percent year over year to surpass 2 percent for the first time since Q2-2016. The Swiss National Bank (SNB) probably does not want to get materially ahead of the European Central Bank's (ECB) monetary policy, and we look for the ECB to tighten at a gradual pace. This means that the SNB will likely remain on hold through the end of the year in light of only slowly rising inflation and a gradual pickup in consumer spending. Swedish GDP also surprised to the upside. With the gain, real GDP growth in Sweden continued its slow but steady climb higher on a year-over-year basis, eclipsing the 3 percent mark for the first time in nearly two years.
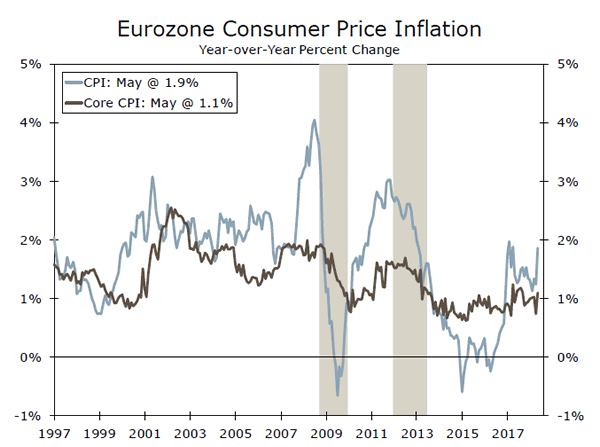
Finally, Eurozone inflation, which had softened over the past few months, showed some signs of a turnaround in May (bottom chart). Decelerating prices and softer economic growth in Q1 led some to wonder whether the European Central Bank would really end its asset purchases by year's end. While this week's inflation print is just one data point and political tensions continue to cloud the outlook, a stronger inflation print provides ECB hawks with a bit more ammunition headed into the critical June 14 meeting.
Global Outlook
Reserve Bank of India • Wednesday
The Reserve Bank of India (RBI) left its main repurchase rate unchanged at 6.00 percent at its April 5 meeting, citing stronger economic growth, yet moderating inflation as factors underpinning its decision. Economic growth in India has indeed strengthened, with data released this week showing that real GDP grew a strong 7.7 percent in Q1, with particular strength in investment spending and private consumption. In terms of prices, the RBI targets CPI inflation of 4 percent, and inflation has come down to 4.6 percent in April. But volatile food and energy prices along with the still-recent pickup in GDP growth have likely led the RBI to proceed with caution, compounded by concerns over rising global protectionism. The consensus looks for the RBI to again leave rates unchanged at next week's meeting, although the RBI has also cited a shrinking output gap and generally positive economic outlook that should be supportive of gradual rate hikes in the coming quarters.
Previous: 6.00% Consensus: 6.00%
Eurozone GDP • Thursday
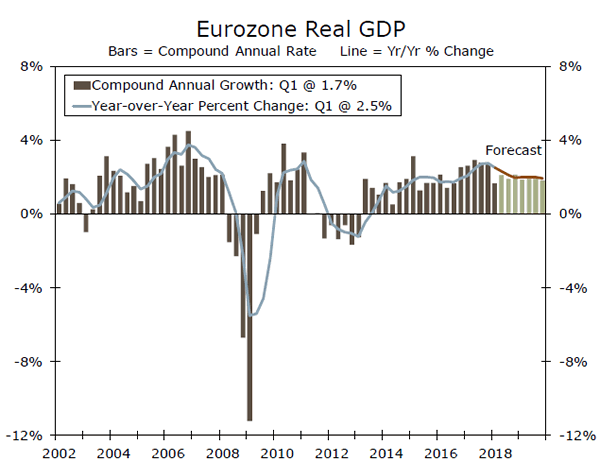
Real GDP in the Eurozone rose 0.4 percent in Q1's preliminary release, a slowdown from the 0.7 percent rate registered in Q4. Next week's release will include the final Q1 numbers along with demandside detail. Personal consumption likely slowed in Q1, as growth in real retail sales has been lackluster so far this year. Low CPI inflation has been a roadblock for the European Central Bank (ECB) on its path towards policy normalization, however inflation is beginning to show signs of upward momentum, rising 1.9 percent in May's preliminary release. Next week's GDP release will provide another welcome data point for the ECB, especially in light of recent political tensions in Italy and Spain. But in our view, it is too soon to make any reasonable judgement on the lasting effects of any political uncertainty. Economic growth in the Eurozone largely remains solid, and inflation should continue to pick up, giving the ECB time to continue its slow-and-steady approach to removing accommodation.
Previous: 0.4% Wells Fargo: 0.4% Consensus: 0.4% (Quarter-over-Quarter)
Chinese FX Reserves • Thursday
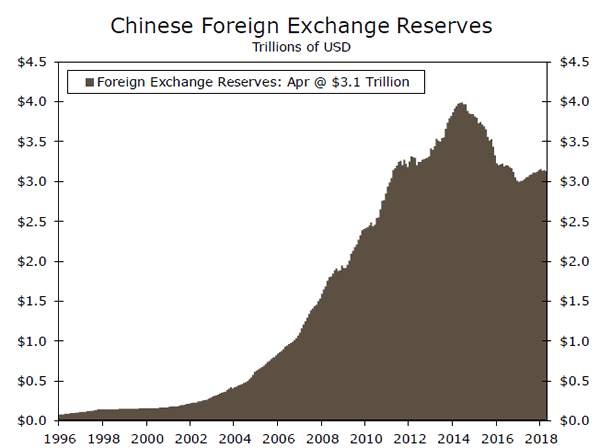
After building up its stockpile of foreign exchange (FX) reserves to nearly $4 trillion in 2015, the Chinese government has since bought its own currency and sold roughly $1 trillion in foreign currencies. This move came in an attempt to counteract downward pressure on the Chinese renminbi after the broader economy decelerated in 2015-2016 as the government reined in rampant credit growth. While China's FX reserves have since stabilized over the past year, currently at $3.1 trillion in April, more recent trade tensions between the U.S. and China are not without mentioning in terms of possible effects on China's monetary position. China is the largest foreign holder of U.S. Treasury securities, which are mainly held by the government to back its stockpile of FX reserves. Although we find it unlikely that recent trade uncertainty has had a material impact on China's Treasury purchases thus far, China's large stake in U.S. debt and relatively high level of FX reserves remain areas to watch.
Previous: $3.1 Trillion Consensus: $3.1 Trillion
Point of View
Interest Rate Watch
Benchmark Yields in an Above Average Length Economic Cycle
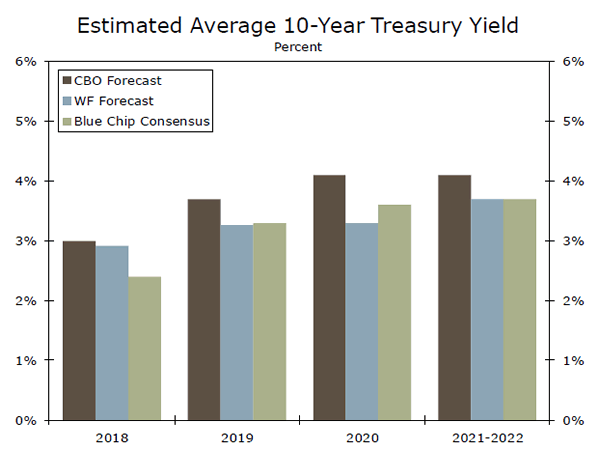
As illustrated in the top graph, our outlook is for a drift upward in the ten-year U.S. treasury benchmark yield. While modest by economic cyclical standards, the implications for both fiscal and monetary policy actions are significant. The future is not a repeat of the past.
Confluence to Conflict
For prior years of this economic cycle the confluence of modest growth and modest inflation meant a period of flat inflation expectations and a steady monetary policy of low interest rates.
However, we anticipate a period of conflict between tighter monetary policy and increased deficit financing. Monetary policy is expected to lean against the economic expansion by raising the funds rate as the unemployment rate persists below what the Fed anticipates is their full employment rate. Meanwhile, U.S. Treasury finance will support an expansionary fiscal policy. Our expectation is that the federal deficit will rise from $775 billion in FY 2018 to $1.1 trillion in 2019 while anticipating a higher deficit in the following years.
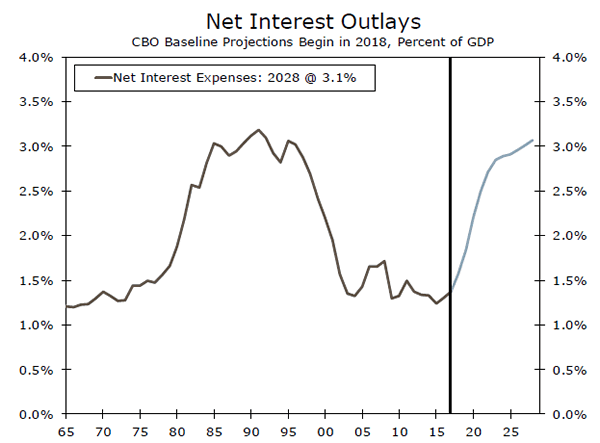
This conflict of tighter monetary policy and expansionary fiscal policy supports the case for higher interest rates and, unfortunately, rising net interest outlays in the federal budget (middle graph).
Of Course, This Is the Optimistic Case
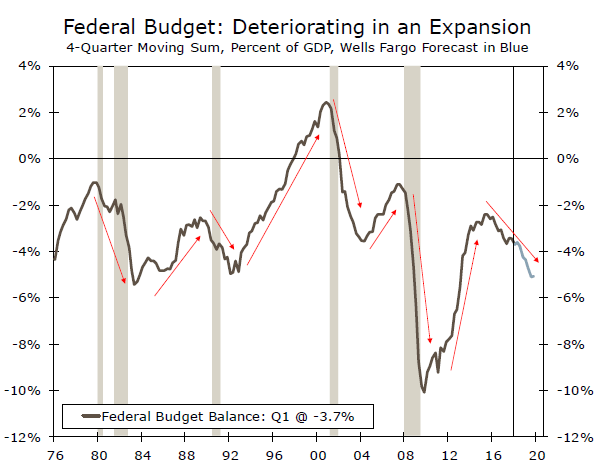
Sorry, that was the optimistic case. Submitted for your approval, consider the bottom figure. What is critical is the inconsistency of the budget outlook with the state of the economy. The budget deficit historically exhibits countercyclical behavior–as the expansion ages, the deficit shrinks (see mid-1980s, mid-1990s and even the last decade). But this expansion is different - even more so beginning in 2016. Our concerns are magnified given the policy conflicts we see and the additional non-zero possibility of a recession.
Unfortunately, recessions do not provide forward guidance on their appearance. In the short-run, the next six to nine months, we calculate the probability of recession as very low (<5 percent) but remain aware of the risks given the limited six-nine month horizon. For decision makers, the problem remains that policy conflict at this stage of the business cycle, compounded by unusual fiscal policy timing, raises the risk profile.
Credit Market Insights
Borrowing Costs Limit Refinancing
Rising interest rates are making refinancing increasingly less attractive for homeowners. The average rate on a 30-year mortgage was at a seven-year high of 4.86 percent during the week of May 18, and slipped to its second highest level of 4.84 percent last week.
Higher rates continued to negatively impact mortgage demand last week, as mortgage application volume declined for the sixth consecutive week. Higher rates appear to be weighing more on refinancing than purchases. Purchase applications also fell slightly but the notable weakness was in the more rate-sensitive refinancing volume.
The Mortgage Bankers Association's gauge of refinancing volume fell last week to its lowest point since 2000. Refinancing now accounts for the smallest share of mortgages since 2008. Higher mortgage rates can deter existing homeowners from refinancing to lower rates or cash out their equity.
Though purchase volume has been down in recent weeks, purchases have risen modestly over the year with home sales. Purchasing volume is somewhat less ratesensitive as sales are driven by stronger economic growth. Purchase volume has been more modest, however, as homebuyers are also facing an array of other challenges. Affordability is limiting options for many potential homebuyers, with home prices rising at the fastest pace since 2014. There is also a dearth of existing homes for sale. And high mortgage rates also make homeowners more hesitant to sell their current home and borrow for another at a higher rate.
Topic of the Week
Is the European Debt Crisis Back Again?
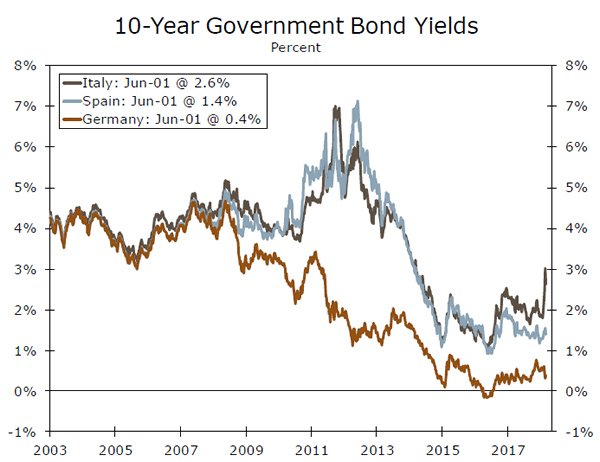
After three years of relative calm, volatility has returned to sovereign bond markets in the euro area due to political uncertainty in Italy and Spain (top chart). In a report published earlier this week, "Is the European Debt Crisis Rearing its Ugly Head Again?," we find that renewed fiscal largesse could lead to a vicious circle of larger fiscal deficits, higher borrowing costs and slower economic growth.
In Italy, political uncertainty, which has been building since the inconclusive general election on March 4, came to a head this week when the Lega Nord, which hails from the right of the political spectrum, joined forces with the Five Star Movement, which tends to support leftist policies, to form the next government. In Spain, Prime Minister Rajoy lost a confidence vote and will be succeeded by Pedro Sanchez, leader of the Socialist Party. The new government likely will be weak because the Socialists must rely on a number of regional parties to form a majority in parliament.
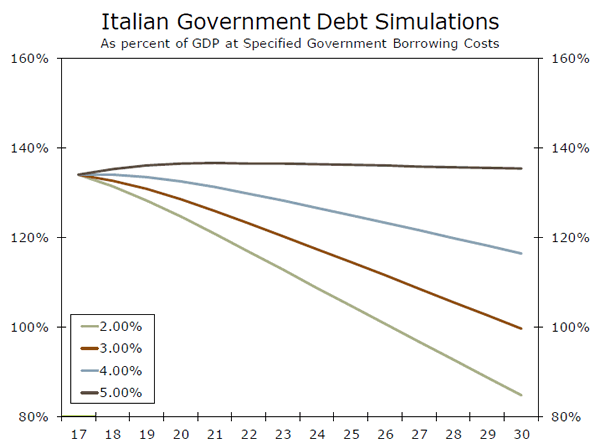
Although debt dynamics in Spain and Italy have largely stabilized since the last Greek debt crisis in 2015, we consider several combinations of nominal GDP growth rates and government borrowing costs that would be needed to stabilize the debt-to-GDP ratios of each country at their current levels (bottom chart). We find that Italy has little room to ease fiscal policy significantly, given that its nominal GDP growth has remained lackluster in recent years. Italy's government debt outstanding totals €2.3 trillion, and with its rank among the 10 largest world economies, a financial fire in Italy, should one start, may be difficult to extinguish. In Spain, stronger economic growth and a lower debt-to-GDP ratio gives its economy more room to accommodate fiscal changes, assuming current growth rates remain intact. Markets will be watching closely to see if the new governments in Italy and Spain enact policies that threaten debt sustainability in their respective economies. Stay tuned.
The Weekly Bottom Line: Nessun Dorma (No One Sleeps)
U.S. Highlights
- Fears of fresh elections in Italy spooked investors, who unloaded Italian bonds - sending yields on short-term government debt skyrocketing. By the end of the week, Italy's populist coalition was finally allowed to form a government. But far from closure, this likely marks the beginning of a new chapter that will test the Eurozone's stability.
- The U.S. turned up the heat on trade tensions by announcing that it would go ahead with tariffs on $50B of Chinese goods, and that it would end the exemption on steel and aluminum tariffs for Canada, Mexico and the EU.
By the end of the week, markets shrugged off the latest developments in - Europe and on trade, supported by a string of positive U.S. data - in particular, a very healthy May payrolls gain of 223k and wage growth that accelerated to 2.7% y/y. The latest data cement the case for a Fed rate hike at its June meeting.
Canadian Highlights
- The federal Liberal government announced its purchase of the Trans Mountain pipeline. Over time, this should improve the ability for Canada to export crude oil to international markets.
- Canadian economic activity expanded at a 1.3% pace in the first quarter, below trend but with solid underlying details.
- Although the Bank of Canada held rates this week, but set up the next rate hike for July. However, external developments, including U.S. tariffs on Canadian steel and aluminum, continue to pose material downside risk to Canadian outlook.
U.S. - Nessun Dorma (No One Sleeps)
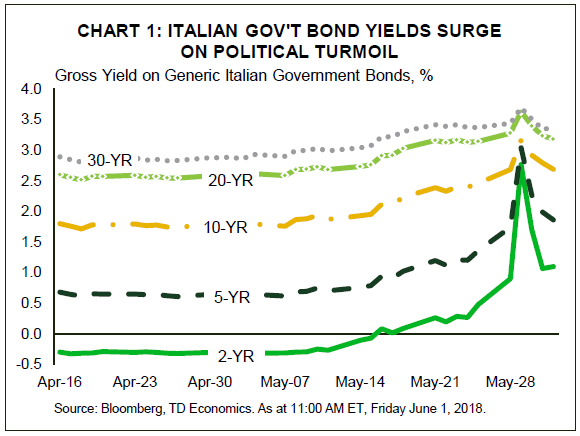
The theatrical twists and turns of this week's events are worthy on an opera, with the opening act set in Italy. Political turmoil and fears that new elections in Europe's fourth largest economy could strengthen the grip of Eurosceptic parties spooked investors, who began to unload Italian assets. This sent yields on short-term government debt skyrocketing (Chart 1). Investors also steered clear of other southern European debt, with short-term Spanish, Greek and Portuguese bonds also selling off. Concerns regarding new elections subsided as the week wore on, and these moves began to reverse course. By the end of the week the populist coalition was allowed to form a government. Still, the fact that the new Italian government - which favors tax cuts and spending increases - is likely to clash with the E.U. on a number of issues, suggests that this is merely a new chapter which may further tests the bloc's stability. The sheer size of Italy's economy - roughly ten times that of Greece - will warrant special attention.
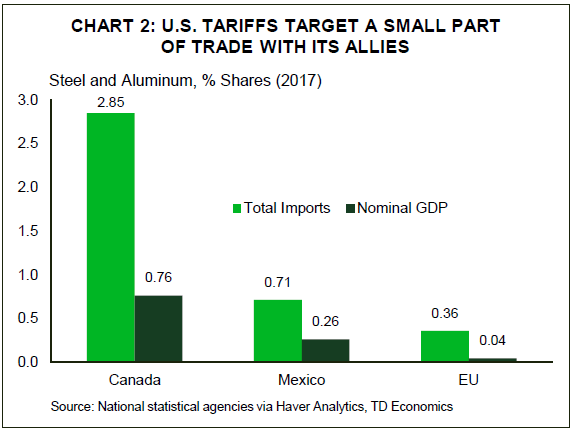
Markets were thrown another curve ball when the White House announced that it would be pushing ahead with tariffs on $50B of Chinese goods and end the exemption on steel and aluminum tariffs for the E.U., Canada and Mexico. These normally close allies pledged to challenge the tariffs through the WTO and NAFTA channels and levy retaliatory tariffs. At around $12.6B and $7.7B of U.S. products targeted by Canada and the E.U. respectively, and an estimated $4B in trade with Mexico, the amount of affected trade is still quite small. But the wide list of products marked for tariffs, which stretch from agricultural products to motorcycles, are sure to strike a sour cord with the U.S. Ultimately, the tariffs will make goods more expensive for the American consumer. In a prior analysis, in which we expected the exemptions for the allies to stay, we estimated that the tariffs would have a muted direct impact on U.S. economic activity and inflation. The recent events make us more confident that while the impact on U.S. economic activity is still expected to be limited, the tariffs are likely to boost consumer price inflation by at least 0.1 percentage points this year and next.
Behind the curtain of the unfolding Italian and trade sagas, U.S. economic data was broadly positive. American consumers were back in full force in April, with personal spending rising by a robust 0.4% in real terms, building on a solid March print. The back-to-back gains point to a 3.5% rebound in second quarter consumer spending after a soft first-quarter print (1% Q/Q ann.). This narrative is further reinforced by a strong labor market. In May, payrolls gains (223k) beat expectations, the unemployment rate fell to an 18-year low (3.8%) and wage growth accelerated to 2.7% y/y (Chart 2). Rounding out the good economic news was an above-consensus print in the ISM manufacturing index, which pointed to manufacturing activity accelerating in May.
The latest data cement the case for a Fed rate hike on June 13th. But this is no time to fall asleep, with further policy rate normalization also requiring a watchful eye on developments out of Europe and the potential fallout from heightened trade tensions. For now, Nessun Dorma.
Canada - One Step Forward, Two Steps Back
European politics dominated market moves in this last week of May that left many wondering if they should sell before they go away on summer vacation. Euro concerns returned with a vengeance, sending peripheral country yields shooting upward, and overshadowing some positive domestic developments. By week-end however, some calm was restored on the back of positive political developments in Italy and Spain.
The federal Liberal government announced plans this week to purchase the Trans Mountain pipeline from Kinder Morgan at a cost of $4.5 billion. Although opposition to the pipeline remains, construction is slated to begin this summer. Over time this development should improve the shipment of Canadian crude to international markets and help it fetch a better price.
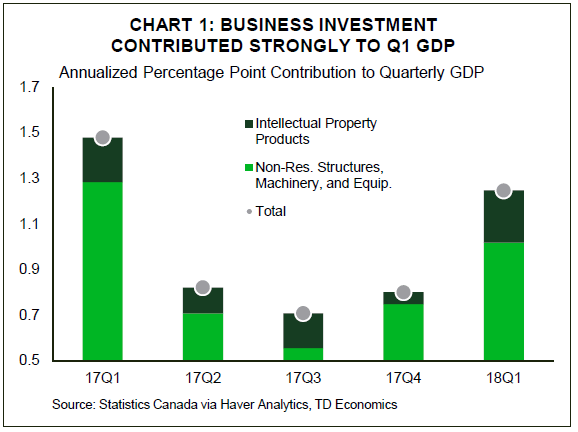
Statistics Canada reported this week that Canada's economy expanded at a 1.3% annualized pace in the first quarter. This was in line with the Bank of Canada's April MPR forecast, but was softer than the higher frequency data received over the past six weeks was suggesting. Overall, the underlying details of the first quarter report were solid. Business investment continued to climb, and household disposable income growth rose 3.7% (Chart 1). However, exports contributed little to output for the second consecutive quarter despite a firming in travel services.
As expected, the housing market exerted a material drag on economic activity in the first quarter. The B-20 mortgage guidelines that came into effect at the start of the year drove a resale activity decline of over 40% in the ensuing three month period. However, there are signs that the market is stabilizing, and a solid outlook for income growth is likely to see a gradual rebound in the housing market take hold later this year.
Given the continued strong performance of the Canadian economy, it's unsurprising that the Bank of Canada's monetary policy decision this week to leave interest rates unchanged carried a hawkish outlook. The economy is likely to grow at an above-trend 2.0% pace this year, eating up what little slack remains. As such, although headline inflation is likely to tick up a notch due to higher gas prices, trend measures of inflation should remain anchored near the midpoint of the Bank of Canada's 1-3% target. This should provide enough conviction for the Bank of Canada to raise interest rates by 25 basis points at its meeting in July, with two more likely next year.
That said, it's clear that global developments out of the Bank of Canada's control are being closely monitored. Volatile global financial markets have driven capital out from vulnerable emerging market economies, and any stresses in these regions could potentially spillover into trade partners. Moreover, yesterday's decision by the U.S. administration to go forth with steel and aluminum tariffs on Canada, Mexico, and the EU elevates the chance of a cold trade war turning hot. Although the direct economic impacts of the tariffs are estimated to be relatively small, the blow to confidence and the potential for supply chain disruptions could result in an outsized negative drag on economic activity in these regions (Chart 2). As a result, the Bank of Canada is likely to continue to maintain its gradual approach in removing stimulus.
Canada: Upcoming Key Economic Releases
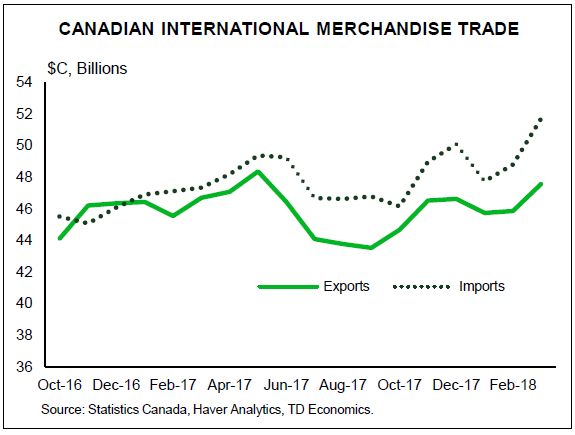
Canadian International Trade - April
Releases Date: June 6, 2018
Previous Result: -$4.1bn
TD Forecast: -$3.4bn
Consensus: N/A
We expect the international trade deficit to narrow to $3.4bn from $4.1bn in April, reflecting a pullback in imports following last month's blockbuster report. Exports should see little change as strength in energy products offsets a decline in aerospace, which contributed near a full percentage point to March export growth, and weak auto exports as presaged by advance US trade data. On the other side of the equation, imports should come under pressure as a number of outsized moves unwind. Motor vehicles and consumer goods are both prime candidates after they combined to contribute 3.2% to the advance in March imports. Looking ahead, we expect trade to make a positive contribution to GDP growth in Q2 after three quarters as a headwind to domestic demand.
Canadian Employment - May
Release Date: June 8, 2018
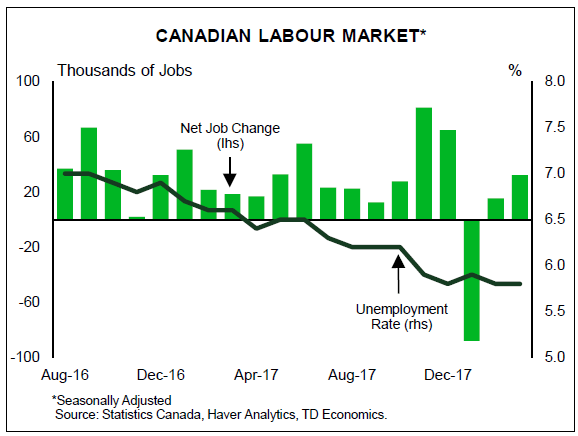
Previous Result: -1k, unemployment rate: 5.8%
TD Forecast: 8k, unemployment rate: 5.9%
Consensus: N/A
TD looks for the economy to add a relatively modest 8k jobs in May, roughly 10k below the six month trend, while a rebound in part-time employment should add to the downbeat tone. Full time job growth has outperformed part time by 160k over the last two months, leaving us biased towards a correction. Our base case is for unchanged wage growth but risks are tilted towards incremental gains on modest base effects. However, we will be on alert for any unexpected weakness after SEPH wage growth registered a sharp decline in March - while the two do not display a lagged relationship, a harmonized deceleration in wages would not go unnoticed by the Bank of Canada. After a pullback in labour force participation last month, we expect a partial rebound in May to drive the unemployment rate higher to 5.9%.
Week Ahead – Aussie in the Spotlight as Australian GDP and RBA Meeting Eyed
Trade figures will dominate next week’s calendar with a number of nations publishing monthly data, though they’re unlikely to attract as many headlines as US protectionism as trade risks appear to be on the rise again. The Australian dollar will be in focus for much of the week as the Reserve Bank of Australia holds a policy meeting and first quarter economic performance is examined. Canadian jobs numbers and GDP revisions in the Eurozone and Japan will also be watched, but it will be a quieter seven days for the UK and the US.
RBA meeting and GDP data pose a downside risk for the aussie
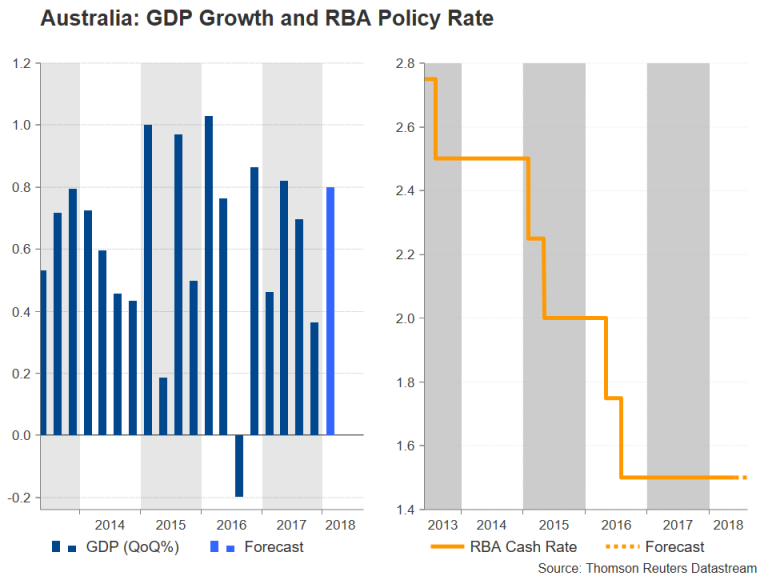
Disappointing quarterly capital expenditure figures out of Australia this week raised the prospect of GDP growth in the March quarter falling short of expectations when the data is released on Wednesday. Growth is forecast to have accelerated from 0.4% to 0.8% quarter-on-quarter in the three months to March. A GDP miss would only reaffirm expectations that the RBA will stay on hold for the foreseeable future. Ahead of the GDP release, there will be plenty of pointers for traders on what to expect as business inventories and net exports contribution for the first quarter are published on Monday and Tuesday, respectively. Other data to watch out of Australia are April retail sales on Monday and trade figures on Thursday.
Meanwhile, the RBA will almost certainly keep rates at a record low of 1.50% on Tuesday and maintain a neutral stance regardless of the data. However, if the growth numbers fail to meet expectations, the RBA could adopt more cautious language on the outlook for the rest of the year and that could trigger a sell off in the Australian dollar. After halting a 3-month downtrend in May, the aussie could head for fresh yearly lows versus the US dollar if the data fails to inspire traders.
There could be more volatility coming in the way of the aussie from Chinese data. China will publish trade numbers on Friday. Investors will be hoping for another healthy jump in annual export growth in May, following April’s 12.7% bounce, to appease concerns of moderating growth in the second quarter. Also out of China are producer and consumer prices on Saturday. China’s producer price index is seen by many as a good barometer for Chinese factory demand so an acceleration in the 12-month PPI rate would be positive for market sentiment.
Canadian jobs report looked at for July rate clues
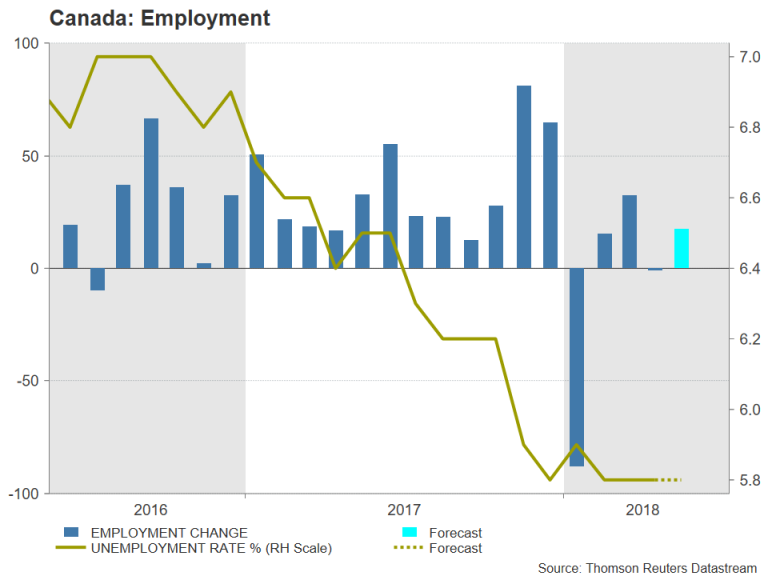
The Canadian dollar got a major boost after the Bank of Canada removed some of the more cautious language from its policy statement at the end of its meeting this week. Expectations of a July rate hike have shot up as a result and could firm further if incoming indicators surprise to the upside. The first batch of data are due on Wednesday, consisting of April building permits and trade figures as well as the Ivey PMI for May. The highlight for the loonie though will be Friday’s employment report. The Canadian economy is forecast to have added 17.4k jobs in May, while the unemployment rate is expected to stay at 5.8%. Solid job numbers on Friday would reinforce expectations of a July rate hike and could lift the loonie to below the C$1.29 level.
Japanese GDP could get revised up
The preliminary estimate of first quarter growth released earlier in May showed Japan ended two years of uninterrupted growth as the economy contracted by 0.6% on an annualized basis. The second estimate due on Friday is expected to see growth being revised up to 0.9%, extending the growth stretch to nine quarters. A marginal revision is unlikely to have a significant impact on monetary policy, however, and the Bank of Japan will probably be more interested in seeing a rebound in household spending and wages. Data on household spending in April is due on Tuesday, while the latest wage growth figures will be released on Wednesday. BoJ policymakers in Japan consider a pick-up in real wages to be an essential element in helping lift Japan out of a deflationary mindset.
UK PMIs and German industrial indicators to be the focus in Europe
Major data releases will be sparse on the European calendar next week, with UK PMIs and a set of German indicators likely to attract the most attention. In the UK, the Markit/CIPS construction PMI is up first on Monday and the services PMI is due next on Tuesday. A further rebound in services activity in May, following April’s bounce from a 20-month low, could be the catalyst the pound needs to make a more convincing recovery from this week’s 6-months lows against the dollar. The Markit/CIPS services PMI is forecast to rise from 52.8 to 53.1 in May.
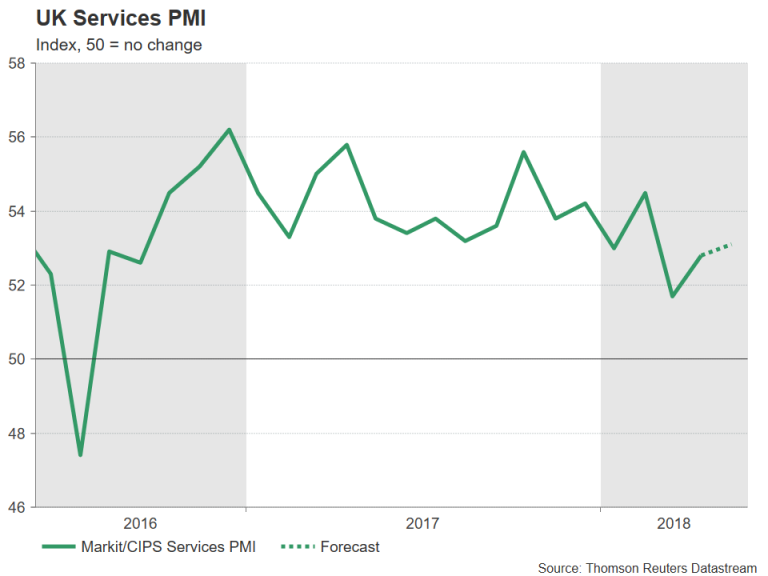
The Eurozone will also get PMI data, but having already seen the flash readings, next week’s final releases won’t generate much interest. More important will be the sentix index for June, due on Monday, retail sales for April on Tuesday and the third estimate of first quarter GDP growth on Thursday. No revision is expected to the 0.4% q/q figure of the prior estimate.
Investors will also be watching German figures on industrial orders, production and trade for evidence that the Eurozone’s largest economy is picking up speed in the second quarter. Industrial orders for April are due on Thursday, to be followed by industrial output and trade balance numbers on Friday. Industrial production jumped by 1% month-on-month in March after tumbling 1.7% in February. It is expected to recover further, by 0.2% m/m in April, which if confirmed, would point to a lacklustre start to the second quarter. Trade figures on Friday are unlikely to excite either. German exports are expected to have declined by 0.3% m/m in April. The euro would be at risk of reversing this week’s mini recovery if the data continue to surprise to the downside.
Quiet week for the US
Dollar traders shouldn’t expect to receive much direction from US indicators next week and Trump’s trade policy could once again become a bigger driver for the greenback, especially if the European Union and other countries that failed to get permanent exemption from the steel and aluminium tariffs proceed with announced retaliatory measures. In terms of data, it will be a relatively muted week, starting with April factory orders on Monday. The ISM non-manufacturing PMI on Tuesday will be the most important data to watch. The index measuring services activity is forecast to recover from April’s 4-month low, rising to 57.2 in May. A stronger reading could provide a further boost to the greenback, which managed to regain its positive footing against the Japanese yen after this week’s nonfarm payrolls beat. On Wednesday the trade balance for April will be the highlight. The US trade deficit is expected to widen to $50 billion in April, giving President Trump a stronger argument in his fight to cut the trade shortfall.
Australia & New Zealand Weekly: RBA on Hold Next Week; Balance of Rate Risks Not So Skewed to the...
Week beginning 4 June 2018
- RBA on hold next week; balance of rate risks not so skewed to the upside.
- Australia: RBA policy decision, GDP, retail sales, current account, trade balance.
- NZ: building work, Queen's Birthday.
- China: trade balance, foreign direct investment.
- Euro Area: GDP 3rd estimate.
- US: trade balance.
- Key economic & financial forecasts.
Information contained in this report current as at 1 June 2018.
RBA on Hold Next Week; Balance of Rate Risks Not So Skewed to the Upside
The Reserve Bank Board next meets on June 5. It is certain to leave the cash rate unchanged at 1.50%.
As usual the Governor's Statement will be of interest. However there were a number of developments in the Bank's communications that we saw last month in the Statement on Monetary Policy and the Board Minutes that did not appear in the much briefer Statement.
Of most interest to me was the comment in the minutes that "it was more likely that the next move in the cash rate would be up, rather than down". That comment also appeared in the April minutes and is now going to somewhat restrict the Bank's flexibility. If it leaves that comment out of future minutes the implication is likely to be that the Bank's forecasts have changed such that the balance of risks may have moved.
Recall that the RBNZ Governor on May 10 surprised markets by altering the previous rhetoric to, "The direction of our next move is equally balanced, up or down. Only time and events will tell".
The other interesting communication from the minutes was "members assessed that while this progress was unfolding it would be appropriate to hold the cash rate steady and for the Reserve Bank to be a source of stability and confidence".
This sounds as if the Bank now sees steady rates as a 'badge of honour' rather than having to defend steady rates in a world where central banks in other developed economies (US; Canada; UK) are raising rates.
Of course there was an interesting change in the Bank's forecasts which were released three days after the May 1 Board meeting. While the 2018; 2019; and 2020 (H1) forecasts for growth and inflation were unchanged from the February forecasts the Bank did push back the outlook for the labour market with the unemployment rate not reaching 5.25% until June 2019 rather than June 2018. It retained the view that the unemployment rate would stay at 5.25% until June 2020.
This is interesting given that on May 15 the Deputy Governor Debelle gave a speech where he identified a possible risk being that "it may take a lower unemployment rate than we currently expect to generate a sustained move higher than the 2% focal point evident in many wage outcomes today".
But the Bank's own forecast for the unemployment rate by mid-2020 is 5.25%. Most economists who analyse the Australian economy have assessed that Australia's full employment rate is around 5%. Evidence from labour markets such as the US and UK point to the full employment rate being lower in this global cycle than in previous cycles because of structural changes around low productivity growth; insecurity around technology; limited pricing power of employers; low inflationary expectations; globalisation and so on. So that supports the prospect that the RBA is overly optimistic around the wages outlook which then raises doubts about their confident rhetoric around eventually raising rates.
The Deputy Governor further links higher rates to wages by noting that "it is important to think about the environment in which interest rates would be rising. That environment is highly likely to be one where wages and household incomes are also growing faster than currently, improving the ability of households to afford higher mortgage payments".
Risks around household balance sheets cannot be under estimated. We understand that the Reserve Bank does not expect any negative wealth effects from falls in house prices. (On a six month annualised basis using CoreLogic data, Sydney is -6.3%; Melbourne -3.2%; Perth -1.1%). That is because the impact on consumption during the upswing period for house prices was considered to be muted. However that consumption weakness was at a time of weak income growth and we did see some fall in the savings rate in NSW and Victoria - the two states at the centre of the housing boom that were less exposed to income weakness. Consequently it is too soon to assume that a period of weakening house prices will not be associated with somewhat softer consumption than would normally be associated with the pace of income growth.
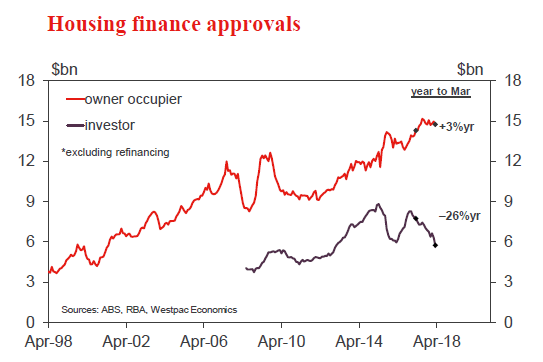
These negative prospects for the housing market are not only manifesting in price weakness but credit is also softening. In particular investors are responding to a number of headwinds – prospects for falling prices; likely tax changes if there is a change of government next year; tightening credit availability as banks are focussing on expenses and incomes of borrowers as well as controls on verifying existing debt; and shrinking rental yields, particularly in Sydney as rising land taxes bite on houses.
The chart below shows that new lending to investors has fallen by around 30% from the recent peak. We had a similar fall in 2016 but that reversed in the wake of the RBA's rate cuts in both May and August 2016. The Governor is clearly signalling that the next rate move has to be up. Consequently, we cannot be sure of the size and duration of this current correction to both prices and credit.
It is the accepted view that the evidence of the housing market's response to the 2016 rate cuts (a very strong revival of both prices and credit) sits as a lesson to the RBA that housing will always be highly responsive to lower rates. While never publicly stated, that really precludes any possibility that the RBA could move on rates if wages remain benign; a negative wealth effect emerges; residential construction slows; and the global environment disappoints, (we know the RBA is cautious about China; markets are signalling real concerns about emerging markets; and Europe has turned with the recent developments in Italy coupled with a clear slowing in the data).
However, the current conditions might be different. House prices are higher than in 2016; the banks' credit policies and procedures are tighter; political uncertainty is more acute; and global confidence may be easing.
Westpac's core view is rock solid that the cash rate will remain on hold in 2018 and 2019. However, the balance of risks seems less skewed to the upside than is currently indicated by the official view that the next move in rates is going to be up.
The week that was
'Economic developments have been overrun by political malaise' has become a familiar refrain this year. Before we discuss the implications, first we turn to the Australian data.
The big release was the Q1 CAPEX (capital expenditure) survey. Here we saw investment activity in the quarter come in between our and the market's expectations, with a 0.4% gain recorded. That the upside surprise came through in equipment spending (+2.5% against a flat expectation) meant that we revised up our forecast for Q1 GDP from 0.8% to 0.9%, leaving annual growth at 2.8%yr – broadly in line with trend/ potential growth. The survey also receives a lot of attention because it offers a view on investment over both the current and coming financial years. Estimate 6 for the current financial year to June 2018 now indicates that investment will be 3.8% higher than a year ago, slightly higher than estimate 5's projection of 2.5% three months ago. However, estimate 2 for the coming 2019 financial year was revised down a touch, from a gain of 3.5% three months ago to 1.4% now. We must caution that estimate 1 and 2 are typically inaccurate indicators of the final outcome, with services investment (in particular) often revised up through the year.
The other key Australian data release this week was April dwelling approvals. This outcome came in below expectations of a 3% fall at –5%, and the detail was also soft. As has been the case through this cycle, the headline result was determined by the pipeline of private unit approvals, which in the month fell 11.5%. The particularly volatile high rise sub category was down 20% in the month. By state, compared to a year ago, unit approvals are still up materially in Victoria (despite a sharp drop in April) but are down in NSW and Qld. Site purchase data implies that this downtrend will continue. Outside the unit market, medium-density approvals also fell 6% in April, and the trend for renovation approvals has also turned down. On housing, also note that the latest edition of Westpac Economic's Housing Pulse was released this week, covering the effect of macro and microprudential reforms on the market and the array of conditions across the states.
Then to China. This week saw the release of the official May PMI report. In contrast to many other major nations across the globe, this survey highlighted that manufacturing conditions improved in the month in China to the strongest level since September 2017, and before that July 2011. Though global momentum looks to have slowed marginally, external demand for Chinese manufactured goods strengthened in the month, as did domestic demand. It is likely that this is a peak for momentum overall; however, China will probably be able to sustain momentum better than most. So far in 2018, we have seen fixed asset investment recover from its 2017 lows, while growth in the consumer sector sustained a robust pace. This combination is not enough to stop aggregate growth slowing, but it will form a strong foundation for growth to remain near the level authorities are targeting for 2018 ("around 6.5%"). We are forecasting growth of 6.3% and 6.1% for China in 2018 and 2019, down from 6.9% in 2017.
Finally to Europe and the US. This week saw Italian bond yields surge (very briefly) to crisis levels on anxiety over whether the anti-establishment parties could form a coalition government. This 'crisis' had a lifespan of a day as a rearranging of ministerial duties within the coalition did enough to gain the President's approval. Whether this coalition proves capable of working together and being productive are entirely different matters for which only time will tell. As we end the week, tensions are now growing in Spain after reports Prime Minister Rajoy will lose a 'no confidence' motion against him, due Friday. This would see a caretaker government take over, led by the leader of an opposition party that only holds a quarter of the seats in parliament. This week's outcome in Italy and the likely result in Spain speak to the real concern for Europe: the continued absence of governments capable of reform. As the support to growth from surging consumer credit recedes, the absence of productivity and income growth will be felt all the more.
We now need to add another layer of uncertainty to the outlook. This is because, as their latest temporary exemption ran out, President Trump announced that the steel and aluminium tariffs already levied on countries like China will now also apply to Europe; Canada and Mexico. Europe will retaliate and this will likely see the US introduce yet more measures to 'assert its strength'. In addition to the aforementioned importance of productivity and income, the significance of external demand to the Euro Area growth story also cannot be understated. This is yet another cause to for caution over the Euro Area's prospects.
Chart of the week: European politics
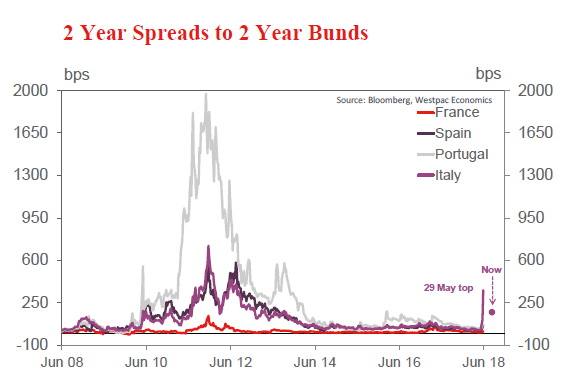
Yields on Italian 2 year bonds surged 190bps on Tuesday sparked by escalated political uncertainty.
After President Mattarella rejected the appointment of the 5-star and League party coalition's nomination of Savona as finance minister, concerns mounted that a government may not be formed and Italy would be heading for another general election.
By the next day, caution eased on prospects of the coalition being saved and on the following day, a new coalition was put forth and then approved by the President. Yields have moved back lower but remain higher than before.
As we go to press, attention turns to the vote of no-confidence in Spain scheduled to take place on Friday. The confirmation of the Basque National Party's position against Rajoy has incrementally tipped the scales against the incumbent Prime Minister.
New Zealand: week ahead & data wrap
Wait for it
The Reserve Bank has held fire for now on any changes to its restrictions on bank mortgage lending. We still think that the case for an easing of the restrictions will be made by the end of this year, as a range of government policies weigh on house prices. A softer housing market will also have a bearing on the wider economy, where confidence in the outlook is already fragile.
This week the Reserve Bank released its six-monthly Financial Stability Report, a wide-ranging review of New Zealand's financial system. The overall conclusion was that the risks to the system were little changed from six months ago, with the main areas of concern being household debt, dairy sector debt and exposure to international shocks.
The main area of interest for us was whether there would be any further changes to the macro-prudential restrictions on housing lending. In the last review in November, the RBNZ loosened the loanto- value ratio (LVR) restrictions slightly, allowing investors to borrow up to 65% of the value of a house, and increasing the share of loans to owner-occupiers that can be made at an LVR above 80%.
The RBNZ also indicated that it would ease the restrictions further if it was satisfied that house price and credit growth had slowed to around the rate of household income growth, and that there was a low risk of the housing market taking off again. It's a close call as to whether those conditions have been met. House prices are up 3.8% in the last year, while credit growth is running at 5.7%yr. Comparable figures for household income growth aren't yet available, but last year it was running just above 5%.
In the event, the RBNZ decided against any changes to the LVR restrictions for now. However, it appeared more conservative than before on the prospect of an easing, noting concerns about the high level of household debt (rather than just the rate of growth). It was also notably less specific about the conditions for easing: "if housing market risks decline and banks maintain prudent mortgage lending standards".
Despite the imprecision of these criteria, we still think that the conditions for an easing of the LVR restrictions will be met before the end of this year. The Government is introducing a series of new policies aimed at cooling investor demand for housing, one of which is already in play: the extension of the 'bright line' test for taxation of capital gains came into effect at the end of March. Later this year a ban on foreign purchases of residential property will come into force, and the Government has signalled that the use of negative gearing by property investors will start to be phased out from next year.
Together, we think that these policies will have a significant impact on housing demand over the coming years. We expect annual house price growth to slow to zero by the end of this year, in contrast to the RBNZ's assumption of low but positive house price growth. The April house price and sales figures already showed some signs of softening, and we expect that the accumulated evidence over the next six months will satisfy the RBNZ's concerns.
We should note that we don't expect the LVR restrictions to be removed altogether. The RBNZ, under successive Governors, has made it clear that lending restrictions are likely to be part of the landscape. Instead, the RBNZ will look to move from the current 'tight' settings to something closer to neutral. 'Neutral' in this instance is hard to define, but it implies a set of lending restrictions that are not particularly binding at the time, but would guard against a future loosening of bank lending standards.
The consequences of the LVR restrictions extend beyond the stability of the financial sector. Housing makes up a significant part of household wealth in New Zealand, and consumer spending tends to wax and wane in line with house price inflation. The cooling in the housing market over the last year and a half has also seen a slowdown in the rate of growth in consumer spending, and we expect both house prices and spending to remain subdued in coming years.
The latest business confidence survey suggests that retailers are already feeling the pinch. Confidence has been weak since last year's election, and has taken another step lower in the last two months, with retailers feeling particularly downbeat in May. And as we've noted previously, card spending and car sales were markedly weaker in April.
House price inflation also has a bearing on the incentives to build. Confidence in the construction sector has been particularly weak in recent months, although it picked up a little in the May survey. There is clearly a need for an extended period of strong homebuilding activity, and the Government's KiwiBuild programme provides an additional source of demand for affordable homes. But skill shortages, thin profit margins, rising costs and difficulties in accessing finance present significant constraints on growth.
That said, the latest data suggests that the homebuilding industry has made some progress. Building consents held up surprisingly well in April, down by just 3.7% after a 13% rise in March. Consents for multiples (apartments and townhouses) in Auckland have been particularly strong in the last two months.
Multiple consents are lumpy by nature, and two months of gains are not enough to establish whether the trend has changed. Nevertheless, the recent numbers are impressive given that the aforementioned constraints would seem to be most pressing for large developments in Auckland. For now, we're sticking with our forecast that actual building work will pick up only gradually this year (March quarter figures are released next week; we expect a 0.5% rise).
Data Previews
Aus Apr retail trade
- Jun 4, Last: flat, WBC f/c: 0.2%
- Mkt f/c: 0.3%, Range: -0.1% to 0.7%
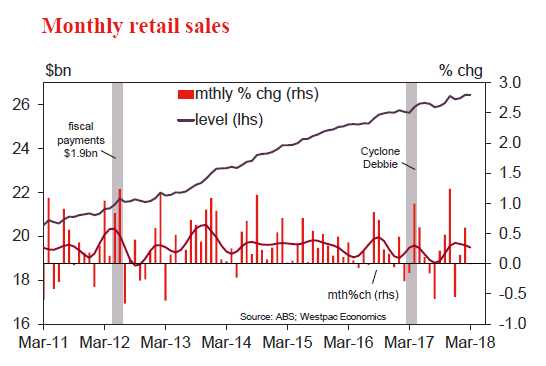
After a positive start to 2018 retailers have struggled again in recent months with sales stalling flat in March and the wash-up from Q1 showing more of the gains have been due to firmer prices with volume growth disappointing, especially for non food retail.
The softer tone is set to carry into April judging by weak retail responses to private sector business surveys. We expect sales to post an insipid 0.2% gain in the month, likely taking trend growth to a sub-2% annual pace.
Note that the wider consumer spending estimates to be published in the March quarter national accounts will be firmer than recent retail reads. Business surveys show much stronger conditions in other consumer related sectors (i.e. services) and consumer sentiment has held in slight positive territory. However, exactly how much of the weakness in retail is a sector specific issue remains an open question.
Aus Q1 company profits
- Jun 4, Last: 2.2%, WBC f/c: 3.0%
- Mkt f/c: 3.0%, Range: 1.5% to 4.0%
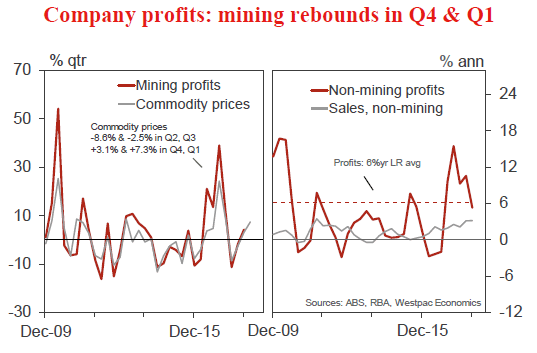
Commodity price fluctuations remain a key profit driver, a dynamic evident over late 2017 and early in 2018.
In Q4 company profits grew by 2.2%, including a 4.2% increase for the mining sector on higher commodity prices and a 1.2% increase in profits across the broader economy.
For Q1, we anticipate a 3% rise in profits.
Mining profits likely posted a strong gain, up a forecast 8%, on higher prices and a lift in export shipments.
Non-mining profits are expected to continue their uptrend, +0.5%, on increased turnover, as well as positive spill-over effects from the mining sector.
Aus Q1 inventories
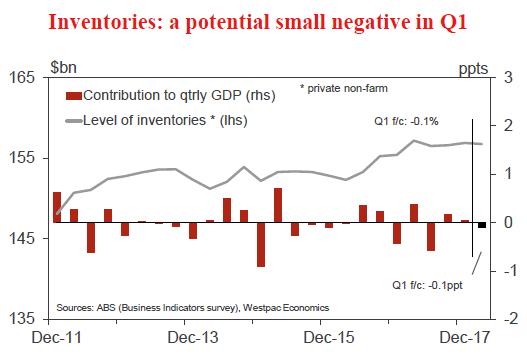
- Jun 4, Last: 0.2%, WBC f/c: -0.1% (-0.1ppts)
- Mkt f/c: 0.0%, Range: -1.0% to 0.5%
Inventories, after a period of rebuilding in 2016, increased only modestly in 2017, up 0.5% (on an ex mining basis).
In Q4, total inventories expanded by 0.2%, driven entirely by a jump in mining, while ex-mining declined by 0.2%.
For Q1, we expect total inventories to edge lower, declining by 0.1% centred on a reversal in the mining sector. This would see inventories subtract 0.1ppts from activity in Q1.
Recently, mining inventories have tended to alternate between a period of unintended build-up, due to temporary delays, (as in Q4) and a period of draw-down, to meet export shipments, (as in Q1).
Non-mining inventories are expected to increase gradually to meet rising demand, up a forecast 0.2%qtr.
As always with inventories, we note the elevated uncertainty.
Aus Q1 net exports, ppts cont'n
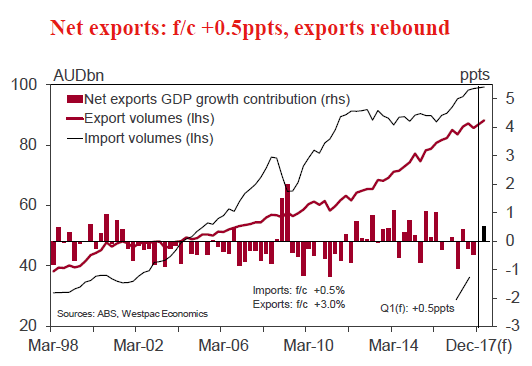
- Jun 5, Last: -0.5, WBC f/c: +0.5
- Mkt f/c: 0.5, Range: 0.2 to 0.7
Net exports, as with inventories, have been volatile of late largely due to a choppy export profile as supply disruptions impact shipments (notably for coal).
In Q4, export shipments recorded a surprise decline, at odds with the current uptrend, declining by 1.8%. This, along with a 0.5% rise in imports, saw net exports subtract a hefty 0.5ppts from activity in the period.
A reversal is evident in Q1, with net exports forecast to add 0.5ppts to activity.
Exports advanced in Q1, increasing by a forecast 3%qtr, 5.6%yr, with a strong lift in resources (across coal, LNG, gold, as well as metals and iron ore) and gains in manufactured goods and services.
Imports are forecast to rise by around 0.5%, 4%yr in Q1, with a rebound in both capital goods and gold.
Aus Q1 current account, AUDbn
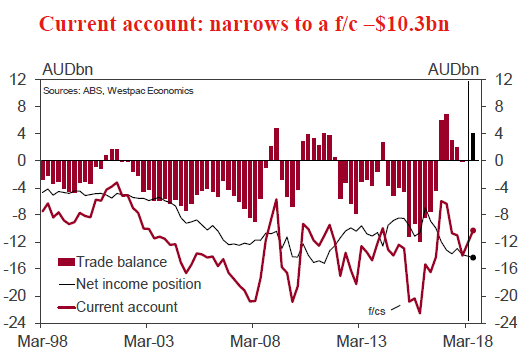
- Jun 5, Last: -14.0, WBC f/c: -10.3
- Mkt f/c: -9.9, Range: -12.7 to -7.4
Australia's current account deficit widened in the December quarter, to $14.0bn from $11.0bn. This was largely as the trade surplus evaporated (from +$2.0bn to -$0.1bn).
In the March quarter, the current account position improved, fully reversing the Q1 deterioration, with the deficit narrowing to a forecast $10.3bn.
The trade position returned to surplus in Q1, to the tune of $4.0bn, a turnaround from a revised deficit of $1.0bn for Q4.
Export earnings rose by around 7½%, boosted by higher commodity prices. The import bill grew by a more modest 2%, including a lift in prices. The terms of trade lifted by an estimated 2.6%, after a 1% decline in Q4.
The net income deficit is expected to widen a little, to $14.3bn from $13.9bn, on rising returns to foreign investors.
Aus Q1 public demand
- Jun 5, Last: 1.1%, WBC f/c: 1.0%
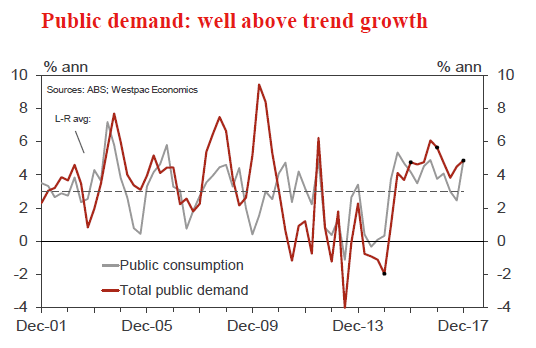
Public demand is a key growth driver, expanding at a well above trend pace in 2015, 2016 and 2017, with annual growth at 4.8%, 5.6% and 4.9%, respectively. Momentum is set to extend in to 2018 and beyond.
An upswing in public investment is underway, lifting from recent lows, as governments commit to additional projects (particularly transport infrastructure) now that earlier fiscal pressures have receded. In addition, spending on health is increasing at a robust pace, including on the NDIS.
In Q4, public demand increased by 1.1%, led by a sharp rise in consumption (which accounts for 80% of total public demand), up 1.7%, only partially offset by a modest pullback in the often volatile investment segment, -1.3%.
For Q1, we expect public demand to expand by 1.0% on higher investment, +3%, as well as a modest gain in consumption, +0.5%.
Aus Jun RBA decision
- Jun 5, Last: 1.50% WBC f/c: 1.50%
- Mkt f/c: 1.50%, Range: 1.50% to 1.50%
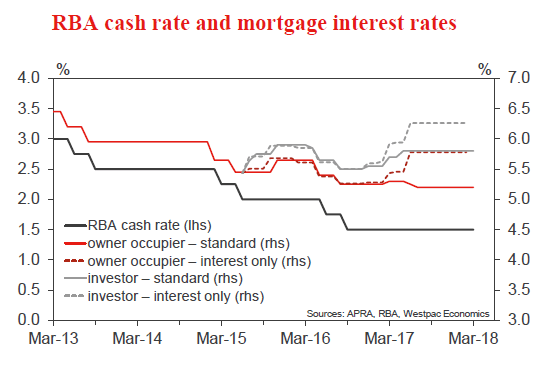
The RBA will hold rates unchanged at their June meeting, as they have since they last cut rates in August 2016.
The Governor has stated that: "further progress in reducing unemployment and having inflation return to target is expected, although this progress is likely to be gradual".
The case for patience has been reinforced by recent labour market updates, with unemployment stuck around 5.5%, and wages, which remain sluggish thereby constraining consumer spending.
Moreover, tighter lending standards have been helpful in containing the build-up of risk in household balance sheets. This has seen a cooling of the housing sector, which is a headwind for the economy.
We continue to expect the RBA to leave the cash rate unchanged at 1.50% throughout 2018 and 2019.
Aus Q1 GDP
- Jun 6, Last: 0.4%qtr, 2.4%yr; WBC f/c: 0.9%qtr, 2.8%yr
- Mkt f/c: 0.8%, Range: 0.2% to 1.2%
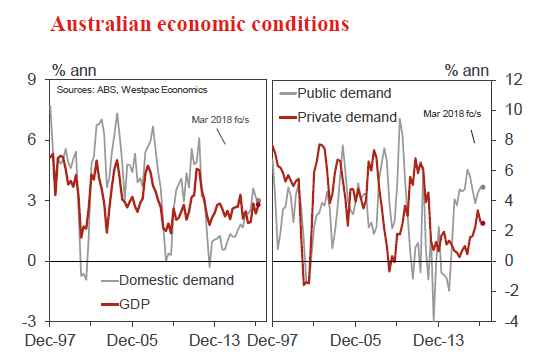
Real GDP grew by a forecast 0.9%qtr, 2.8%yr in Q1, an improvement on a Q4 result of 0.4%qtr, 2.4%yr.
The key swing factor is net exports, which add a forecast 0.5ppts, a turnaround from a -0.5ppts impact. Exports resumed their uptrend, f/c +3%, after a temporary dip, -1.8%.
Domestic demand grew by a forecast 0.6%, matching the Q4 result, while inventories are expected to subtract 0.1ppts from activity in Q1.
Consumer spend likely slowed (0.6% after a 1.0%) on a softer wage income result. More supportive are home building (+1.0% after a -1.3%) and business investment (+0.5% following a -1.0%). Public demand growth most likely remained above trend, at a forecast 1.0%, with investment in an upswing and health spending on the rise.
See our preview bulletin for further details.
Aus Apr trade balance, AUDbn
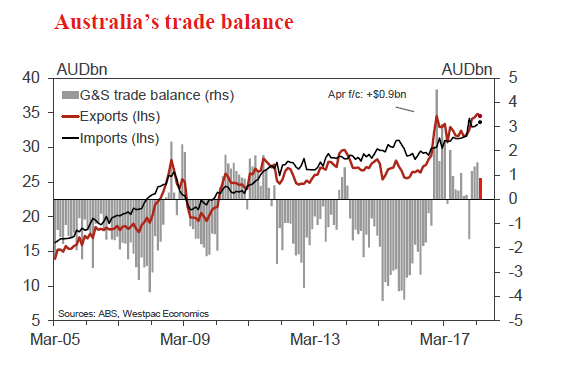
- Jun 7, Last: 1.5, WBC f/c: 0.9
- Mkt f/c: 1.0, Range: 0.4 to 1.8
Australia's trade account was in surplus in the opening quarter of 2018, supported by a lift in commodity prices and rising export shipments.
For April, we anticipate another trade surplus, albeit narrowing from $1.5bn to $0.9bn.
The import bill is expected to increase by 1%, +$0.3bn, on higher prices (notably for oil) and a lift in volumes.
Export earnings are expected to moderate in the month, down a forecast 0.9%, -$0.3bn. LNG is a likely plus, on higher prices and volumes, but we expect this to be more than offset by falls across coal (price and volumes), iron ore (prices), as well as gold and rural (coming off a high base).
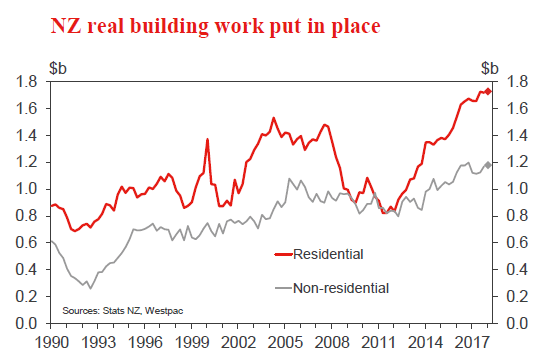
NZ Q1 building work put in place
- Jun 6, Last: +1.4%, Westpac f/c: +0.5%
Construction activity continued to trend higher in late 2017, with gains in both residential and non-residential building activity. Looking forward, we expect that the level of activity will remain elevated for an extended period, with a large amount of residential and infrastructure work planned over the coming years. However, after an extended period of strong activity, capacity in the building sector has become stretched. In addition, difficulties accessing finance and nervousness about policies that will dampen house price growth are providing a brake on building activity. As a result, we expect only a 0.5% rise in construction through the March quarter, with only modest gains in both residential and non-residential work expected.
Weekly Focus: Turmoil Returns to the Euro Area
Market movers ahead
- Italian politics will remain in focus, even after the reaching of a coalition deal this week. Attention is set to be on any comments on policy priorities, particularly whether we will see the toning down of some of the spending proposals.
- This week showed an escalation of the trade conflict between the US, EU and China. We will be looking for signs of a further escalation in coming weeks.
- In the UK, we expect services PMI to rise but Brexit will remain in focus ahead of the EU summit in late June.
- In the Scandi area, we do not believe Nationalbanken intervened in the currency market in May, despite the Danish kroner strengthening against the euro. We expect the modest increase in Norwegian house prices to continue.
Global macro and market themes
- The euro area is hit from multiple directions – not least the Italian crisis and US tariffs.
- A declining business cycle and the outlook for ECB tapering are also weighing on the euro area.
- Uncertainty continues to be high in Italy and we see downside risks to equities and the euro in the short term.
- However, our baseline is that we do not enter a new euro debt crisis or Italian euro exit and we see equities higher on a 12-month horizon.
Three for Three: Hiring and Wages Up, Unemployment Down
Hiring picked up in May, with employers adding 223,0o0 new jobs. Wage growth also improved (+0.3 percent) while unemployment now matches the lowest rate since 1969. The Fed is clear for another hike this month.
From Strength to Strength
Nonfarm payrolls rose by 223,000 in May, above consensus expectations. Over the past six months, job gains have averaged 202,000 per month and continue to indicate no cooling in the trend.
Payroll growth looks increasingly broad across industries. The diffusion index—a measure of the net share of industries adding jobs—improved to 67.6 in May and has been trending up. Notable strength was seen in construction, manufacturing, education & health, professional & business services and retail.
New Cycle Low in Unemployment; Participation Still Concerning
Solid hiring in recent months helped to push the unemployment rate down to 3.8 percent in May. That matches the low of the 1991-2001 expansion. Other indicators of labor market slack also point to an increasingly tight labor market. U-6 unemployment, which includes workers marginally attached to the labor force and part-time workers who want full-time hours, fell to 7.6 percent last month, marking the lowest level since 2001.
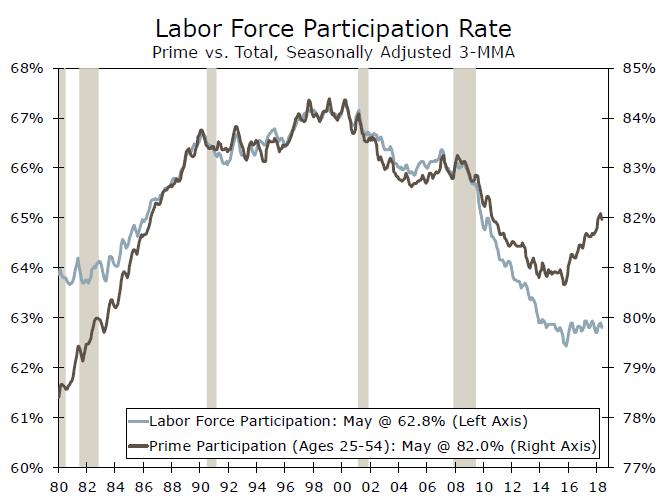
With unemployment rates signaling labor has become increasingly scarce, a rebound in labor force participation—particularly prime-age participation— has become all the more important. Although prime participation has recouped significant ground over the past two years, it ticked down for a third straight month in May, and a full recovery from the Great Recession for this group remains some ways off, as structural hurdles like mobility persist.
Wages and Income Improve, Fed Clear for Rate Hike this Month
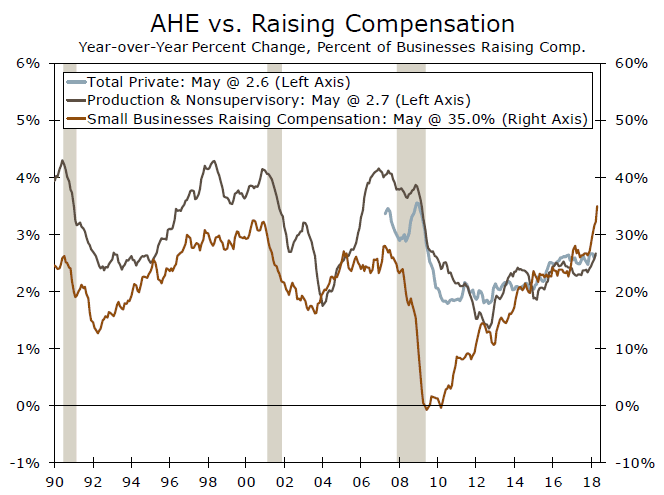
Rising wages should at least provide a near-term tailwind to luring more workers back into the labor force. Average hourly earnings rose 0.3 percent in May, helped by a 1.4 percent jump in the financial services industry. The year-over-year rate improved to 2.7 percent.
As we have often mentioned, the subdued pace of earnings growth this cycle reflects low productivity growth and inflation. Yet, as cyclical pressures mount and labor becomes increasingly scarce, we expect to see further strengthening in average hourly earnings. Other indicators are also pointing to compensation picking up. The Employment Cost Index was up 2.7 percent year over year through the first quarter, compared to 2.5 percent for 2017, while the share of small businesses raising compensation in May rose to 35 percent—the highest rate in the NFIB survey's 32-year history.
Factoring in the workers added to payrolls and now earning a paycheck this month, the income proxy—total hours worked multiplied by average hourly earnings—has improved to a 5.4 percent annualized pace over the past three months, compared to 3.3 percent at the start of the year.
Stronger earnings and the continued solid pace of job gains keep the FOMC in the clear for a rate hike later this month despite renewed concerns about the European debt crisis and global trade relations.
U.S. May Unemployment Rate Matches the Lowest Level Since 1969
Highlights:
- May payroll employment rose 223K which was up from the 159k increase in April (164k previously) and market expectations going into the report of 190k increase.
- Unexpected strength in labour markets was also conveyed by the unemployment rate dropping to 3.8% from 3.9% in April. Expectations had been for this rate to hold steady in May after dropping a marked 0.2 percentage points in April from 4.1% in March.
- The annual increase in wages rose to 2.7% from the 2.6% in April. This rate was anticipated to hold steady at the April level.
Our Take:
Today’s May employment report showed the unemployment rate unexpectedly dropping even further to 3.8% after a marked 0.2 percentage point drop in April to 3.9% and matches the lowest unemployment rate since 1969. As well, it moves this rate even further beyond the Fed’s estimate of a long-run equilibrium rate of 4.3% to 4.7%. Indications of labour markets operating beyond capacity were reinforced by the annual increase in wages rising to 2.7% from 2.6% in April and a 2017 average increase of 2.5%. This data provides support to this week’s beige book report that indicated inflation pressures building in the system though indicated that the pressure from wages was more modest relative to that emerging from material costs. The increase in payroll employment was surprisingly strong rising 223k up from the 159K increase in April. Our expectation is that with labour markets operating beyond capacity average employment gains going forward are likely to moderate back down to the April level reflecting a tightening supply of workers. The week’s beige book report highlighted anecdotal reports of firms having increasing difficulty “filling positions across skill levels.”
Sunset Market Commentary
Markets:
Today, markets put aside the negative news headlines from early this week. The installation of an anti-establishment government in Italy, a no confidence vote removing Spanish PM Rajoy from power and US president Trump imposing import tariffs on steel and aluminum from Mexico, Canada and the EU all weren’t able to stop the risk rebound. Bunds and treasuries declined further. Spreads on Italian BTP also eased further. So, markets went into the US payrolls with a positive risk sentiment. After a disappointing April report, US payrolls were really strong. (223 000), the unemployment rate declined to the lowest level since 2000 (3.8%) and wage growth was also slightly higher than expected. At the time of writing, US yields are rising about 5 bps across the curve with the very long end outperforming (30y + 3 bps). However, part of the rise in yields had already occurred before the US payrolls release. German yields also extended their post-Italy corrective rise. The curve bear steepens with the 2-y up 2.8bp and 30-y rising 5.3 bps. Intra-EMU spreads over Germany narrowed further with 10-y Italy narrowing 19 bps. Portuguese, Spanish and Greek spreads respectively decline 15, 14 and 12 basis points. A constructive end to a difficult week.
The price swings in EUR/USD were modest today, especially taking into account the substantial moves in most other markets. EUR/USD traded in the upper half of the 1.16 big figure during the European morning session. The pair tried to regain the 1.17 level around noon, propelled by a further in easing Italy-driven stress on other (European) markets. However, the pair failed to really attack yesterday’s top. The US payrolls gave a small boost to the dollar, but also this move wasn’t able to break a first ST support area. Improving sentiment on Europe and strong payrolls for now kept each other in balance. EUR/USD trades currently in the 1.1675 area. The gain in USD/JPY was more significant as the pair profited from higher core yields and from a constructive risk sentiment. USD/JPY trades currently in the 109.65 area.
Sterling took a cautious start to today’s trading session. EUR/GBP tried to regain the 0.88 mark this morning. This was mainly a euro move as tensions on Italy eased further. The UK manufacturing PMI improved from 53.9 to 54.4 (53.5 was expected). However, the rebound was modest given the protracted decline since end last year. The details were mixed, too. Sterling gains immediately after the release were modest, but the UK currency finally gained some traction, both against the euro and the dollar. We see it in the first place as a correction on recent sterling weakness. EUR/GBP trades currently in the 0.8765 area. Cable rebounded to the 1.33 area.
News Headlines:
As expected, the Spanish prime minister Mariano Rajoy lost a vote of no-confidence with a small majority of 180 out of 350. He will be replaced by the Socialist opposition leader Pedro Sánchez. Sánchez could stay in power until 2020, but is likely to call new elections.
US-data surprised on the upside today. ISM manufacturing came in higher than expected (58.7 vs. 58.2 expected), reversing a modest roll-over since February. Payrolls were also better than anticipated with 223k additional jobs vs. a 190k consensus. The unemployment rate dropped further from 3.9% in April to 3.8% in May, whereas labor force participation edged lower to 62.7%. Average hourly earnings also topped expectations and rose 2.7% YoY.
A top aide to Kim Jong Un was en route to Washington Friday to hand a letter from the North Korean leader to President Donald Trump, Secretary of State Mike Pompeo said after reporting "good progress" in talks between the two sides to revive an on-again, off-again nuclear summit. (BB)
USD/CHF Mid-Day Outlook
Daily Pivots: (S1) 0.9823; (P) 0.9862; (R1) 0.9899; More...
USD/CHF failed to sustain below trend line support and recovered. Intraday bias is turned neutral again. On the upside, break of 0.9982 will indicate that pull back from 1.0056 has completed and bring retest of this resistance. However, on the downside, break of 0.9825 will indicate that fall from 1.0056 is a larger scale correction. In such case, deeper decline would be seen back to 0.9724 fibonacci level before completion.
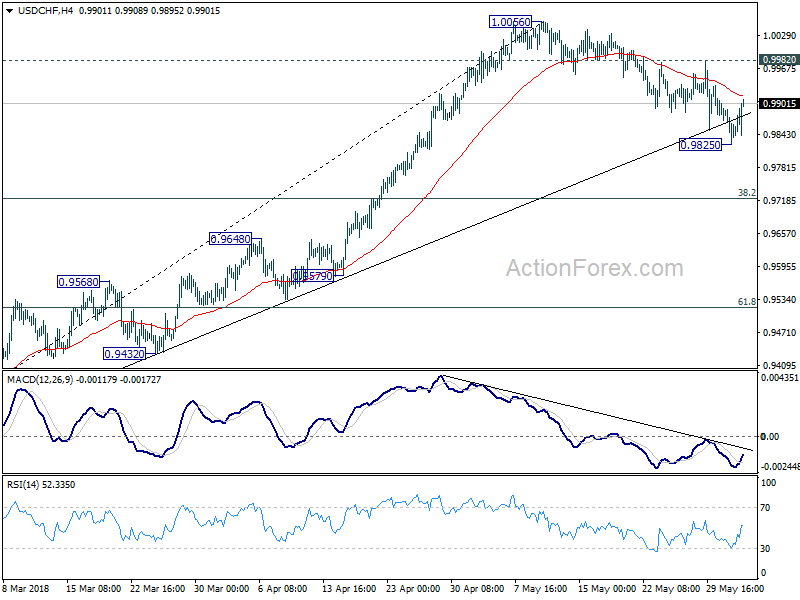
In the bigger picture, medium term decline from 1.0342 has completed with three waves down to 0.9186. Rise from there is currently viewed as a leg inside the long term range pattern. Hence, while further rally would be seen, we'd be cautious on strong resistance from 1.0342 to limit upside. For now, further rise is expected as long as 38.2% retracement of 0.9186 to 1.0056 at 0.9724 holds.