

Sample Category Title
EUR/AUD Weekly Outlook
EUR/AUD's decline accelerated to as low as 1.5652 last week. Downside acceleration raised the chance of medium term reversal. Initial bias remains on the downside this week for 1.5621 key support next. On the upside, break of 1.5774 support turned resistance is needed to be first sign of short term bottoming. Otherwise, deeper will still be in favor in case of recovery.
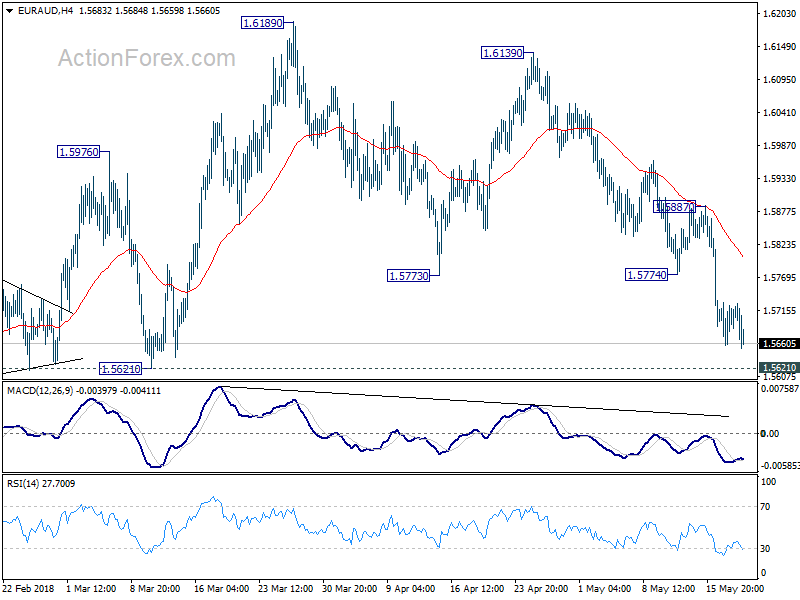
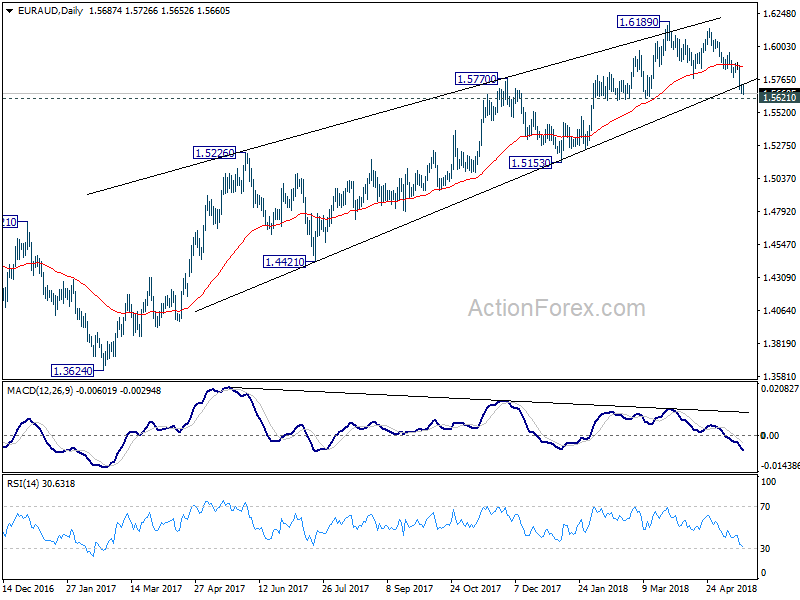
In the bigger picture, considering bearish divergence condition in daily MACD, even if rise from 1.3624 (2017 low) extends, upside should b limited by 1.6587 key resistance (2015 high) to bring reversal. Meanwhile, sustained break of 1.5621 support should confirm reversal and turn outlook bearish for 1.5153 support and below.
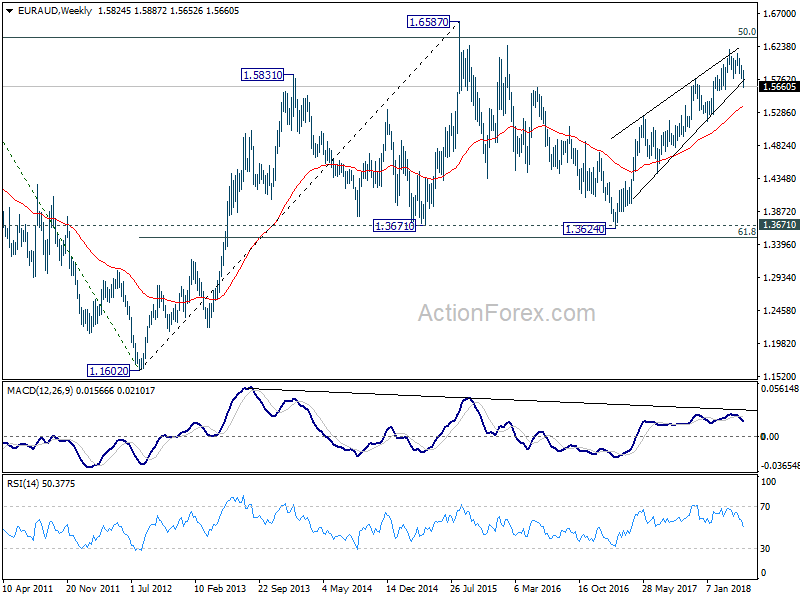
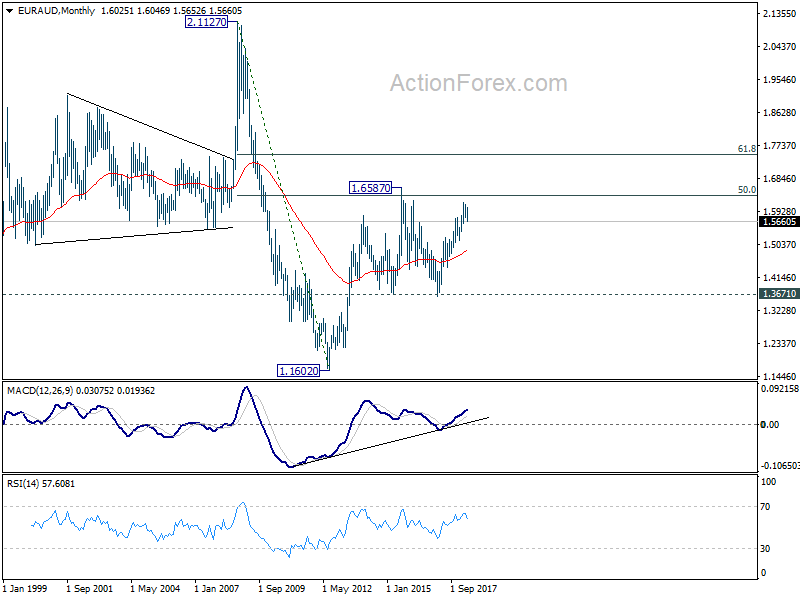
In the longer term picture, the rise from 1.1602 long term bottom (2012 low) isn't over yet. We'll keep monitoring the development but there is prospect of extending the rise to 61.8% retracement of 2.1127 to 1.1602 at 1.7488 and above. However, sustained trading below 1.3671 should indicate long term reversal and target 1.1602 long term bottom again.
EUR/CHF Weekly Outlook
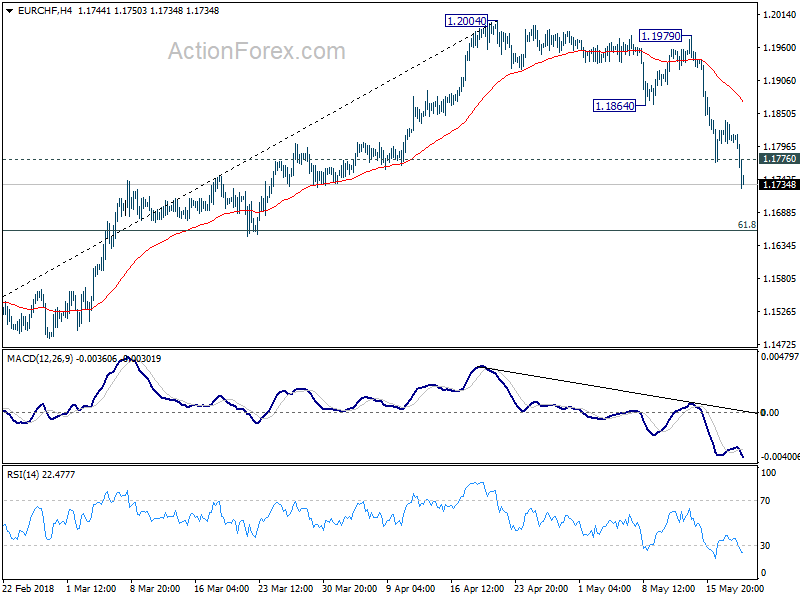
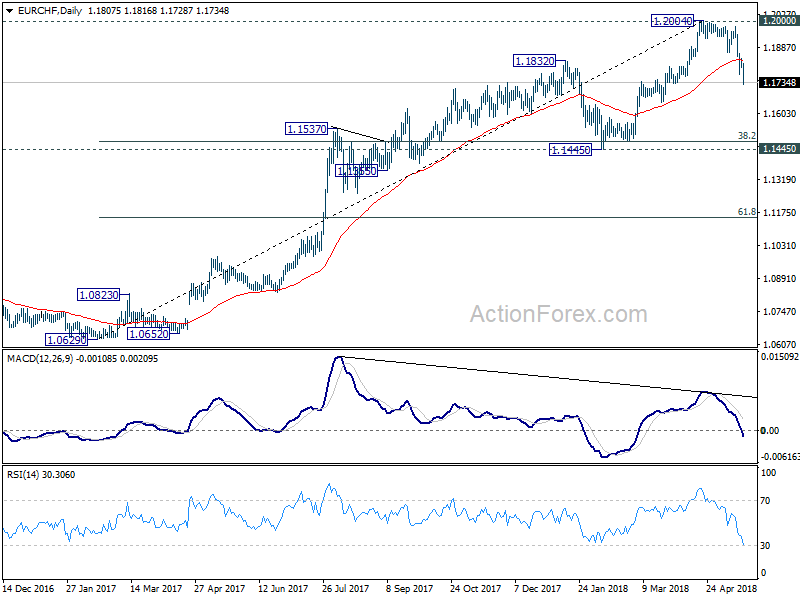
EUR/CHF dropped sharply to as low as 1.1728 last week as the decline from 1.2004 resumed and accelerated. The development further confirmed rejection by 1.2 key resistance. Initial bias stays on the downside this week for 61.8% retracement of 1.1445 to 1.2004 at 1.1659. Sustained break will target key support level at 1.1445. On the upside, above 1.1776 minor resistance will turn bias neutral first. But near term outlook will remain bearish as long as 1.1864 support turned resistance holds.
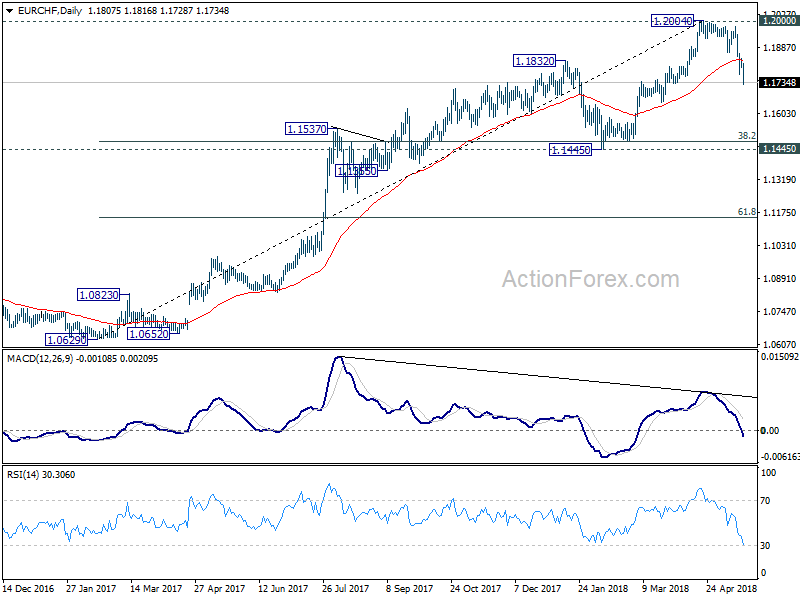
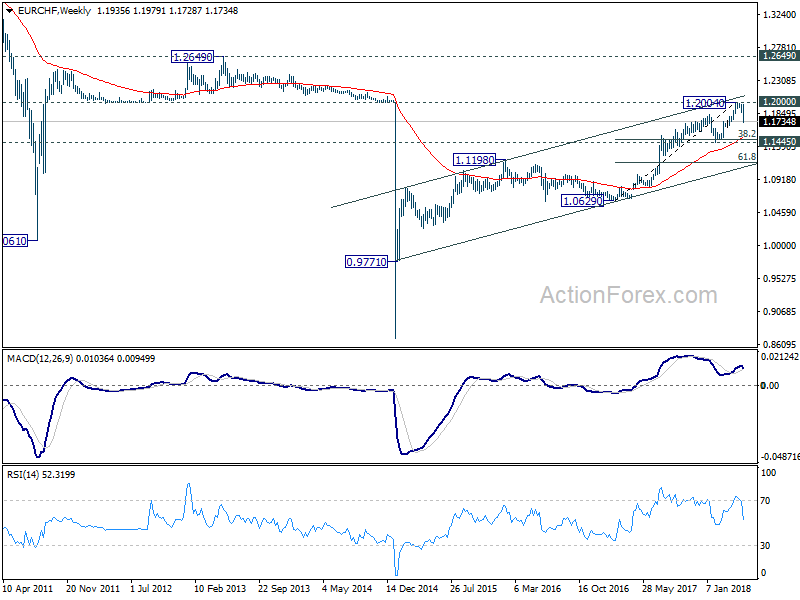
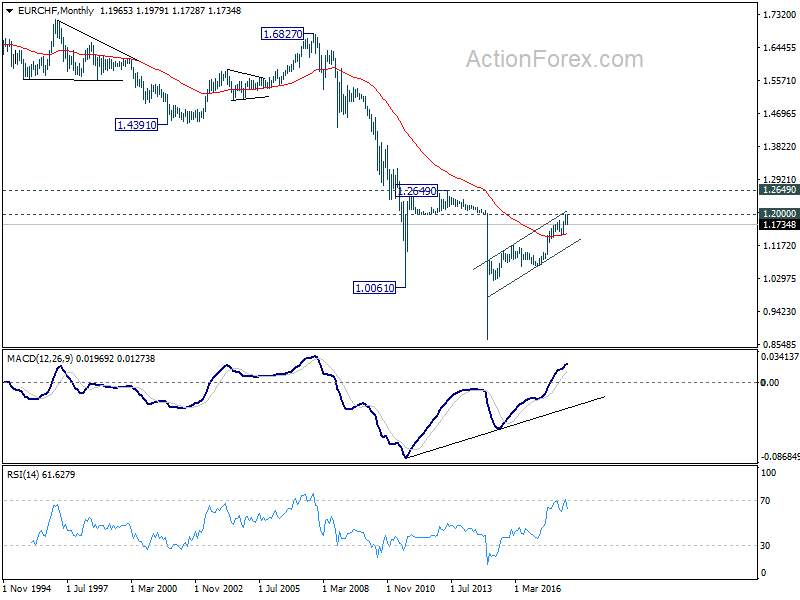
In the bigger picture, current development suggests solid rejection by prior SNB imposed floor at 1.2000. Considering bearish divergence condition in daily MACD, 1.2004 could be a medium term top. And price action from 1.2004 is correcting the up trend from 1.0629. Hence, for now, deeper fall could be seen back to 1.1445, which is close to 38.2% retracement of 1.0629 to 1.2004 at 1.1479. We'd expect strong support from there to bring rebound to extend the medium term corrective pattern.
Dollar Rally Limited by a Number of Political Factors, Swiss Franc Ended as Strongest
Swiss Franc ended last week as the strongest one, very much thanks to the selloff in EUR/CHF. Uncertainty over the EU policy of the new Italian government sent Euro broadly lower, which ended as the weakest. Despite surge in 10 year yield to 7-year high, Dollar could only extend recent rally against Euro and Yen. The greenback, admittedly, ended as the second strongest one. But a number of political factors are limiting the greenback's strength despite firm expectation of rate path. Dollar is seen as in consolidation mode as we suggested last week, despite the rise against Euro and yen.
Euro weighed down by Eurosceptic new Italian government
Euro ended as the weakest one last week, partly due to formation of the anti-EU coalition government in Italy. Two populist parties finally agreed on a deal to form a coalition government. The anti-establishment 5-Star movement and the far-right League signed the "Contratto Per Il Governo Del Cambiamento" or "Contract for the Government of Change". The joint program will be put to vote by 5-Star and League members. After approval, it will be presented to Italian President Sergio Mattarella. A government could be formed as early as next week.
There are notable common grounds between the two parties. Firstly, the both promote loose fiscal policies. It's clearly said in the accord that "the government's actions will target a programme of public debt reduction not through revenue based on taxes and austerity, policies that have not achieved their goal, but rather through increased GDP by the revival of internal demand." That means, they are highly unlikely to stick to EU fiscal discipline.
Secondly, both are Eurosceptics. There is no call to quit Eurozone in the accord. And they instead push for review of EU governance and fiscal rules first. Thirdly, both agree to harsher stance on immigration, and "Italian First" principle in terms of trades. All these attributes would very likely bring Italy to clash with EU and Eurozone ahead, and drag down the EU level reforms pushed by German Chancellor Angel Merkel and French President Emmanuel Macron.
ECB policy path is another uncertainty
Additionally, bear in mind that ECB has already shown some concerns on the slowdown in Eurozone in Q1. So far, there is no solid sign of pickup in Q2 yet. Adding to political uncertainty in Italy, it's getting harder for ECB to make a decision on fate of the asset purchase program by June meeting. And if the upcoming data, like this week's PMIs, don't offer any silver-lining, ECB will more likely extend the asset purchase program beyond September. And a rate hike will be pushed further down the road.
EUR/CHF finally gave up 1.2
Finally, the steep selloff in EUR/CHF, losing -198 pips or -1.66% over the week, confirmed rejection from the key 1.2 handle. Remember that it's the prior floor imposed by SNB before they gave up back in 2014. This level is proven too much psychologically for Swiss Franc bears. The rejection now open up a medium term correction that could extend to 1.5 handle. And the weakness in EUR/CHF going forward will likely weigh on Euro elsewhere.
Dollar rose without conviction, despite surge in yield
While Dollar ended up against all major currencies last week except Swiss Franc, its strength was not that apparent. The greenback only closed above prior week's high against Euro and Yen. There is no change in our view in last weekly report that Dollar has turned into consolidation phase. The fact that EUR/USD fell was mainly due to Euro's own problems. And only USD/JPY was taken up by the rally in treasury yields. We're talking about 10 year yield having the largest weekly rise in a month. And, it broke key resistance level to 7-year high. But, Dollar was held in range against Sterling, Swiss Franc, Australian and Canadian Dollar.
Tension between Trump and EU is set to intensify
Fed is on course for another hike in June, and at least one more within the year. There is no change in such expectation. But the US, under the leadership of Trump, is having problems on many fronts. The pull out from Iran nuclear deal triggered strong reactions from EU. The latter showed unity in a summit in Bulgaria on the commitment to the JCPoA Iran deal. And they got unanimous backing from state members to trigger four countering measures to the US sanctions on Iran, they could affect EU companies. That includes reactivating Block Statue, a 1996 law to forbid EU companies from complying with any US sanctions on Iran. And there were strong words from EU officials complaining Trump. Considering EU is only getting temporary exemptions from the US steel and aluminum tariffs till June 1, the tensions between US and EU will more likely intensify then not.
Kim-Trump summit on June 12 is now unsure
Then, US relationship with North Korea had an about turn last week as the latter threatened to cancel the Trump-Kim Summit on June 12. North Korea was infuriated by Trump's national security adviser John Bolton's proposal of Libyan style of denuclearization. North Korea's vice-foreign minister Kim Kye-gwan condemned that "it is essentially a manifestation of awfully sinister move to impose on our dignified state the destiny of Libya or Iraq which had been collapsed due to yielding the whole of their countries to big powers."
Later, Trump warned on Friday that Libyan model "the model, if you look at that model with Gaddafi, that was a total decimation. We went in there to beat him. Now that model would take place if we don't make a deal, most likely." It should noted that a year after Libya's Muammar Gaddafi agreed to give up nuclear weapons in 2003, he was killed by Western-backed rebels. So far, nobody knows whether the June 12 summit will actually happen.
China-US trade talk resulted in words but no action
US-China trade negotiation resumed last week with Chinese Vice Premier Liu He and the delegates' visit to Washington. It's reported by Reuters and Bloomberg that a Trump administration official leaked the information that China is offering US a USD 200b cut in annual trade surplus with the latter. But the Chinese Ministry of Commerce was quick to come out and deny it. And so far there were just words, without anything solid. Trump's chief economic advisor Larry Kudlow said the negotiations "are going well". And, "China's come to trade, they're meeting many of our demands." But, "there's no deal yet, to be sure, and it's going to probably take a while. It's a process. But they're coming to play. I believe they want to make a deal." The uncertainty on US-China trade relationship will drag on for more time.
Update: US and China issued a joint statement on Sat to conclude the trade talks. Here it is: US-China joint statement vowing not to launch a trade war
Lighthizer poured cold water on NAFTA after missing May 17 deadline
NAFTA negotiation passed the May 17 deadline without making any breakthrough. The new agreement, if there is any, is unlikely to be approved by the current Congress. There could be a new wave of uncertainty after the mid-term elections. In addition, Mexican presidential election on on July 1 is also quickly approaching. Canadian Prime Minister Justin Trudeau sounded optimistic that he was "positive". Mexico's economy minister Ildefonso Guajardo also said a deal could be reached by the end of May. But US Trade Representative Robert Lighthizer poured cold water and said "the NAFTA countries are nowhere near close to a deal" with "gaping differences" on a number of issues.
All theses factors limit Dollar's rally attempt. In particular, after a long stretched rally that started back in mid April, the greenback need some time to digest recent moves.
10 year yield now in most important resistance zone in years
US 10 year yield surged to as high as 3.115 last week, taking out 3.036 key resistance (2013 high) decisively. For now, near term outlook will stay bullish as long as 2.911 support holds. TNX should target 100% projection of 1.336 to 2.621 from 2.034 at 3.318 next. With this bullish development, USD/JPY would be the one that benefits most. For other Dollar pairs, they'll have to show some commitment to break from last week's range first.
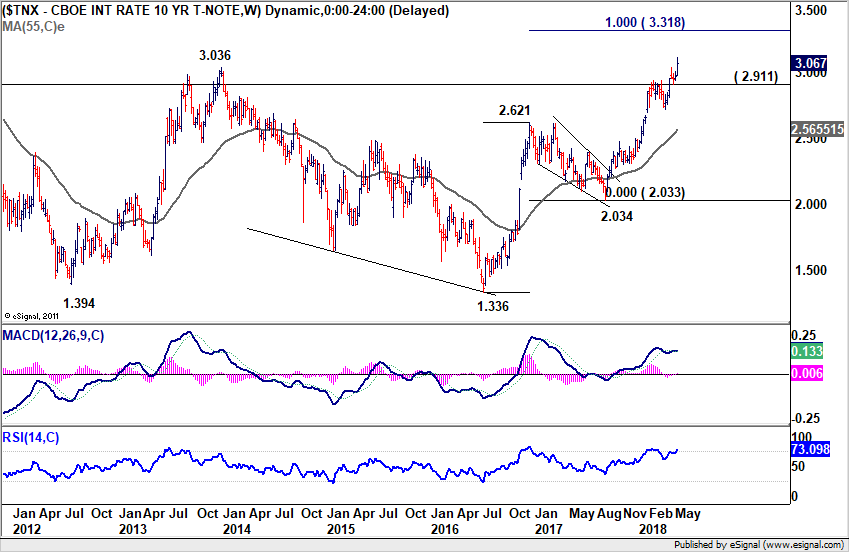
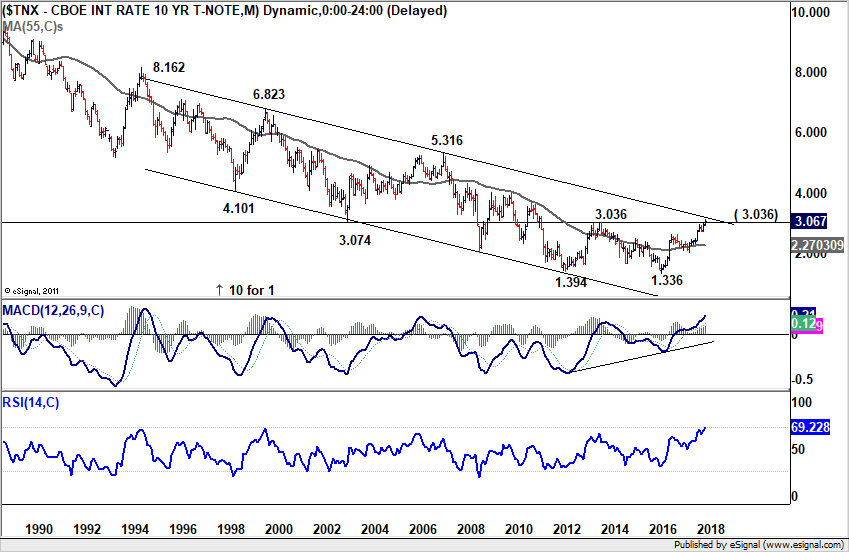
We'd like to point out that TNX is now the most important resistance zone that's seen for years. 2013 high at 3.036 marks the start of the zone. On the upside, it's the multi-decade trend line resistance at around 3.20. Sustained break of this resistance zone will confirm reversal of this multi-decade trend, with a double bottom pattern (1.394, 1.336) in the monthly chart. That would mark the end of an era of persistently falling US yields.
Dollar index surged thanks to Euro and Yen
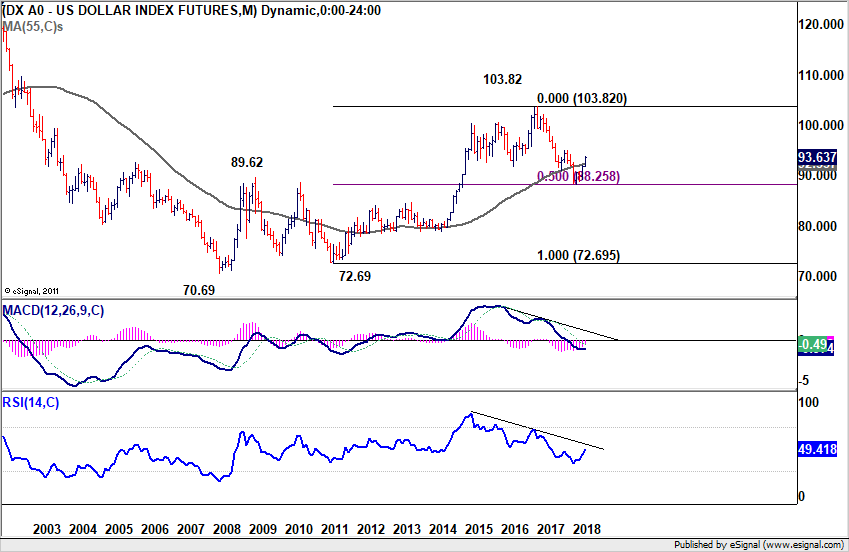
Dollar index's rally extended last week, thanks to weakness in Euro and Yen. Rebound from 88.25 is on course for 38.2% retracement of 103.82 to 88.25 at 94.19. We'll see if there is any loss of momentum as the index approaches this level. But outlook will remain bullish as long as 92.24 support holds, even in case of retreat.
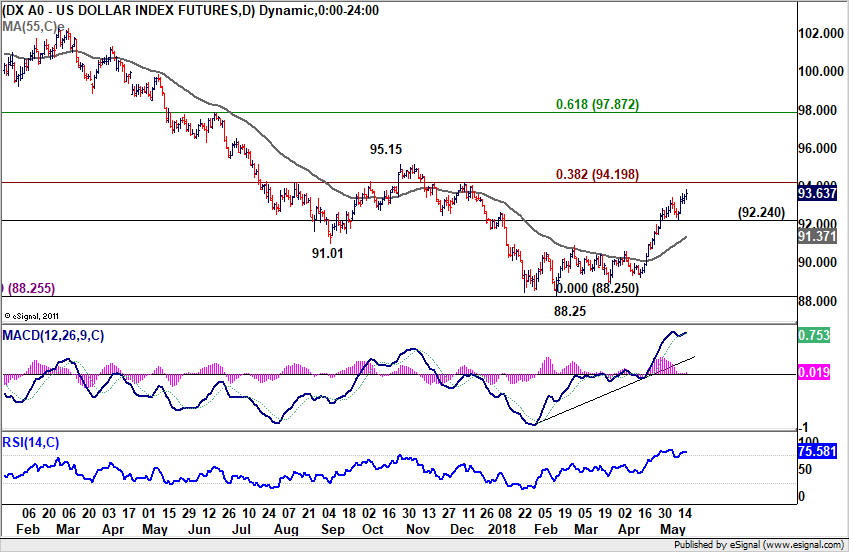
Also, we'd reiterate the the case of medium term trend reversal continued to build up. That is, fall from 2017 high at 103.82 is likely completed at 88.25 after, drawing support from 38.2% retracement of 72.69 to 103.82 at 88.25. Sustained break of 94.19 should at least send dollar index through 61.8% retracement of 103.82 to 88.25 at 97.87.
EUR/USD Weekly Outlook
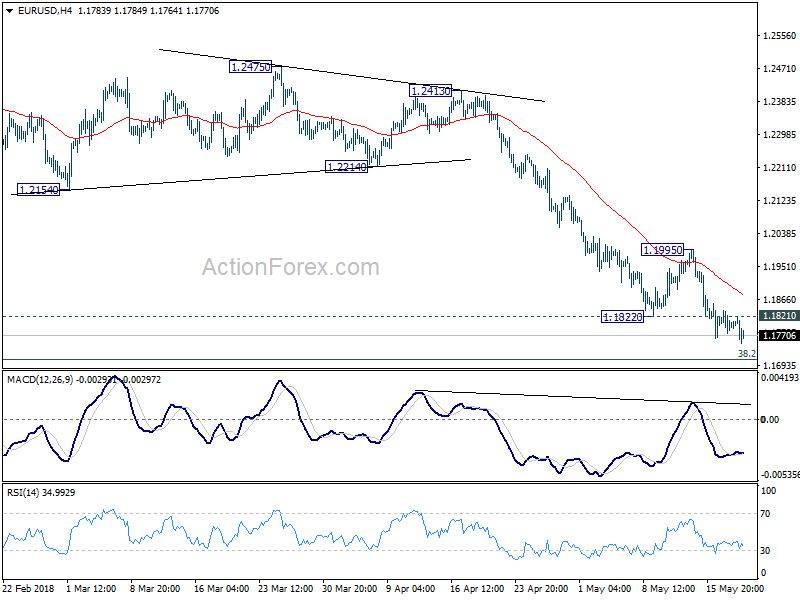
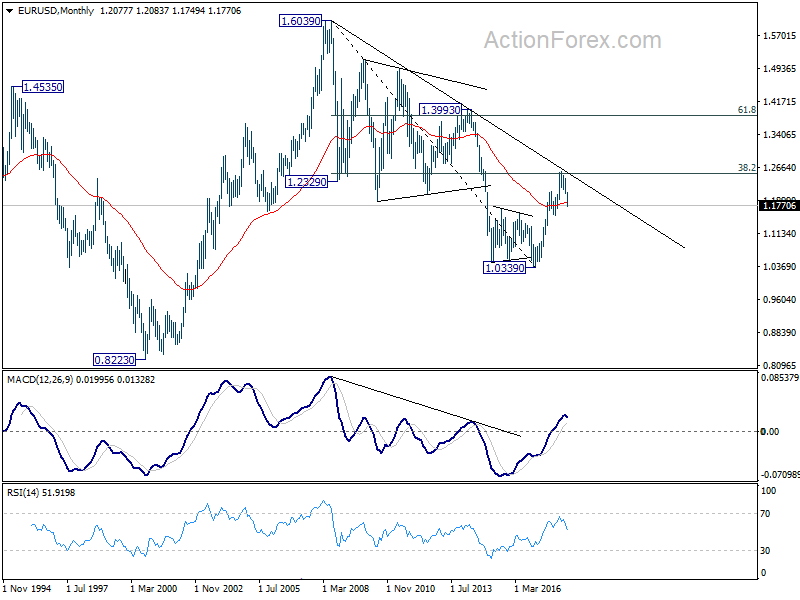
EUR/USD's fall extend to as low as 1.1749 last week and there is no clear sign of bottoming yet. Initial bias remains on the downside this week first. Current decline from 1.2555 should target 1.1708 medium term fibonacci level next. Break will target 1.1553 support. On the upside, above 1.1821 minor resistance will turn bias neutral again. But outlook will continue to stay bearish as long as 1.1995 resistance holds.
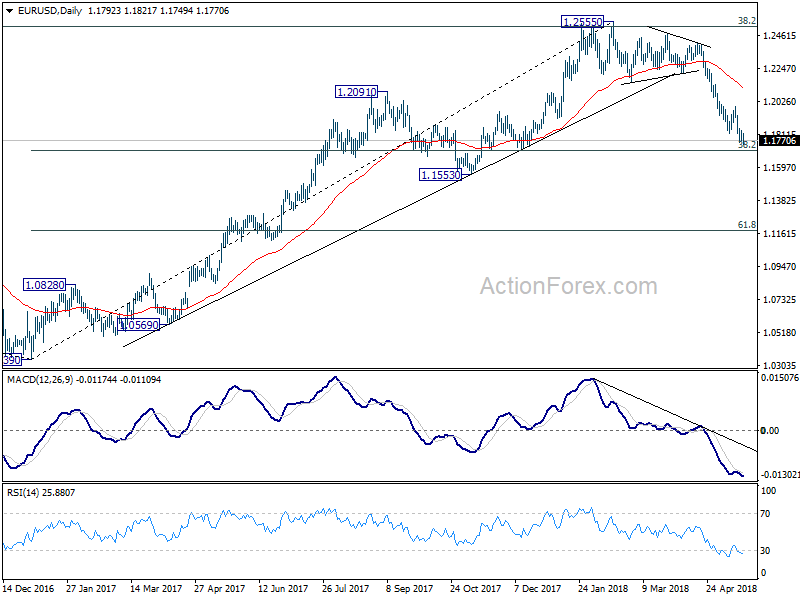
In the bigger picture, current development suggests that EUR/USD was rejected by 38.2% retracement of 1.6039 (2008 high) to 1.0339 (2017 low) at 1.2516. And, a medium term top was formed at 1.2555 already. Decline from there should extend further. Break of 38.2% retracement of 1.0339 to 1.2555 at 1.1708 will target 61.8% retracement at 1.1186. For now, even in case of rebound, we won't consider the fall from 1.2555 as finished as long as 55 day EMA (now at 1.2113) holds.
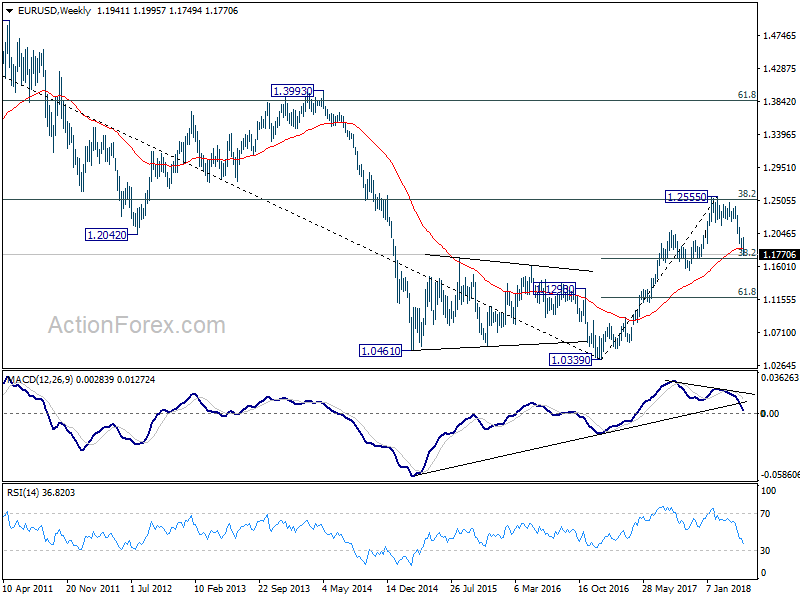
In the long term picture, the rejection from 38.2% retracement of 1.6039 to 1.0339 at 1.2516 argues that long term down trend from 1.6039 (2008 high) might not be over yet. EUR/USD is also held below decade long trend line resistance. Focus will now turn to 1.1553 support. Break there would raise the chance of retesting 1.0339 low. It's early to tell, but the chance of long term bullish reversal is fading.
Summary 5/21 – 5/25
Monday, May 21, 2018
[php_everywhere instance="1"]
Tuesday, May 22, 2018
[php_everywhere instance="2"]
Wednesday, May 23, 2018
[php_everywhere instance="3"]
Thursday, May 24, 2018
[php_everywhere instance="4"]
Friday, May 25, 2018
[php_everywhere instance="5"]
Weekly Economic and Financial Commentary: Domestic Data Supports Further Fed Hikes
U.S. Review
Modestly Positive Data on the Domestic Front
- This past week several key economic indicators hit the wire, taking a pulse for several important sectors. While the headline figures did not jump off the pages, the details are more encouraging.
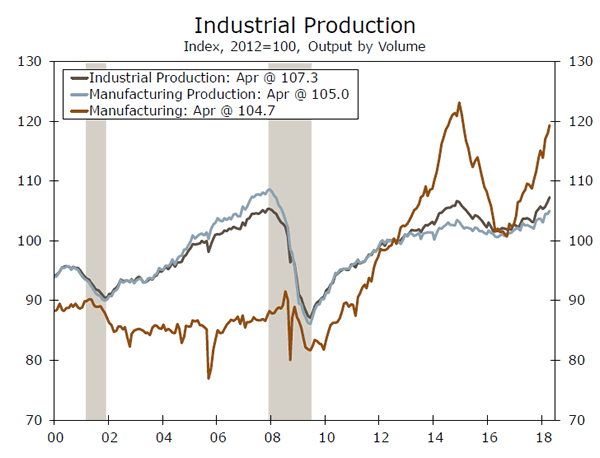
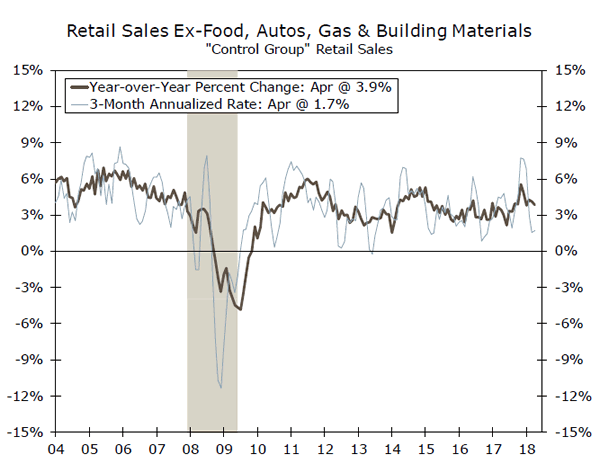
- Retail sales rebounded in April, with notable strength in control group sales, the component that feeds into GDP. Industrial production reached a series high, with contributions from all industry groups. Housing starts contracted on the month, however builder optimism remains relatively high.
- Continued strength in the domestic data flows adds further support for three more rate hikes in 2018.
Domestic Data Supports Further Fed Hikes
It was a fairly busy week on the domestic data front with the release of several notable indicators representing major sectors of the economy. Retail sales increased 0.3 percent in April, while March sales were revised upward, an indication that strength has returned to the consumer sector after several months of negative or weak prints. The retail sales control group, which is used to calculate GDP, was relatively strong in April and revised higher in March, which suggests that economic activity strengthened at the end of Q1 and is on solid footing to begin Q2. The strongest sectors of retail in April were clothing stores and gasoline stations, mostly driven by the recent increase in gasoline prices. Food services & drinking places and health & personal care stores were the notable weak spots, contracting 0.3 percent and 0.4 percent on the month, respectively. Year over year, non-store retailers, which is an alternative expression for e-commerce, is up an impressive 9.6 percent. While we expect the growth in e-commerce to moderate slightly, the growth numbers will likely remain comparatively robust.
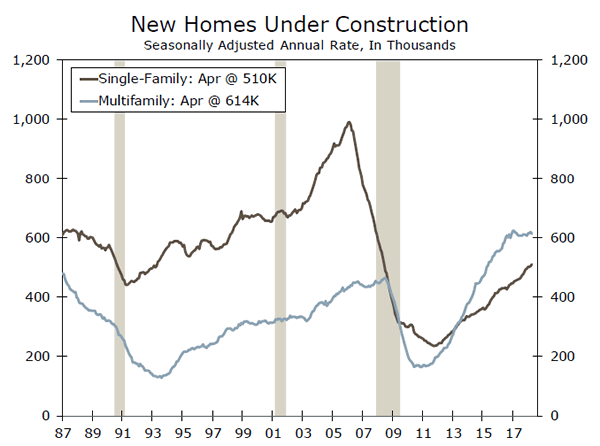
In the world of real estate, housing starts fell 3.7 percent in April, with multi-family projects accounting for all the drop. While the headline figure is not very encouraging, builders appear to be quite optimistic. The Wells Fargo/National Association of Homebuilders Index rose to 70 in May and has been at this level or higher for most of the year. Demand for new homes remains strong across nearly all price points in most major markets. A major factor holding back housing starts has been the recent volatility in apartment construction. We still believe there is life in the apartment boom, with renewed building in supply-constrained markets like Los Angeles and Denver. We also suspect that the supply of new homes and apartments will increase in the coming months. The number of single-family homes under construction rose 1.0 percent in April and continues to trend higher.
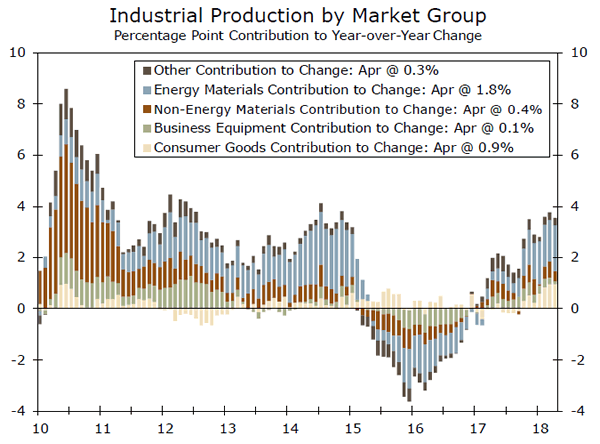
Moreover, industrial production reached a new high in April, with contributions from all three industry groups. The renewed strength in the index has been supported by the rebound in energy prices. Mining output increased 1.1 percent in April, marking the third straight monthly gain for this category. Not surprisingly, the mining sector is the closest to experiencing capacity constraints, as it is at 90.6 percent utilization. Contributing to April's strength was the utilities component of the index. It was the 13th coldest April on record in the U.S., a month when the heat is still running in most places. Natural gas output shot up 10.3 percent month over month, and was up a significant 32.3 percent from April of 2017.
Furthermore, the Leading Economic Index, which is a bellwether for short-term economic growth, increased 0.4 percent in April. The index was supported by broad-based component strength, with notable resilience in the components related to the labor market. The soft and hard data continue to support one another, a signal of stable and balanced growth. The April print adds further evidence that economic growth will continue through 2018, and suggests the Fed will continue to administer rate hikes in 2018 and 2019.
U.S. Outlook
New Home Sales • Wednesday
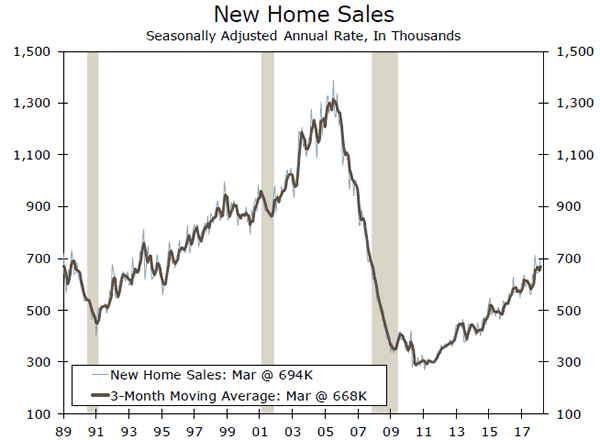
New home sales increased an above-consensus 4.0 percent in March, rising to a 694,000-unit pace. This strong print follows an upwardlyrevised 3.6 percent gain in February, and January also saw upward revisions. These upward revisions have brought new home sales to a level more consistent with the lofty levels of homebuilder confidence behind surging prices and eager demand. Western markets have seen the strongest rise in new home sales, jumping 28.3 percent in March. Much of this is driven from the migration to markets with relative affordability in inland California, Las Vegas and Phoenix.
We expect new home sales to continue climbing as demand remains strong and inventories remain thin behind increased input costs and shortages of labor and lots. The migration to affordable markets with less land restrictions will likely be where we will see the strongest growth.
Previous: 694K Wells Fargo: 679K Consensus: 678K
Existing Home Sales • Thursday
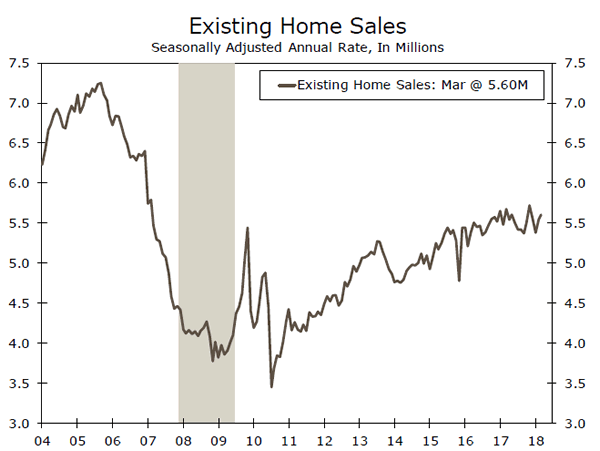
Existing home sales rose modestly in March, climbing 1.1 percent to a 5.60-million unit pace. The existing home-buying market is extremely competitive, as half of homes sold in the month were on the market for less than a month due to tight inventory. In addition, the median price of resale homes was 5.8 percent higher than it was a year ago. Sales were strongest in the Northeast and Midwest in March, largely due to payback and volatility from winter weather. Sales in these regions still trail their year-ago pace.
The number of available homes for sale is 7.2 percent lower than a year ago, and this figure has dropped for 34 consecutive months. Demand is keeping inventories low as job and income growth, as well as demographic factors, remain supportive of homeownership. We expect new home sales growth to rise modestly as demand is strong, but to be capped by rising prices that are limiting affordable options for first-time buyers.
Previous: 5.60M Wells Fargo: 5.64M Consensus: 5.56M
Durable Goods • Friday
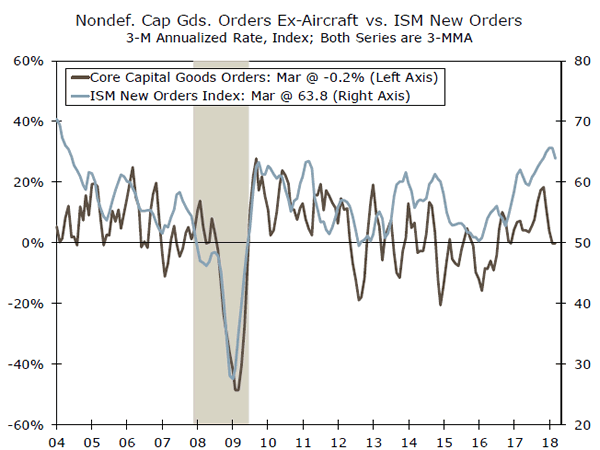
Durable goods orders were mixed in March, as large gains in aircraft orders masked weakness in other categories of business investment for the month. Both civilian and defense aircraft saw double-digit gains and lifted overall durable goods orders to a consensus-beating 2.6 percent increase. Orders for machinery fell 1.7 percent, marking the second drop in three months. ISM levels for new orders have been consistently high, while actual orders have curiously lagged.
Core capital goods shipments fell 0.7 percent in March. Shipments are a good indicator for equipment spending, which came in lower than we expected in Q1. Core shipments excludes volatile transportation and aircraft orders, and for a rebound in Q2 equipment spending, we will likely need to see regained strength in this series. Major factors (corporate profits, ISM, energy prices, etc.) remain supportive of capital goods spending. However, we expect a negative headline number in April given a drop in Boeing orders.
Previous: 2.6% Wells Fargo: -2.0% Consensus: -1.4% (Month-over-Month)
Global Review
Signs of Slower Economic Growth in Most Economies
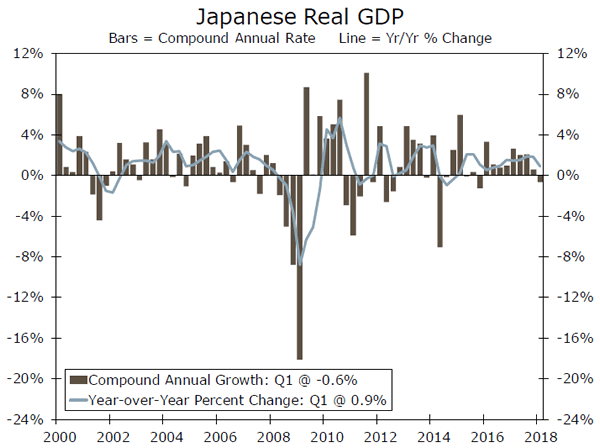
- Real GDP in Japan contracted at an annualized rate of 0.6 percent in Q1 relative to the previous quarter. In our view, however, Japanese real GDP growth will return to positive territory in coming quarters.
- China maintained a steady real GDP growth rate in the first quarter, but recent monthly data suggest that growth may be slowing a bit in the current quarter.
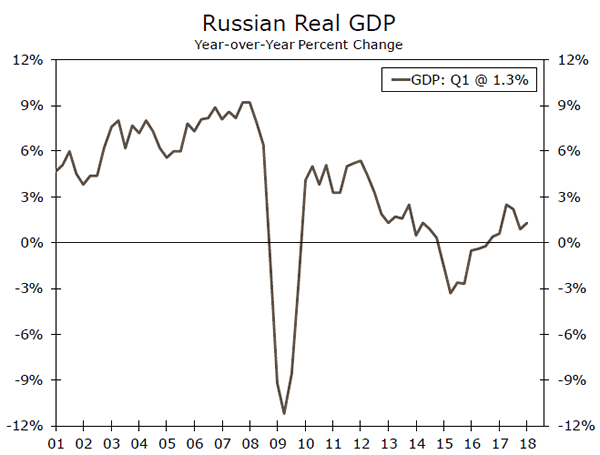
- The year-over-year rate of real GDP growth in Russia edged up to 1.3 percent in Q1, which is hardly overwhelming. We expect that Russian GDP will continue to grind higher, but at rates significantly slower than a decade ago.
Japanese Economy Contracted in Q1
As we have discussed in this report in recent weeks, the pace of economic growth in most major economies slowed in the first quarter. Not only did the sequential rate of U.S. real GDP growth downshift a bit, but the Eurozone and the United Kingdom also posted slower rates of growth in Q1. Data released this week showed that real GDP actually contracted in Japan in the first quarter. Specifically, real GDP declined at an annualized rate of 0.6 percent in Q1, the first contraction in the sequential rate of growth in nine quarters.
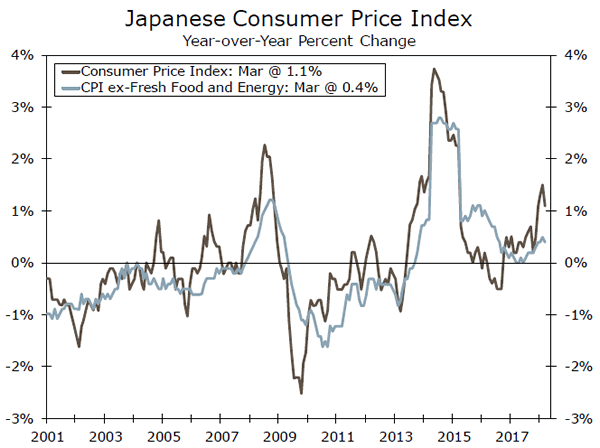
The breakdown of real GDP into its underlying demand components showed that growth in domestic demand was anemic in the first quarter. Not only were private consumption expenditures flat, but investment spending fell 1.2 percent (annualized rate). That said, we view the modest contraction in Japanese GDP in the first quarter as a one-off phenomenon, and we look for economic growth to return to positive territory in coming quarters. But with very few inflationary pressures in the economy at present (top chart), we look for the Bank of Japan to maintain its ultra-accommodative monetary policy for the foreseeable future.
Chinese Economy Decelerating in Q2?
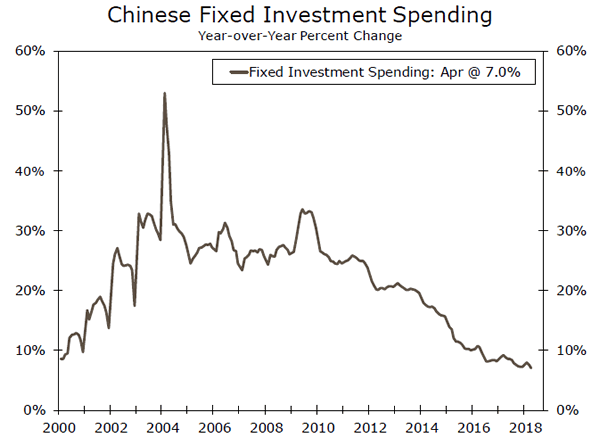
The Chinese economy grew 6.8 percent in Q1, the third consecutive quarter in which real GDP grew at that rate on a year-over-year basis. But it appears that economic growth in China may be stepping down a bit in the current quarter. Although the year-overyear rate of growth in industrial production shot up to 7.0 percent in April from 6.0 percent in March, the rate of growth in nominal retail sales slowed to 9.4 percent in April from 10.1 percent during the preceding month. Moreover, growth in investment spending, which has been the main culprit behind the economic deceleration that China has experienced over the past few years, continued its slowing trend (middle chart). Although we do not expect that the Chinese economy will come off the rails anytime soon, we look for real GDP growth to slow further. Specifically, we project that real GDP in China will grow 6.5 percent this year, down from the 6.9 percent rate that it notched in 2017.
Slight Pickup in Russian Growth in Q1 from Low Rate
Real GDP growth in Russia strengthened a bit from the 0.9 percent rate that was posted in Q4-2017 (bottom chart). A breakdown of the real GDP data into its underlying demand-side components is not available at this time, but it appears that growth in real consumption expenditures was positive in Q1. Inflation has receded over the past year as the ruble has stabilized, and the decline in inflation has helped to boost real income growth, thereby supporting consumption. That said, the 1.3 percent growth rate that the economy registered in the first quarter is hardly overwhelming. As we wrote in more detail elsewhere, we expect that the Russian economy will grind along at a growth rate of roughly 2 percent per annum, a far cry from the supercharged rates of growth that it posted prior to the global financial crisis.
Global Outlook
U.K. CPI • Wednesday
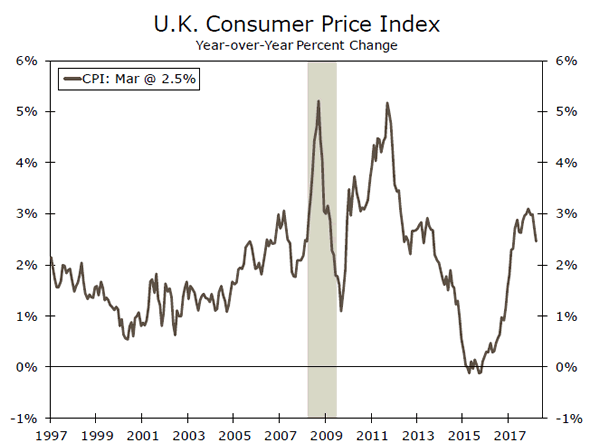
There is a plethora of data releases for the U.K. next week, including CPI and retail sales for April plus demand-side details for first quarter GDP, which will help clarify the recent performance of the U.K. economy. After hitting almost 3.1 percent in November 2017 on a year-earlier basis, the CPI inflation rate has moderated somewhat, closing March 2018 at 2.5 percent. Markets are expecting the CPI to print 0.4 percent (month-on-month) in April after recording a 0.1 percent increase in March, while the year-over-year rate is expected to remain at 2.5 percent. On Thursday we will get retail sales, which have been relatively weak. Retail sales including auto fuel were down 1.2 percent in March after increasing 0.8 percent in February. Markets expect retail sales to come in flat in April.
On Friday, we get detailed GDP data, which will help identify the reasons for the recent slowdown in economic activity.
Previous: 0.1% Wells Fargo: 0.6% Consensus: 0.4% (Month-over-Month)
Eurozone Manufacturing PMI • Wednesday
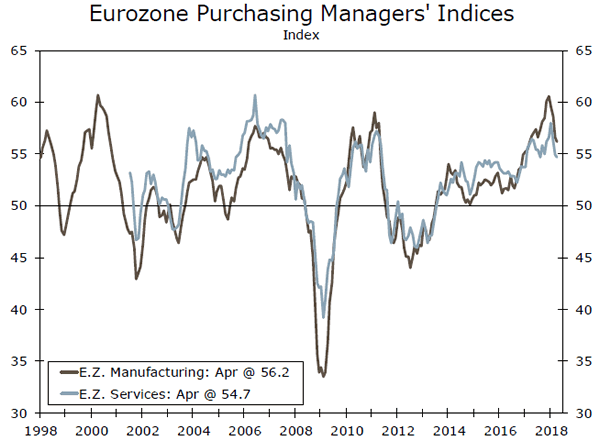
Markets have been concerned recently with the slowdown seen in Eurozone economic activity during the first quarter of the year, so they will be paying attention to any hint that this slowdown has carried over to the second quarter. May's manufacturing PMI release will be useful in providing a better idea of where the Eurozone economy is heading.
On Wednesday we will get manufacturing PMIs for both the Eurozone and Germany. These indices will provide a better gauge of the staying power of the recent weakening trend of the region's manufacturing sector, after they hit a high of 60.6 for the Eurozone and 63.3 for the German index this past December.
The Eurozone index was down to 56.2 while the German index slowed to 58.1, both in April.
Previous: 56.2 Consensus: 56.0
Germany IFO • Friday
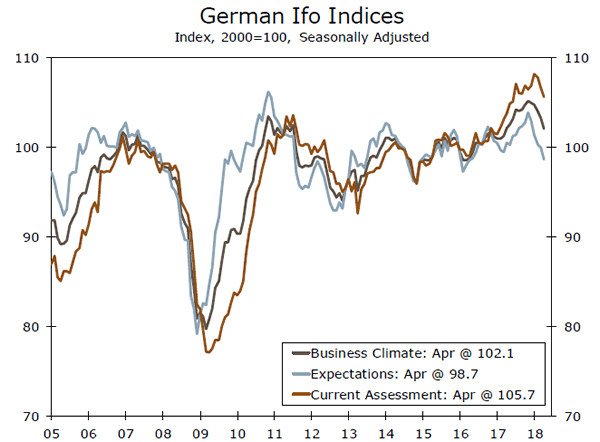
On Friday markets are going to be able to look at the May IFO business climate, expectations, and current assessment indices for Germany. The business climate index has weakened somewhat since recording a high of 105.2 in November 2017. Meanwhile, the business expectations index, which tends to be more forward looking, has also been on a weakening trend, with the index hitting 98.7 in April after being at 103.9 in November 2017. The current assessment index, which has also weakened somewhat, from a high of 108.2 in January to April's 105.7, has not fallen as much as the other two.
On Thursday we will also get the GfK consumer confidence index for June. This index hit a high of 11.0 in February of this year and has come down to 10.8 in May. Furthermore, we will get demand-side details for Q1 GDP in Germany.
Previous: 101.1 Consensus: 102.0
Point of View
Interest Rate Watch
Seven Years and the Debt
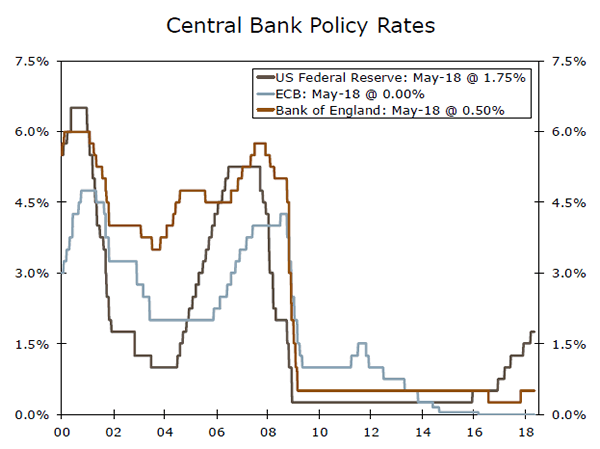
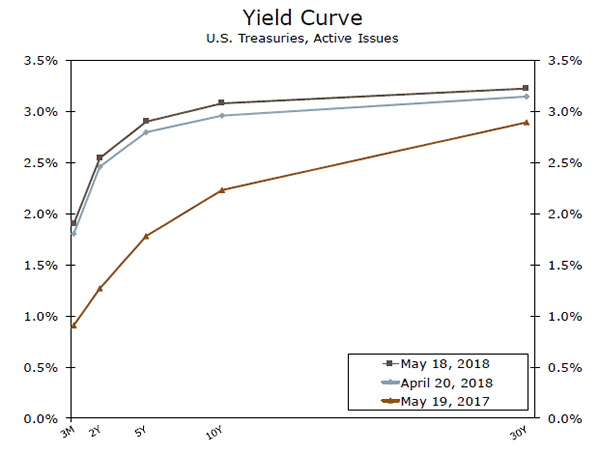
Our message on interest rates has been fairly consistent: with the Fed expected to deliver a total of four rate hikes this year, the yield on the short end of the curve will move a full percentage point to 2.50 percent. Further out the curve, rates will also move higher, though not as fast as they do in shorter-dated bonds, the result of which is a flattening of the yield curve.
That said, we have also made the case that growing budget deficits will require the Treasury to issue more debt. A lot more. After issuing less than $600 billion last year, we expect more than $1 trillion in Treasury bond issuance this year. That new issuance will occur alongside a gradual normalization in the Fed's balance sheet, which at a minimum means the Fed will not be soaking up new bonds as they have throughout this cycle. All that extra supply means lower prices on Treasuries and consequently higher interest rates.
One could argue that improvement in the domestic U.S. economy lifts market confidence not only in the probability of further rate hikes from the Fed, but also in the normalization of the balance sheet.
As noted in the Domestic Review section, the news this week showed improvement in the economy. Retail sales did not disappoint, industrial production hit a new all-time high and the Leading Economic Index climbed higher. Though less widely followed, the Philadelphia Fed index shot higher and its new orders component hit its highest level since the 1970s.
It is not altogether surprising then that over the course of this week, the yield on the benchmark 10-year Treasury went from a low of 2.95 percent on Monday to high of 3.12 percent on Thursday, a seven-year high. As of this writing on Friday morning, the yield is slightly lower, though it remains close to the top end of this week's range.
Our forecast for the end of the year for the 10-year is 3.20 percent, which means this week's trading action moved us roughly half the distance to our year-end target. The fact that the yield has come off the boil this morning suggests that some of the selling this week may have been overdone.
Credit Market Insights
Millennials & Household Debt Trends
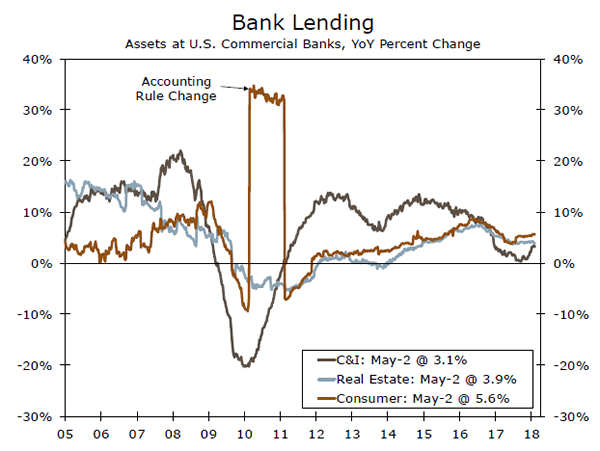
Household balance sheets continued to expand in Q1, according to the latest Quarterly Report on Household Debt and Credit released by the New York Fed this week. However, growth across loan types was mixed, as student loans, auto loans and mortgages expanded, while credit card loans and home equity lines of credit (HELOC) declined over the quarter. Additional commentary from the New York Fed cited that HELOC are becoming increasingly untapped, even as home equity has risen in this expansion. Their analysis points to tighter lending standards and fewer younger borrowers able to qualify for mortgages as factors restraining growth in this loan type.
We have also written about other challenges facing Millennial borrowers. Our recent analysis on student loans found that while the overall student debt outlook is improving as rising incomes and a tight labor market better position borrowers to pay down debt, not all borrowers are created equal. For example, students that do not complete their degree or those that attend a for-profit college are more likely to default on loan obligations. While this week's report did show that aggregate student loan delinquency rates improved slightly in Q1, we have found that this trend may not apply to all types of borrowers.
For now, modest wage gains and a largely orderly rise in interest rates should support the ability for most Millennials to continue to pay down debt. However, default rates remain and area to watch in this expansion.
Topic of the Week
The Durability of Durable Goods Consumption
Earlier this week, the Bureau of Economic Analysis released its monthly report of retail sales activity. Retail started the second quarter relatively strong, up 0.3 percent in April, while upward revisions to sales data in March suggest consumption began to recover at the end of the first quarter. The April retail sales report bodes well for a rebound in consumption in the second quarter, which will likely support stronger overall economic growth.
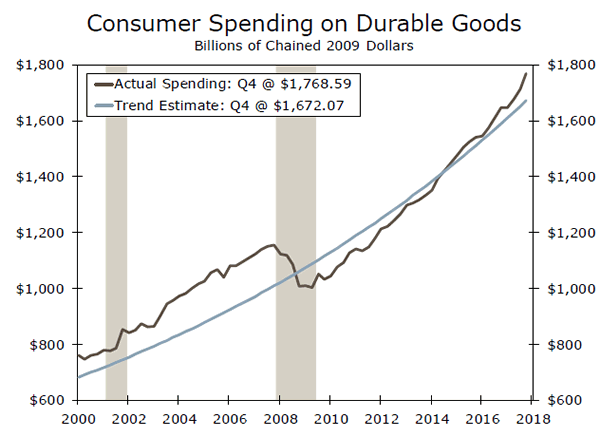
In a special report published earlier this week, we take a look at the state of durable goods consumption compared to its long-run trend (top graph). Personal consumption expenditures (PCE) account for roughly 70 percent of overall GDP. While the consumption of durable goods represents the smallest share of overall PCE (i.e., the consumption of goods and services), compared to nondurable goods or services, it is the most volatile component. Consequently, understanding the current and expected state of this component of consumption can aid in interpreting the state and longevity of the current economic expansion.
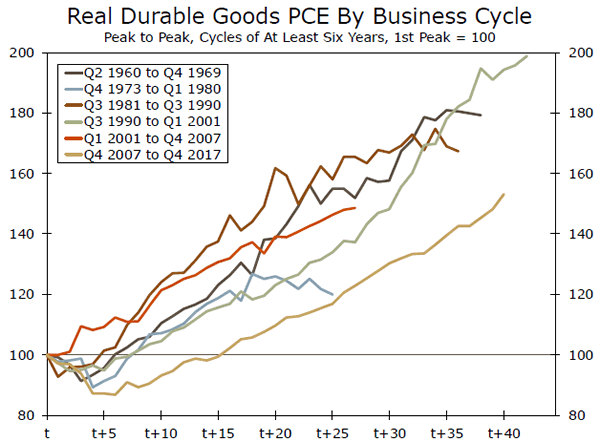
We highlight our previously published (2013) analysis on this topic, which discussed the potential upside or pentup demand for the consumption of durable goods. Our conclusions at the time found that there was pent-up demand for several sectors of durable goods consumption. In our more recent report, we discuss whether that demand has come to fruition, as well as expand upon our analysis of durable goods by comparing current spending habits to consumption patterns that existed during prior expansions (bottom graph).
While some components of durable goods consumption were quick to recover from the Great Recession, others still demonstrate remnants of the most recent downturn. Spending behavior is mixed across the different components of durable goods; however, underlying trends suggest increased demand for durable goods consumption in the quarters ahead.
The Weekly Bottom Line: Onwards and Upwards
U.S. Highlights
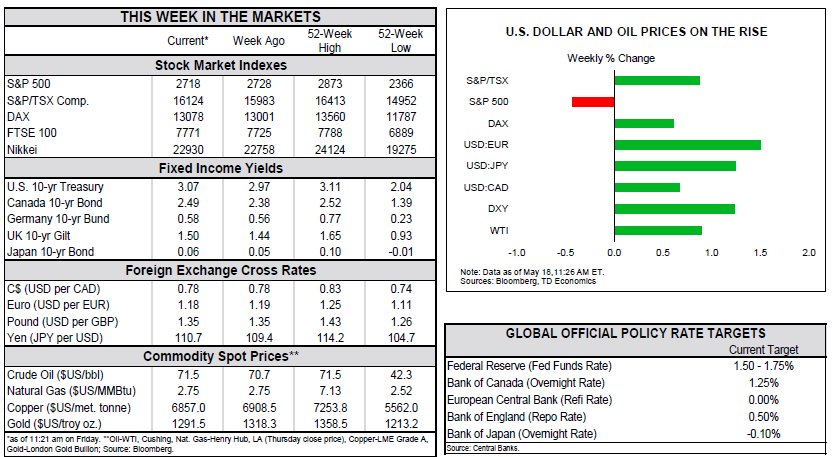
- Equity markets were buffeted by plenty of anxiety-producing events from uncertainty on trade negotiations to right wing coalitions in Italy. Americans may also be a bit nervous about higher prices, both at the pump and for borrowing.
- The rise in oil prices is expected to be a modest drag on consumer spending. Ditto for mortgage rates and the housing market. Much of this was anticipated, and had already been baked in to our last quarterly forecast.
- We continue to expect growth to run around 3% over the remaining quarters of 2018 as the boost from fiscal stimulus offsets these modest headwinds.
Canadian Highlights
- It was another good week for Canadian equity investors. As of writing, the TSX looks to have finished the week comfortably above the 16,000 mark, up close to 1%, and at its highest level since January.
- Fixed income investors on the other hand, weren't so fortunate as bonds sold off across the curve, with selling more acute at the long end. Canadian 5 and 10-year yields rose over 10 basis points, following their U.S. counterparts higher.
- The magnetic pull higher from U.S. yields is tightening financial conditions in Canada. As long as the inflation outlook remains benign, the Bank of Canada can maintain their cautious approach. The data this week support that narrative. Canadian CPI inflation decelerated to 2.2% in April (from 2.3%) in March.
U.S. - Onwards and Upwards
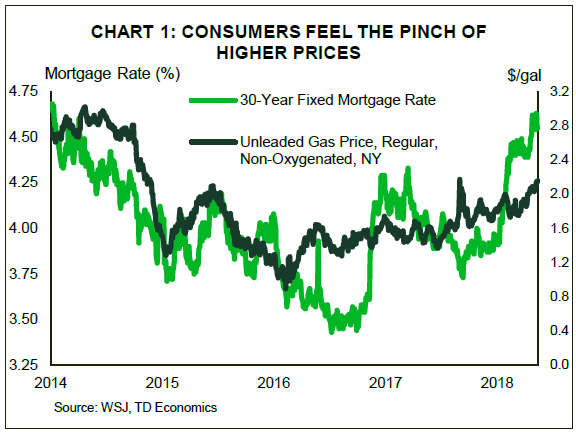
The past week featured plenty of events for equity markets to fret about, from uncertainty surrounding U.S. trade negotiations, to a eurosceptic right-wing coalition in Italy. Concerns about emerging markets (EM) have led to the worst week for EM currencies in a year and a half, as the U.S. dollar continues to rise. And for Americans, it seems like everything is going up these days, from mortgage rates to gasoline prices (Chart 1).
Drivers may be getting sticker shock as they fill up their tanks, with the national average gasoline price approaching $3 per gallon. However, about half of the 10% rise in gasoline prices since March is the typical seasonal increase. Still, this will leave a bit less cash in wallets for spending on discretionary items. To put some numbers to it, in 2017 each American consumed about 442 gallons of gasoline per year, so a 5% increase works out to about $62/month for a family of four.
Higher oil prices are acting to drive inflation expectations, and consequently Treasury yields, higher. The 10-Year yield reached 3.11% on Thursday, the highest level since mid-2011. For much of last year, we argued bond yields were too low, and now things are looking much more reasonable. What's more, the latest readings on the economy are consistent with higher bond yields. A healthy retail report for April demonstrated that consumers are back in action after taking a breather in Q1 Consumer spending growth in the second quarter is tracking close to 3% annualized, which would help to support a similar growth tally for the economy as a whole.
Mortgage rates have followed Treasury yields higher. The average rate on a 30-year fixed-rate mortgage rose to 4.61% this week, very close to the 2013 taper tantrum episode highs. The impact of higher mortgage rates is less far reaching than gasoline prices. It will only affect new borrowers and homeowners who are refinancing. The average new mortgage was $317,300 in March, so the impact of the 74 basis point increase in rates since the beginning of the year will raise the average monthly payment about $138 per month. This should hinder affordability in the housing market, and lean against demand.
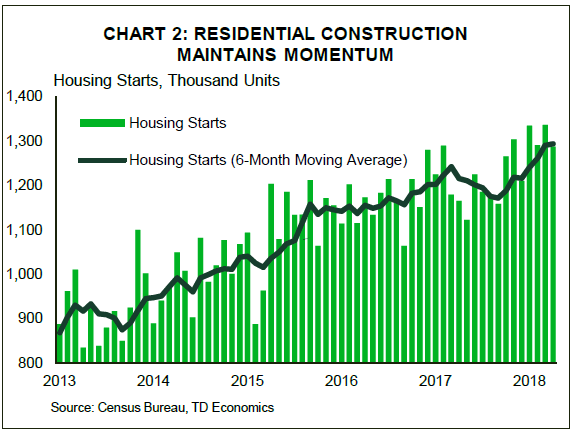
That said, we remain confident that the positive fundamentals for housing will underpin gains in residential construction going forward. Housing starts may have been off a bit in April, but looking through the monthly volatility, the trend in the forward-looking permits data is still positive (Chart 2). Moreover, the monthly decline was due to the always volatile multi-family component. True, there are headwinds to homebuilding activity, including labor shortages in the construction industry, rising building material costs and a lack of buildable lots. But, after some weakness over the winter, homebuilder sentiment took a tentative step higher in May, suggesting these barriers are not insurmountable.
The pinch of higher prices and borrowing rates is expected to restrain consumer spending and housing investment slightly versus 2017's performance. But, for the remainder of 2018 we expect business investment and government spending to power real GDP growth of around 3%.
Canada - Equities Move Higher And So Do Yields
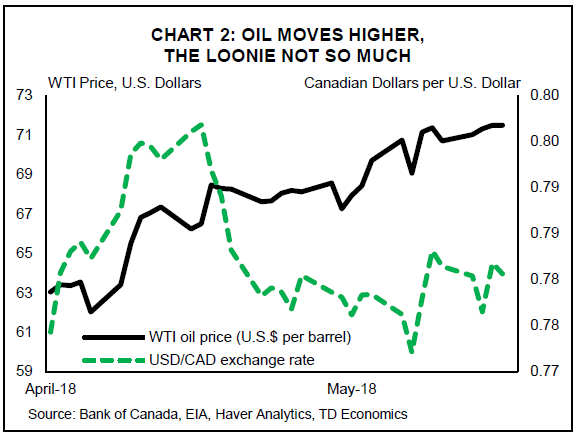
It was another good week in what has been a good month for Canadian equity investors. As of writing, the TSX looks to have finished the week comfortably above the 16,000 mark, up close to 1%, and at its highest level since January. Higher oil prices have no doubt contributed to the TSX's fortunes. The WTI price continued to move higher this week, up around 1% to push above the $71.50 U.S. a barrel mark.
Fixed income investors on the other hand, weren't so fortunate, as bonds sold off across the curve, with selling more acute at the long end. Canadian 5 and 10-year yields rose over 10 basis points, following their U.S. counterparts higher.
The magnetic pull higher from U.S. yields is tightening financial conditions in Canada even without any change to the Bank of Canada's policy rate. Higher yields will make their way to mortgage rates, worsening affordability in a housing market that is already stretched. Data this week on existing home sales shows the market continues to struggle. Existing home sales fell 2.9% in April – the fourth straight monthly decline, while average prices were basically flat at their lowest level since 2005.
The recent rise in yields has come faster than our baseline expectation, and while some reversal may take place, they do not help an already precarious housing outlook. Rising borrowing costs are front and center to the Bank of Canada's economic monitoring. Given the level of household debt, the sensitivity of Canadian households to higher interest rates is higher than it has been historically.
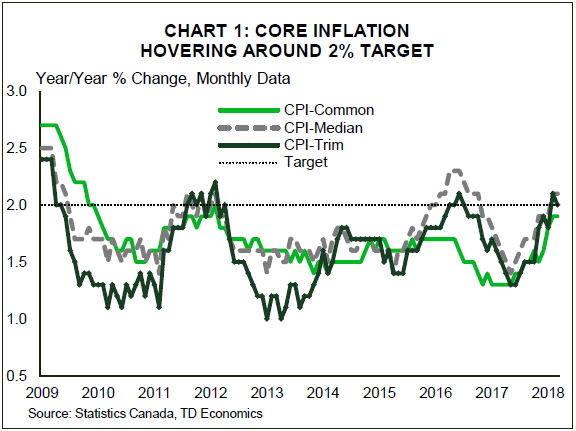
This means that as long as the inflation outlook remains benign, the Bank of Canada can maintain their cautious approach. The data this week support that narrative. Canadian CPI inflation decelerated to 2.2% in April (from 2.3%) in March, while the average of the Bank of Canada's core inflation measures remained steady at 2.0%. Headline inflation is likely to be lifted by the steady rise in oil prices over the past month, but beyond that price pressures look to be fairly well contained. With some temporary factors at work (higher minimum wages) and Poloz's emphasis on the symmetry of the Bank's inflation target, there appears little on the price front to force the Bank's hand.
A more cautious Bank of Canada relative to the U.S. is weighing on the Canadian dollar. Despite the rise in oil, the Canadian dollar looks to finish the week lower, at around the $0.78 U.S. mark. Indeed, the usual positive correlation between oil prices and the exchange rate has not been as strong of late, reflecting both uncertainty around Canadian pipeline capacity (and investment) and the expected increase in U.S. production (and investment).
The other factor weighing on the Canadian dollar is, of course, ongoing uncertainty with respect to NAFTA. While Prime Minister Trudeau expressed his optimism that a deal was close, this was dismissed by the United States Trade Representative, Robert Lighthizer who noted ongoing differences on intellectual property, agricultural access, labor and energy. Uncertainty around NAFTA falls disproportionately on Canada and Mexico, and the exchange rate bears this out.
Dollar Rises Amid Italian Coalition and China-US Trade Uncertainty
The US dollar appreciated against major rival currencies on Friday. The dollar rally is back on after the two of the largest parties in Italy agreed to form a coalition government and Japanese inflation retreated. Although there is no plan for Italy to exit the European Union it could put it to the test with its fiscal strategy. The U.S. Federal Reserve members have been vocal about two or three more rate hikes this year boosting the USD but concerns remain on the trade front after comments from the US President Donald Trump on talks with China and the future of NAFTA remains uncertain despite the optimism from the Canadian Prime Minister. The release of the U.S. Federal Reserve minutes from the May 5 Federal Open Market Committee (FOMC) meeting where the central bank left rates untouched will be the biggest market event on Wednesday, May 23 at 2:00 pm EDT.
- Fed to release notes from May meeting
- EUR struggles with slow EU growth and rising scepticism
Italian Drama Sinks EUR against USD
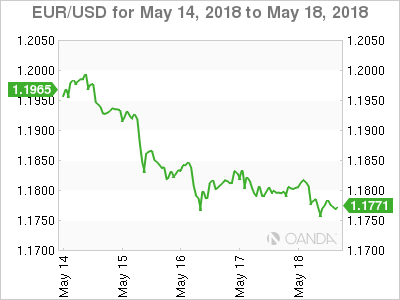
The EUR/USD lost 1.34 percent in the last five days. The single currency is trading at 1.1778 with a resurgent USD and an EUR caught in political drama. The U.S. Federal Reserve is on its way for a rate hike in June and in contrast the European Central Bank (ECB) has not made it clear what the plan is after September when the quantitive easing will end. The ECB has to be thankful for the lower EUR as it could be a factor in boosting growth in the EU and could have a positive effect to reach the central bank’s inflation targets.
The Five Star Movement and the Northern League are close to a coalition government and would mean the biggest victory of the eurosceptic movement in Europe. Italy is one of the founder members of the European Union and while there have been instances in France with Marine LePen and Germany with the rise of the Alternative for Germany this coalition is now the biggest threat to the EU. Italy represents about 11 percent of the Union’s GDP. One of the hardest hit nations by the recession and also one of the slowest to recover have given way to a rise of populist parties that although fragmented in ideology found common ground in their dislike for the EU.
The release of the Fed minutes will add some talking points to the already priced in monetary policy strategy. The US central bank should continue to tighten and the notes will be a welcomed release on a week with little competition for investor’s attention.
Rising US Yields Have Yen on Retreat
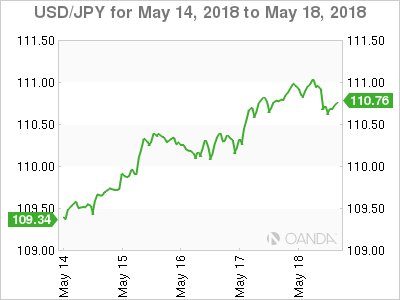
The USD/JPY gained 1.21 percent during the week. The currency pair is trading at 110.70 after US 10-year bonds touched. Seven year high h hitting 3.12 percent. The solid data out of the US has stood out against Japanese data that has struggled to impress. The back and forth in the North/South Korea meetings has not reassured investors in the peninsula and with further trade uncertainty with Washington
Emerging markets have been the biggest losers agains the US dollar, but so far there are no contagion fears as global growth could be slowed down. If that happens the JPY would rise as it is one of the preferred safe havens for investors in times of turmoil.
Canadian Inflation Lower After Inflation and Retail Sales Weaker than Expected
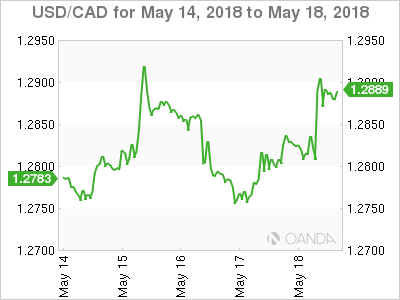
The USD/CAD appreciated 0.77 percent in the last five trading sessions. The currency pair is trading at 1.2891 after the loonie lost close to 0.60 percent on Friday alone. The North American session started with the release of Canadian inflation and retail sales data. Inflation fell in April putting less pressure on the Bank of Canada (BoC) to hike rates as annual inflation was 2.2 percent. Retail sales rose but only if auto sales were taken into consideration, without car sales core retail sales were down by 0.2 percent.
Analysts are begging to walk back their probabilities of a rate at the end of the month after the disappointing data while still taking into consideration that the economy is on the mend after the slowdown in the fourth quarter. Rate hike expectations are still high for later in the year as the BoC usually tries to keep the gap between Canadian and American rates from growing too big. The U.S. Federal Reserve is highly anticipated to go again in June with another 25 basis points lift to its benchmark rate.
The deadline set by US House Speaker Paul Ryan came and went unfulfilled as Canadian, Mexican and American negotiators continue to be far form reaching an agreement on the contentious issues of NAFTA. Canadian Prime Minister Justin Trudeau is optimistic the deal will be renegotiated successfully in May but given the presidential elections in Mexico in July and the US midterms in the fall the window of opportunity on a fast tracked deal is closing.
Market events to watch this week:
Tuesday, May 22
- 5:00am GBP Inflation Report Hearings
Wednesday, May 23
- 4:00am AUD RBA Gov Lowe Speaks
- 4:30am GBP CPI y/y
- 10:30am USD Crude Oil Inventories
- 2:00pm USD FOMC Meeting Minutes
Thursday, May 24
- 4:30am GBP Retail Sales m/m
- 7:30am EUR ECB Monetary Policy Meeting Accounts
Friday, May 25
- 4:30am GBP Second Estimate GDP q/q
- 8:30am USD Core Durable Goods Orders m/m
*All times EDT
Australia & New Zealand Weekly: Wages and Confidence Data Supports Reserve Bank’s More Cautious Aapproach
Week beginning 21 May 2018
- Wages and confidence data supports Reserve Bank's more cautious approach.
- RBA: Governor Lowe, Assistant Governor Bullock speak.
- Australia: Westpac-MI Leading Index, construction work.
- NZ: retail sales, trade balance.
- Euro Area: consumer confidence.
- US: FOMC minutes, durable goods orders, new & existing home sales.
- G3: flash PMIs.
- Key economic & financial forecasts.
Information contained in this report current as at 18 May 2018.
Wages and Confidence Data Supports Reserve Bank's More Cautious Aapproach
The minutes of the May monetary policy meeting of the Reserve Bank Board repeated the assertion that first appeared in the April minutes. That is that "members agreed that it was more likely that the next move in the cash rate would be up rather than down". This observation is contingent on the economy evolving in the way the Bank currently expects which is "a gradual pick-up in inflation as spare capacity in the economy is absorbed and wages growth gradually picks up". Nevertheless the Board observed that spare capacity in the labour market would remain for some time.
Using this terminology might create challenges for the Bank in the future. If the term is ever deleted from the minutes, markets are likely to take that as a sign that the Bank's policy stance has changed.
Note the "bold" move from the new Governor of the RBNZ (Adrian Orr). He lowered his growth and inflation forecasts and stated, "the Official Cash Rate (OCR) will remain at 1.75 percent for some time to come. The direction of our next move is equally balanced, up or down".
The Reserve Bank of Australia however did not lower its growth or inflation forecasts in its recent Statement on Monetary Policy but did make a subtle change in the rhetoric of the minutes, "it would be appropriate to hold the cash rate steady and for the Reserve Bank to be a source of stability and confidence".
That implies a 'badge of honour' to have steady rates, rather than a stance that needs to be justified in a world where other central banks are tightening policy. Perhaps the lead from the RBNZ, who have recognised the risks around the current environment, has had some impact on their thinking.
The clear positive development for the economy has been the strong boost to non-mining business investment particularly non-residential construction and government public works. The Bank is justified in expecting that this strong momentum will be sustained although in our view at a decreasing pace. We expect that non-residential construction which added 0.6 percentage points to GDP growth in 2017 will gradually reduce its contribution to GDP growth to 0.33 percentage points in 2018 and 0.19 in 2019. Equally we also see government public works spending will also grow but at a slowing pace contributing 0.4 percentage points in 2017, 0.31 in 2018 and 0.23 in 2019.
There remains the concern that wage pressures may take some time to emerge. Indeed Deputy Governor Debelle highlighted a key risk to the Bank's outlook in his speech on May 15. He nominated that risk as being that the level of the unemployment rate needed to spark wage and inflation pressures might be lower than the Bank's current unemployment forecast. Note that this is a fairly cautious 5.25% (from current 5.6%) by June 2019 and remaining there through to the end of the forecast period by June 2020.
In fact this forecast represents a downgrade of the unemployment outlook. In the February Statement on Monetary Policy the forecast was for the unemployment rate to fall to 5.25% by June 2018 - a full year earlier than the current forecast. In that sense the Bank has actually downgraded an aspect of its growth outlook. This presumably reflects the slowdown in jobs growth we have seen in 2018 with the four month annualised pace slowing to 1.3% from overall growth in 2017 of 3.4%.
These cautious forecasts of the unemployment rate must indicate that the Bank is aware of the risk that the labour market does not tighten sufficiently to boost wages and other incomes. In fact general estimates of the so-called full employment rate (NAIRU) have been around 5% for Australia. In other countries, their traditional NAIRU estimates have been downgraded in the aftermath of the GFC.
Certainly there is still no sign of any lift in wage pressures. The March quarter wages report printed on May 16.
Total hourly wages ex bonuses rose by 0.5% in Q1 compared to a median of market expectations (and Westpac's) of 0.6%. This is the second quarter of a disappointing wage print, Q4 WPI rose 0.6% compared to a median expectation of 0.7%. The Q4 print was also revised down to 0.5% from 0.6% as it was originally reported. These modest wage outcomes leave annual private sector wages growth "stuck" at 1.9% despite the 3.3% increase for the minimum wage as determined by the Fair Work Commission.
The Board discusses this prospect when it talks about the wage price index not picking up as quickly as in the past when business surveys identified some shortage of suitable labour. The Board discussion moved to international evidence which shows similar inertia in wages and they discussed possible reasons including competitive pressures from globalisation and technological change. We would add: low productivity growth; falling unionisation; high household debt which constrains job mobility and lack of pricing power generally in the economy. As one employer noted "Why should I grant a pay rise if I cannot compensate with a price rise"?
There may be some source of embarrassment in the minutes in that it is noted that "recent data on retail" suggested that momentum had continued in early 2018. Since the Board meeting, the retail sales report showed that real retail sales had grown by a very modest 0.2% in the March quarter.
This downbeat take on the consumer was further supported by the Westpac Melbourne Institute Index of Consumer Sentiment. The May Report showed a further modest deterioration.
This followed the well-received Commonwealth Budget which included personal tax cuts; savings largely explained by tighter scrutiny of the black economy (few specific losers) and an improved fiscal position. The modest 0.6% fall came as a surprise. It was underpinned by a 6.5% fall in the sub Index (household finances compared to a year ago) and although the Budget boosted confidence in the near term economic outlook, it failed to spark interest in respondents' assessments of their finances.
In the minutes, there was a more detailed discussion on the outlook for housing. In particular, the Board notes that "a further tightening in lending standards in Australia, particularly in the context of the current high level of public scrutiny of Banks, was possible which would affect household borrowing and spending". The recent release (since the Board meeting) of housing finance data showing that new lending to investors was now down 26% over the year (and 30% from the peak) is certainly consistent with those concerns.
That clearly signals a slowing in credit growth and the Deputy Governor, in his speech, acknowledges that likelihood. The issues are not only around reduced confidence amongst investors but an impact on the amount of funds an individual can borrow. Deputy Governor Debelle postulates that such a tightening has implications for house prices more than consumption. We do not think that argument is strong. For example note the significant impact on household finances in the Consumer Sentiment survey partly reflecting weaker housing - it is risky to assume little wealth effect when prices fall just because it seems to be muted when prices rise.
The Deputy Governor does address the issue of the implication for a fragile housing market if the RBA raises rates. He notes that an environment where rates are rising would "highly likely to be one where wages and household incomes are growing faster than currently, improving the ability of households to afford higher mortgage payments." That is a reasonable argument and does demonstrate that the Bank is mindful of the impact of increasing rates on a fragile housing market.
Westpac continues to expect that the Bank's policy of "stability and confidence" (rates on hold) will be maintained throughout 2018 and 2019.
The week that was
The past week has been a quieter one for data, although significant moves have been seen in US long-term interest rates and the US dollar.
First for Australia, the Westpac-MI consumer sentiment survey was released for May. This release held additional significance, being the first gauge of sentiment following the Federal Budget 2018. Sentiment declined 0.6% overall to 101.8. However, the sample detail pointed to a positive response among consumers from the Budget, with views recorded after the Budget 4.9% higher than those before - the biggest positive turnaround seen since we started tracking the before and after sub samples back in 2011.
Similarly, the Budget question which tracks the Budget's effect on family finances was also the strongest recorded since 2010. 10% expect the Budget will improve their finances; 58% expected no change; and 13% reported they don't know. More broadly, it remains the case that consumer sentiment is being held up by views on the economy (which are above average) despite enduring concerns over family finances. On housing, 'time to buy' has fallen to a six-month low, 15% below the long-run average. House price expectations however remain just above the long-run average nationally, albeit are noticeably weaker in Sydney.
The persistent concerns over family finances arguably stem from poor wage prospects, which this week's other key data again emphasised. The April labour force survey reported that employment bounced back in the month, rising 22.6k after the loss of around 8k jobs in February and March, leaving annual and six-month annualised growth at a still-strong 2.7%yr and 2.5% respectively.
In stark contrast however, the wage price index disappointed in the March quarter, rising just 0.5% to be up 2.1% over the year, just above the historic low for the series. Wage growth in the private sector remains weaker than in the public sphere, with respective annual growth of 1.9%yr and 2.3%yr. Importantly, by state and sector, weakness in wages is broad based. Of the states, the Northern Territory is the slowest at 1.1%yr and Tasmania the strongest at 2.3%yr. By industry, heath & social services is the best performing industry at 2.7%yr, while mining is the weakest, 1.4%yr.
These wage outcomes are much weaker than the unemployment rate and employment growth indicate they should be. Instead the weakness in wages is coming as a result of the underutilisation of labour resources and structural factors (the use of technology and firms' seeking efficiency wherever possible). Underutilisation not only includes those who are unemployed, but also those who are working less hours than they would like.
Importantly, this 'slack' does not end there. There is an additional pool of workers who are not currently opting out but would re-enter for the right opportunity. Stronger conditions would therefore result in greater participation and increased supply.
In terms of the implications for the RBA and monetary policy, see Bill's piece on the previous page.
Turning to New Zealand, Budget 2018 was delivered there this week. Our NZ team have provided a detailed review as well as an essay on the following page.
For the US, it has been a quiet week for data, with only retail sales worth a mention. Headline sales were a little below our expectation in April at 0.3%, but positive revisions to February and March made up the difference. As we have noted on a number of occasions, the consumer's contribution to growth in 2018 will be less significant than in recent years, with business investment and government spending instead to make or break the growth outturn.
We have however seen some interesting moves in US financial markets this week. The 10yr Treasury yield jumped back through 3.00% and currently looks settled around 3.10%. Also the US dollar has continued its uptrend, up another 1.0% this week to be 5.5% higher than the mid-February low.
Whereas gains like these for US yields and the dollar adversely affected equities earlier this year, in this instance equity investors have shown little-to-no concern, with the S&P500 broadly unchanged compared to this time last week.
Likely providing comfort to equity markets is the steady guidance being offered by members of the FOMC and regional Federal Reserve Banks. Put simply, their expectation remains for a gradual rise in the fed funds rate, but only if above-trend growth continues and the labour market tightens further.
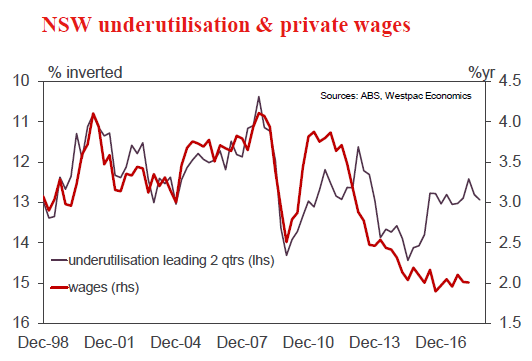
Chart of the week: Q1 NSW wage price index
Wage growth remains weak and remarkably so across industries, sectors and states. At a national level, the only real sign of any lift in wages is from the public sector, particularly in Victoria, with a focus mostly in health services. Even in education, that was performing as strongly as health services, the pace has started to ease back.
Key to the underperformance overall has been the significant underperformance of NSW wages relative to a meaningful tightening in labour market conditions there. Despite a significant fall in underutilisation in that state, private sector wages continue to languish around 2%yr. Add to that the relative underperformance in public sector wages then you can see why wages remain relatively soft overall.
New Zealand: week ahead & data wrap
The "patient" Budget
All eyes were on this week's maiden Budget from the Labour-led coalition Government. In the end it was a rather bland affair. The stronger than expected economy delivered extra tax revenue, but this was promptly gobbled up by increased health spending, leaving the crumbs to be scattered across a range of smaller initiatives in other sectors.
This week's Budget followed a similar script to the final few Budgets under the previous Government. The economy has proved stronger than expected, and that has delivered surprisingly strong tax revenue. But the Government has found that delivering the health outcomes people want is more expensive than forecast. So most of the extra money was channelled into health, and there was precious little left over for anything else. Labour kept its coalition partner happy by boosting funding for ministries headed by New Zealand First politicians, and education got most of the remainder.
Initiatives announced in the health sector included extending free GP visits to children under 14 years old, and a $20-$30 reduction in the cost of GP visits for community service card holders. In education, the focus shifted toward childhood education from tertiary education, giving much more bang for buck. However, the quantum was disappointingly small. Especially when compared to the money poured into free tertiary education and bigger student allowances at last year's Half Year Update which will do much less for society as the benefits mostly accrue to people who are already doing relatively well.
The Government stuck to its self-imposed Budget Responsibility Rules. We think that was appropriate. The economy is in a bit of a sweet spot, so now is the time to save for a rainy day. The future might hold a recession or a natural disaster, and we know that the aging population will be hugely expensive. A line in the sand is also a good way to avoid white-elephant spending by encouraging prioritisation within a spending limit.
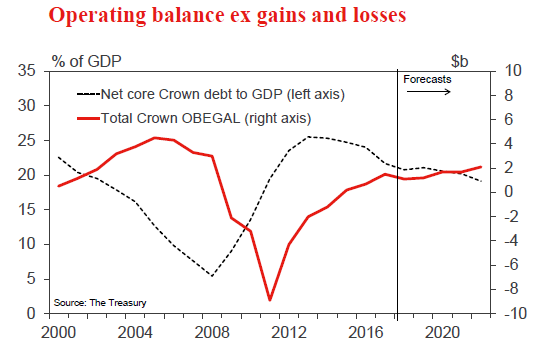
One of the responsibility rules, perhaps the only binding one, is to bring net debt below 20% of GDP within five years of taking office. With only slightly smaller accumulated surpluses, and no new capital spending, there was little change in the forecast for net core Crown debt after five years. The latest projections see it drop to 19.1% of GDP by 2022, leaving the government with some wiggle room.
That might prove useful if, as we expect, growth disappoints relative to Treasury's projections. Although the Treasury's growth forecasts are a little softer in the near-term, they still have a reasonably strong outlook over the next five years, with GDP assumed to average close to 3% per annum. We expect that both nominal and real GDP growth will undershoot the Treasury's forecasts. That signals some associated downside risks for tax revenue collections and projected surpluses.
The other place the Government has generated a bit of wriggle room is by plans to increase borrowing by Crown entities. This borrowing is technically not counted as core Crown debt, though it is a bit of a grey area. For example, Housing New Zealand intends to borrow in its own name to fund the building of new state houses, with the trade-off that it may end up paying a higher interest rate than if the investment had been funded by central Government. This switch won't fool investors who lend money to NZ or ratings agencies who will also keep an eye on total borrowings as well as those strictly defined as core Crown debt. The more borrowing these entities do, the more likely it is to appear on the radar, but we're probably not at that point yet.
The ramp up in spending in this Budget will have inflationary consequences for the economy. Treasury thought these would be significant, and forecast OCR hikes from the end of this year. We view any inflationary consequence as more minor, and more likely to take effect in later years, so we won't be changing our own expectation of the first rate hike in November next year.
One of the risks identified in the Budget was the cost of dealing with the Mycoplasma bovis outbreak - a disease recently discovered in New Zealand for the first time which affects the health of cattle. It makes some sense to note this as a risk as neither the extent of the problem, nor the best response, has been determined yet. But it's also worth noting that the situation has deteriorated in the weeks since the Budget was signed off, with evidence that the disease becoming more widespread throughout the country. These developments have probably swung the dial in favour of farmers learning to manage the disease rather than attempting to eradicate it. Yet, whichever way the decision goes, already fragile confidence in the dairy sector has taken yet another knock.
Overall, it was a bland Budget, but we think that was appropriate. New Zealand's economy is in a fairly sweet spot, so now is the time to save for a rainy day. It also leaves the Government with enough tucked up its sleeve for the remainder of its term. So while today's Budget may have been a largely business as usual document, next year's could be a different beast, once the Living Standards Framework is integrated and the working groups on tax, education and social welfare report back with policy ideas.
Data Previews
Aus Apr Westpac-MI Leading Index
- May 23, Last: +0.69%
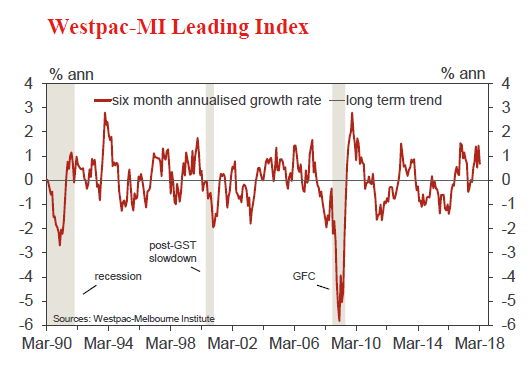
The six month annualised growth rate in the Leading Index fell from +1.43% in February to +0.69% in March. While down, the growth rate is still in positive territory, signalling above trend momentum over much of the remainder of 2018. Drivers of the slowdown were domestic - a slowing labour market; and some weakness in housing while rising short term interest rates have reflected liquidity pressures from global markets.
The April read will include mostly positive component updates, including: the ASX200, up 3.9% vs -4.3% last month; the Westpac-MI Consumer Expectations Index, up 0.8% vs -0.9% last month; US industrial production, up 0.7% vs 0.7% last month; dwelling approvals, up 2.6% vs -4.2% last month; the Westpac-MI Unemployment Expectations Index, down -4.5% vs 3.1% last month; and total hours worked, up 1.1% vs 0.2% last month. The drag from narrowing yield spreads has also moderated although global commodity price moves have been less positive (down -3% in AUD terms vs 2% last month).
Aus Q1 construction work
- May 23, Last: -19.4%, WBC f/c: 0.7%
- Mkt f/c: 1.3%, Range: -2.0% to 5.0%
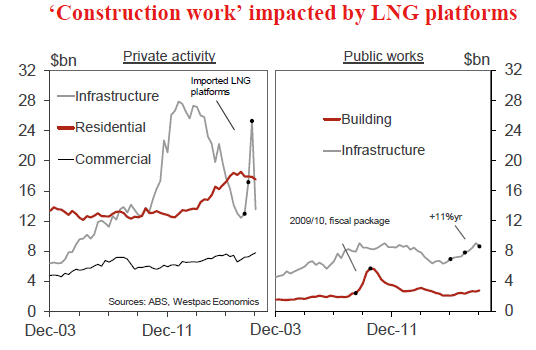
Recently, the Construction Work survey has been impacted by imported LNG platforms. The survey includes their full value when imported, rather than actual work in the period, as in the national accounts.
'Construction Work' rose 9.8% in Q2 and climbed a further 16.6% in Q3 (boosted by imports of platforms), then reversed 19.4% in Q4.
For Q1, we expect a small rise of 0.7%, anticipating no further impact from LNG platforms.
Upswings in public construction and commercial building are likely positives, as well as housing renovations. Potential negatives are: new home building, with approvals off their peaks; and private infrastructure (with a decline in mining as the final gas projects are completed offsetting a lift in nonmining infrastructure).
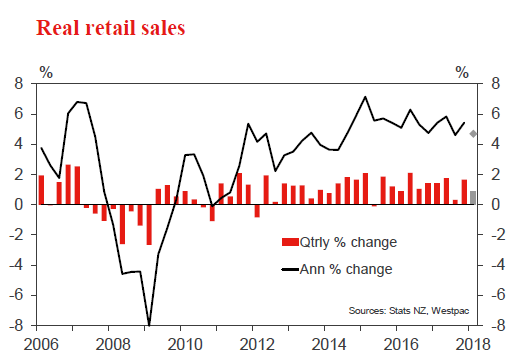
NZ Q1 real retail sales
- May 21, Last: +1.7%, Westpac f/c: +0.9%
Households ended 2017 with a bang. Retail spending rose 1.7% in the December quarter to be up 5.4% over the year. Underpinning the rise in overall spending was a solid 1.8% lift in core categories. That included a 3% increase in spending on hospitality (that was likely encouraged by the hot summer weather), as well as gains in food and grocery sales. There were also solid gains in categories such as clothing and electronics.
We expect that overall retail spending rose by 0.9% in the March quarter. Spending has been held back by reduced expenditure on fuel and vehicles, with the latter affected by recent delays with importing. Core spending, in contrast, is expected to have risen by a solid 1.7%. That includes a continued lift in durables spending supported by the firming in the housing market in early 2018. Consumables spending is also expected to have been firm.
Week Ahead – Euro Looks to Flash PMIs for Bounce; Pound Eyes UK CPI and Retail Sales Data
As the US dollar continues to power ahead, the beleaguered euro and pound will be seeking for some reprieve from key economic indicators out of the Eurozone and the United Kingdom next week. With the US calendar being lighter in the coming seven days, the greenback may lose some steam, though the FOMC minutes could still keep the dollar bulls happy. In other data, trade figures out of Japan and New Zealand will be watched.
Japanese exports eyed for Q2 growth outlook
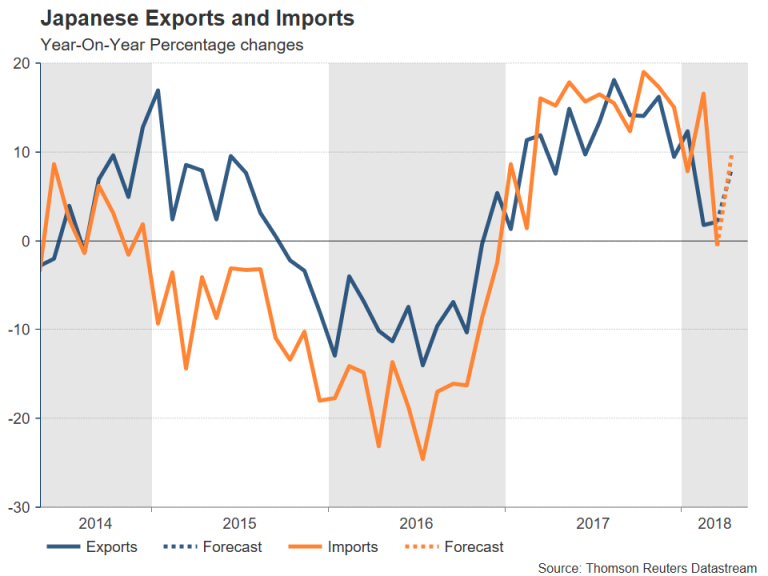
After reporting worse-than-expected growth figures for the March quarter this week, trade numbers out of Japan will come into focus on Monday for clues as to whether the economy is improving in the second quarter. Japanese exports are expected to jump by 8.1% year-on-year in April, rebounding from 2.1% growth in March. Imports are also forecast for robust growth, rising by 9.6% y/y. Equally important will be Wednesday’s flash manufacturing PMI for May. A strong set of figures next week would reinforce the view that the first quarter weakness was temporary. However, signs that the Japanese economy continues to lose momentum would further bolster the dollar/yen pair.
Kiwi hoping for rebound from New Zealand retail sales data
The New Zealand dollar made another push higher this week after tumbling to a 5-month low of $0.6849, but that attempt didn’t last long as the greenback rally picked up speed again. Retail sales figures for the first quarter, due on Monday, could help the kiwi make a more convincing recovery if the strong consumer spending seen at the end of last year carries through to 2018. Trade data will also be watched by kiwi traders, due on Thursday.
Will Eurozone flash PMIs point to turnaround?
The flash reading of the May PMIs for the Eurozone will be the main focus for the euro next week, as the single currency battles a bullish dollar and political uncertainty in Italy near 5-month lows. The reports from IHS Markit due on Wednesday will include the manufacturing, services and composite PMIs. Both the manufacturing and services PMIs are forecast to slip marginally to 56.0 and 54.6, respectively, in May. Another closely monitored survey will be Friday’s Ifo business confidence gauge out of Germany. The Ifo business climate index is not expected to point to any immediate recovery in economic sentiment in the region either, as it’s forecast to deteriorate further to 101.9 in May.
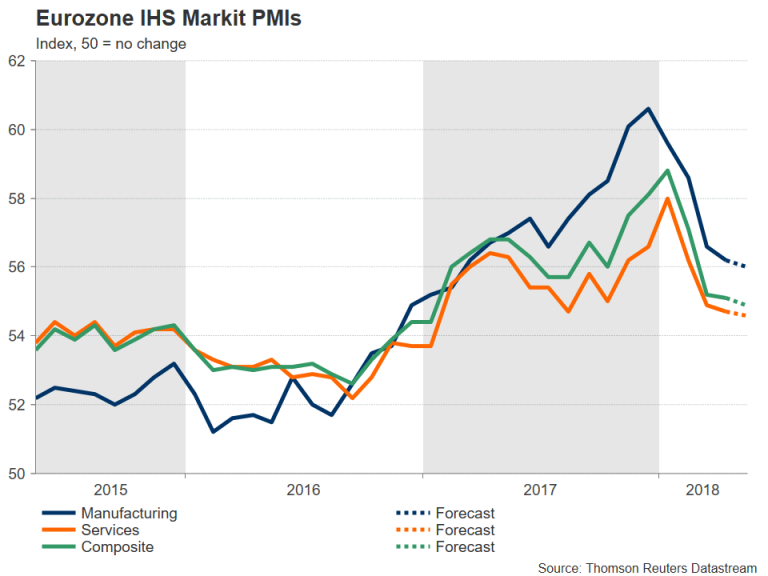
However, the euro could nevertheless get a significant boost from any upside surprises to the data, especially as it’s looking oversold at the moment. Traders should be wary though of a possible knock back from the European Central Bank’s account of the May policy meeting out on Thursday. The minutes are likely to reiterate that underlying inflation in the Eurozone remains low and will avoid a commitment to a QE exit timeline.
UK inflation and retail sales in spotlight
The UK will see some major releases next week with inflation, retail sales and GDP indicators on the agenda. Inflation data for April are due on Wednesday. Last month, an unexpected drop in headline inflation to 2.5% led to a sell-off in the pound, as investors sharply reduced their bets that the Bank of England would raise rates at its May meeting. The 12-month CPI rate is expected to remain unchanged at 2.5% y/y in April, while the core rate is forecast to moderate from 2.3% to 2.2% y/y.
Another weaker-than-expected inflation reading next week would further dent expectations about the BoE raising interest rates anytime soon. However, should the numbers point to an acceleration in consumer prices, the pound would benefit from fresh rate-hike speculation.
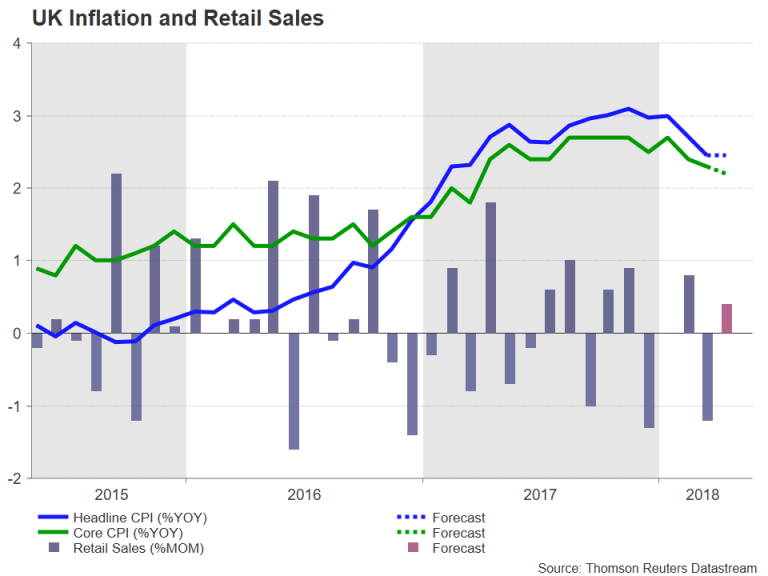
Retail sales on Thursday will also be keenly awaited as any evidence of a pick up in consumer spending would ease concerns about a prolonged slowdown in the UK economy. Retail sales are forecast to rise by 0.4% month-on-month in April, after plunging by 1.2% in March. On Friday, the second estimate of GDP growth for the first quarter will be published. A confirmation of the preliminary 0.1% print isn’t likely to see too much reaction in forex markets, but an upward revision could increase the odds that the BoE would raise rates sooner (August) rather than later (November).
In the meantime, traders will get the chance to hear the latest views from BoE Governor Mark Carney when he testifies before Parliament’s Treasury Select Committee on Tuesday.
Quieter week for the US
US data will take a backseat next week with the main releases consisting of the flash PMIs, housing figures and durable goods orders. IHS Markit will publish its flash PMIs for May on Wednesday. The services PMI is forecast to improve somewhat in May, but the manufacturing PMI is expected to ease slightly, with both indices holding comfortably above the 50-neutral level. New home sales are also due on Wednesday and will be followed by existing home sales on Thursday. Attention will then move on to the April durable goods orders on Friday. Durable goods orders are expected to post a decline of 1.4% m/m in April after two straight months of growth. Also out on Friday, is the final reading of the University of Michigan’s consumer sentiment index for May.
The absence of headline-grabbing data may lead the dollar to a period of consolidation following this week’s strong gains. However, there may still be some fresh buy signals and that could come from the Fed’s minutes of the May 1-2 policy meeting. The minutes, due on Wednesday, will likely flag a rate hike at the next meeting in June and maintain that further gradual increases in the fed funds rate are warranted. Investors will be watching though for any changes to the language used on inflation for clues as to whether the FOMC is tilting towards four rate hikes in 2018.
Weekly Focus: Euro Debt Concerns Return
Market movers ahead
- We expect the US PMI to fall back in May, while the euro area PMI should stabilise after the recent month's weakness.
- We do not expect the minutes from either the Fed (Wednesday) or ECB (Thursday) to change the market's perception of the monetary policy stance in the US and euro area.
- In the UK, we expect inflation to moderate further amid the fading impact of the GBP depreciation.
- Further details on the formation of the new Italian government between the League and Five Star movement will be a key market focus for EUR fixed income markets.
- Keep an eye on the unemployment numbers from Sweden and Norway, where the Swedish numbers might well be the lowest since May 2008.
Global macro and market themes
- Breakthrough in Italian politics but worrying coalition formations have spooked financial markets and Brussels.
- Further EUR weakening in the near term, but stronger in the medium term.
- Substantial deepening of EMU is not looming.