Sample Category Title
GBP/USD Signals Caution as BoE Takes Spotlight
- GBPUSD pulls lower after briefly touching 1.3000 area.
- Overbought signals reflect weakening bullish pressures.
- Buying the dip could be considered above the 200-SMA.
GBPUSD made a modest push into the 1.3000 area following the FOMC policy meeting on Wednesday, which kept the door open for rate cuts amid ongoing uncertainty about the US economic outlook.
The Bank of England is next on the calendar today, and the pair is currently trading moderately lower at 1.2964 after UK claimant counts jumped unexpectedly in February. While the central bank is widely expected to hold rates steady, any shifts in its communication tone in response to trade and geopolitical risks could generate fresh volatility.
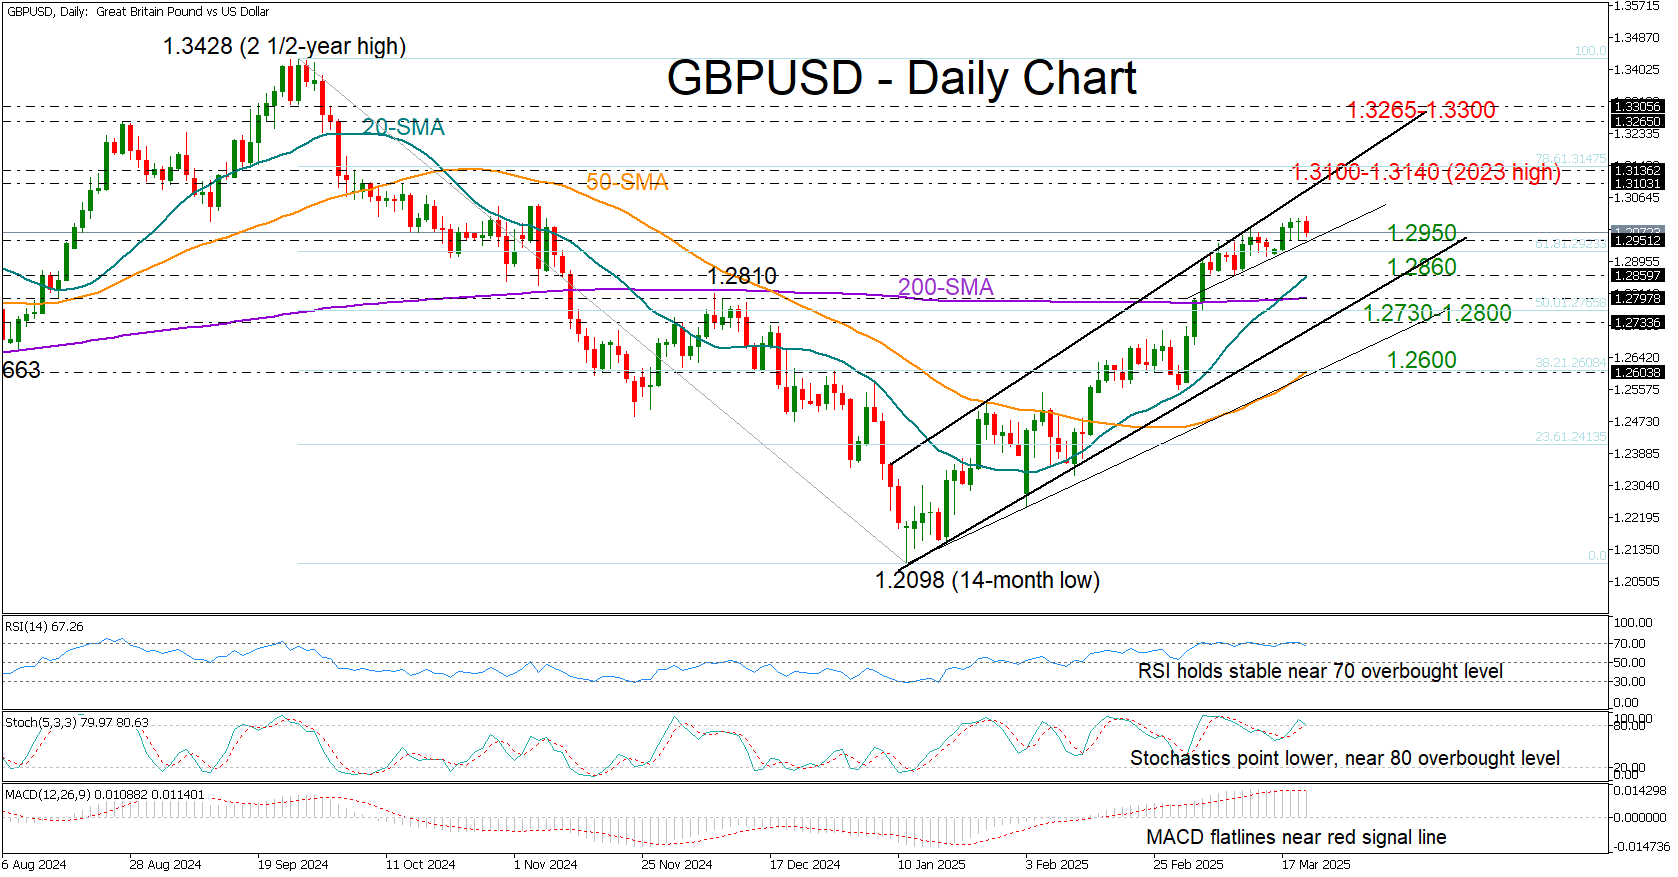
From a technical perspective, the bulls appear to be losing momentum, as indicated by the RSI and Stochastic oscillator, which have been flattening around overbought levels for the past two weeks. If the price slips below 1.2950, the 20-day simple moving average (SMA) could provide support near 1.2860, while the 200-day SMA and the key support trendline at 1.2730 could prevent a further deterioration in the outlook. If these levels fail to hold, the pair could tumble toward the 50-day SMA at 1.2600.
In the bullish scenario where the pair resumes its upward trajectory, initial resistance could emerge from the ascending trendline at 1.3100. The 2023 high of 1.3140 is also within reach and could act as a barrier before the 1.3265–1.3300 caution zone.
Overall, GBPUSD could face some headwinds in the short term, as technical indicators suggest the recent upward movement may be overextended. However, any declines are unlikely to significantly dent market sentiment unless the price drops below the 200-day SMA and the 1.2730 level.
Pound Hits 4.5-Month High: New Peaks on the Horizon
The GBP/USD pair surged to 1.3008 on Thursday, marking its highest level in 4.5 months. This upward momentum has fuelled speculation about additional gains for the British pound.
Global Factors to Drive GBP/USD Movement
The market has largely priced in the US dollar’s decline, which has provided a tailwind for the pound. The UK is in a favourable position amid ongoing global trade tensions. With limited trade ties to the US, the country is less exposed to major tariffs. Its neutral stance on global conflicts further supports the pound’s stability.
Today’s Bank of England (BoE) meeting is unlikely to significantly affect the pound, as markets have already priced in the expectation that interest rates will remain at 4.50%. Investors will instead focus on the BoE’s commentary, which is expected to maintain a cautious tone. Key points of interest include updates on inflation and GDP estimates.
The BoE’s forecasts are expected to remain unchanged, underscoring its data-dependent approach. The central bank’s wording is expected to signal a gradual approach to future rate cuts, reinforcing a measured and cautious monetary stance.
Looking ahead, global developments will have a greater impact on the pound’s trajectory than domestic factors, with its outlook remaining positive given the current geopolitical and economic climate.
Technical Analysis of GBP/USD
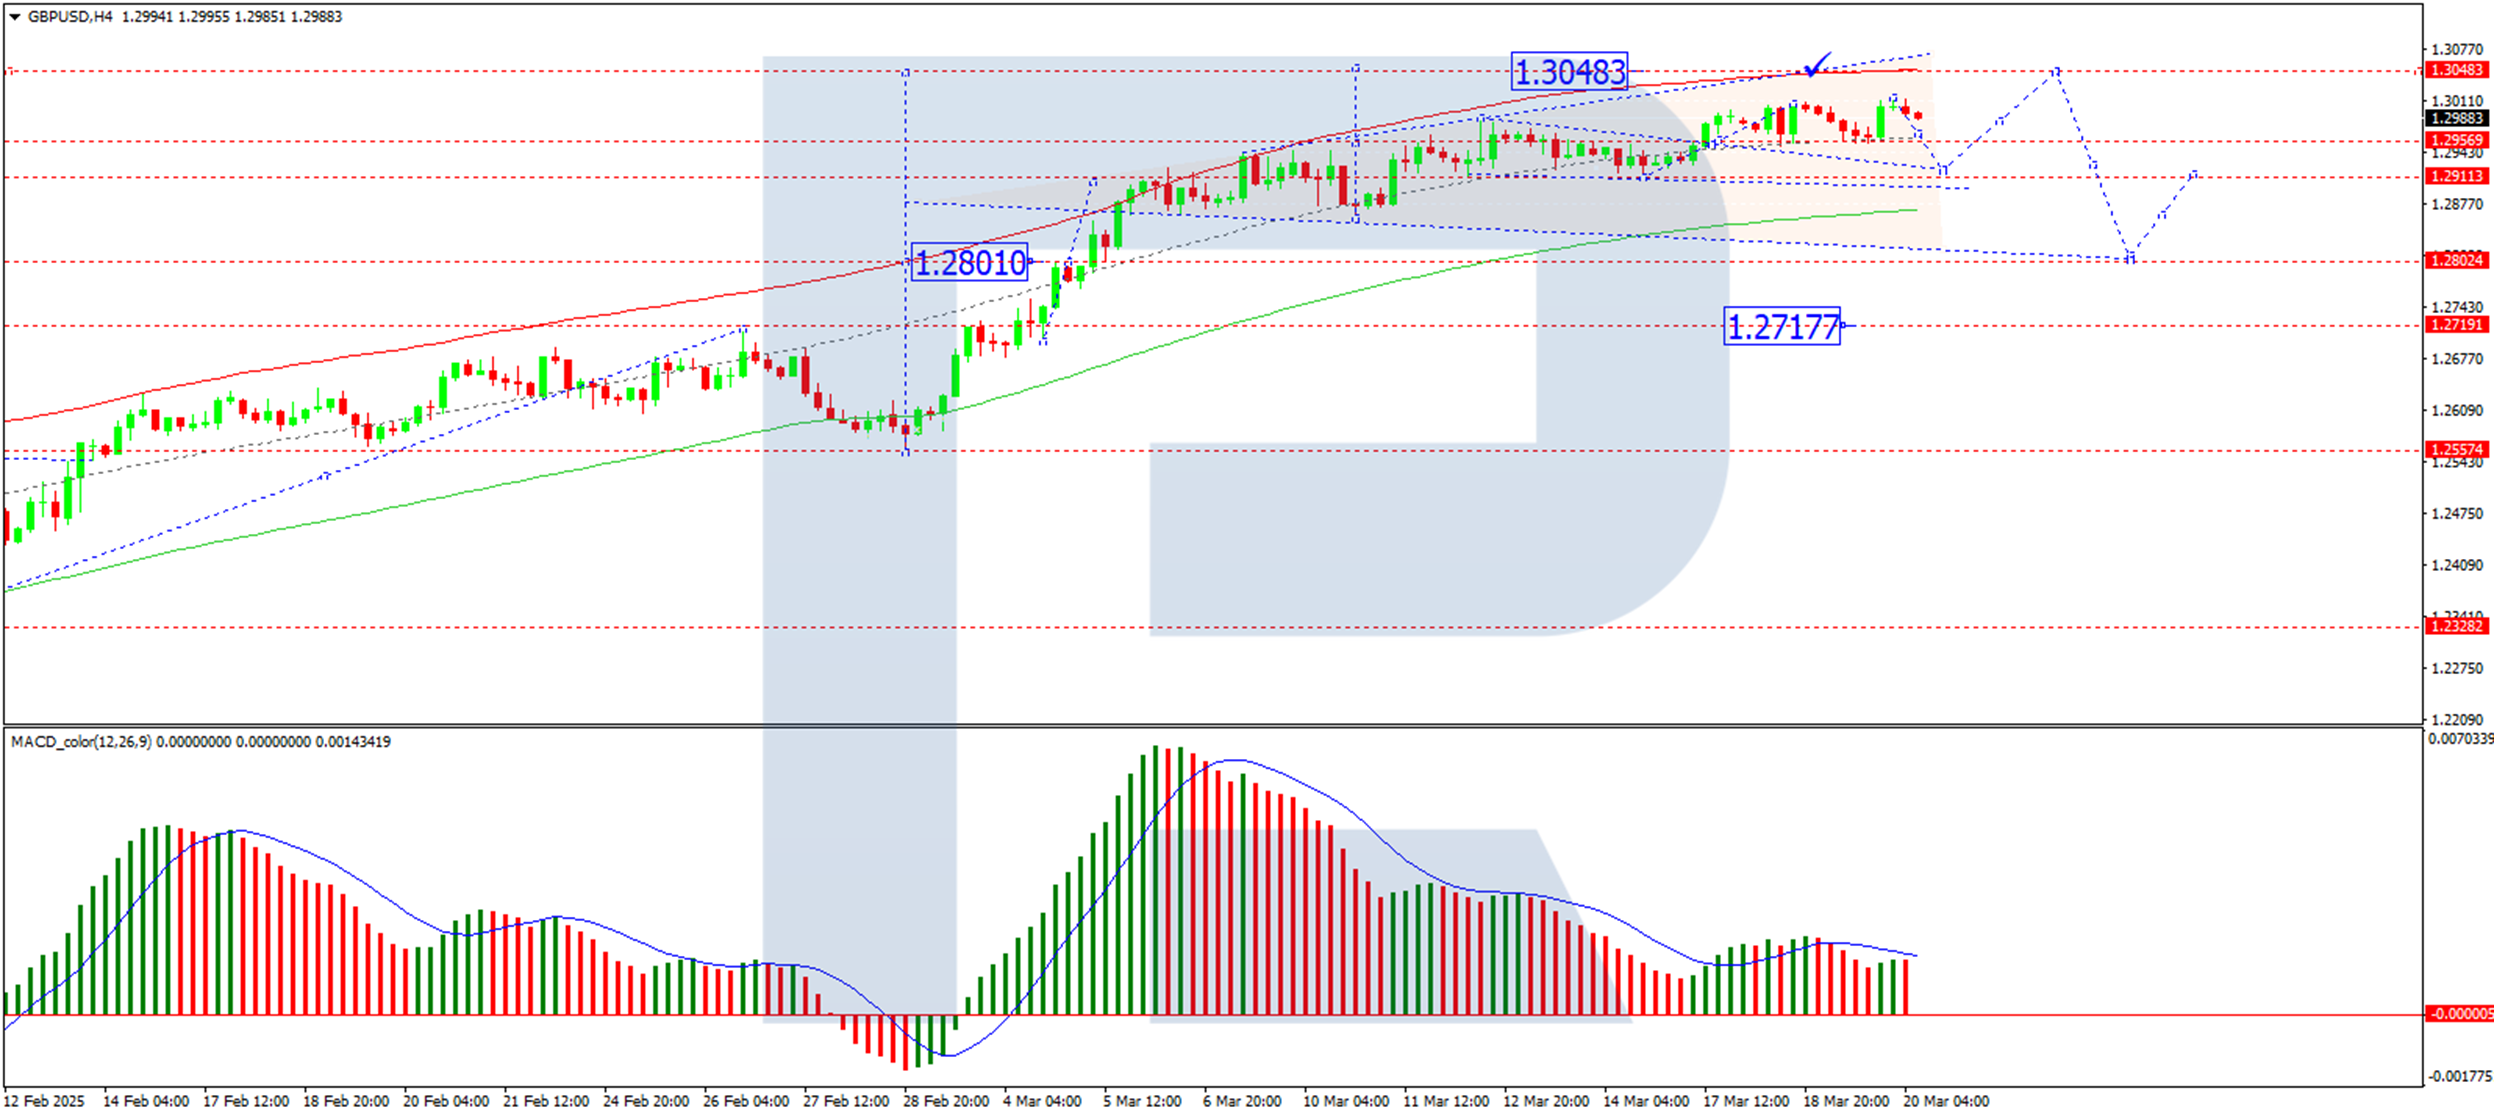
On the H4 chart, GBP/USD completed a growth wave, reaching 1.3013. Currently, the pair is consolidating below this level. A downward extension of the consolidation range to 1.2925 is anticipated, followed by a potential upward wave targeting 1.3048. Beyond this, a downward correction to 1.2800 could materialise. This scenario is supported by the MACD indicator, whose signal line is trending downward toward the zero level.
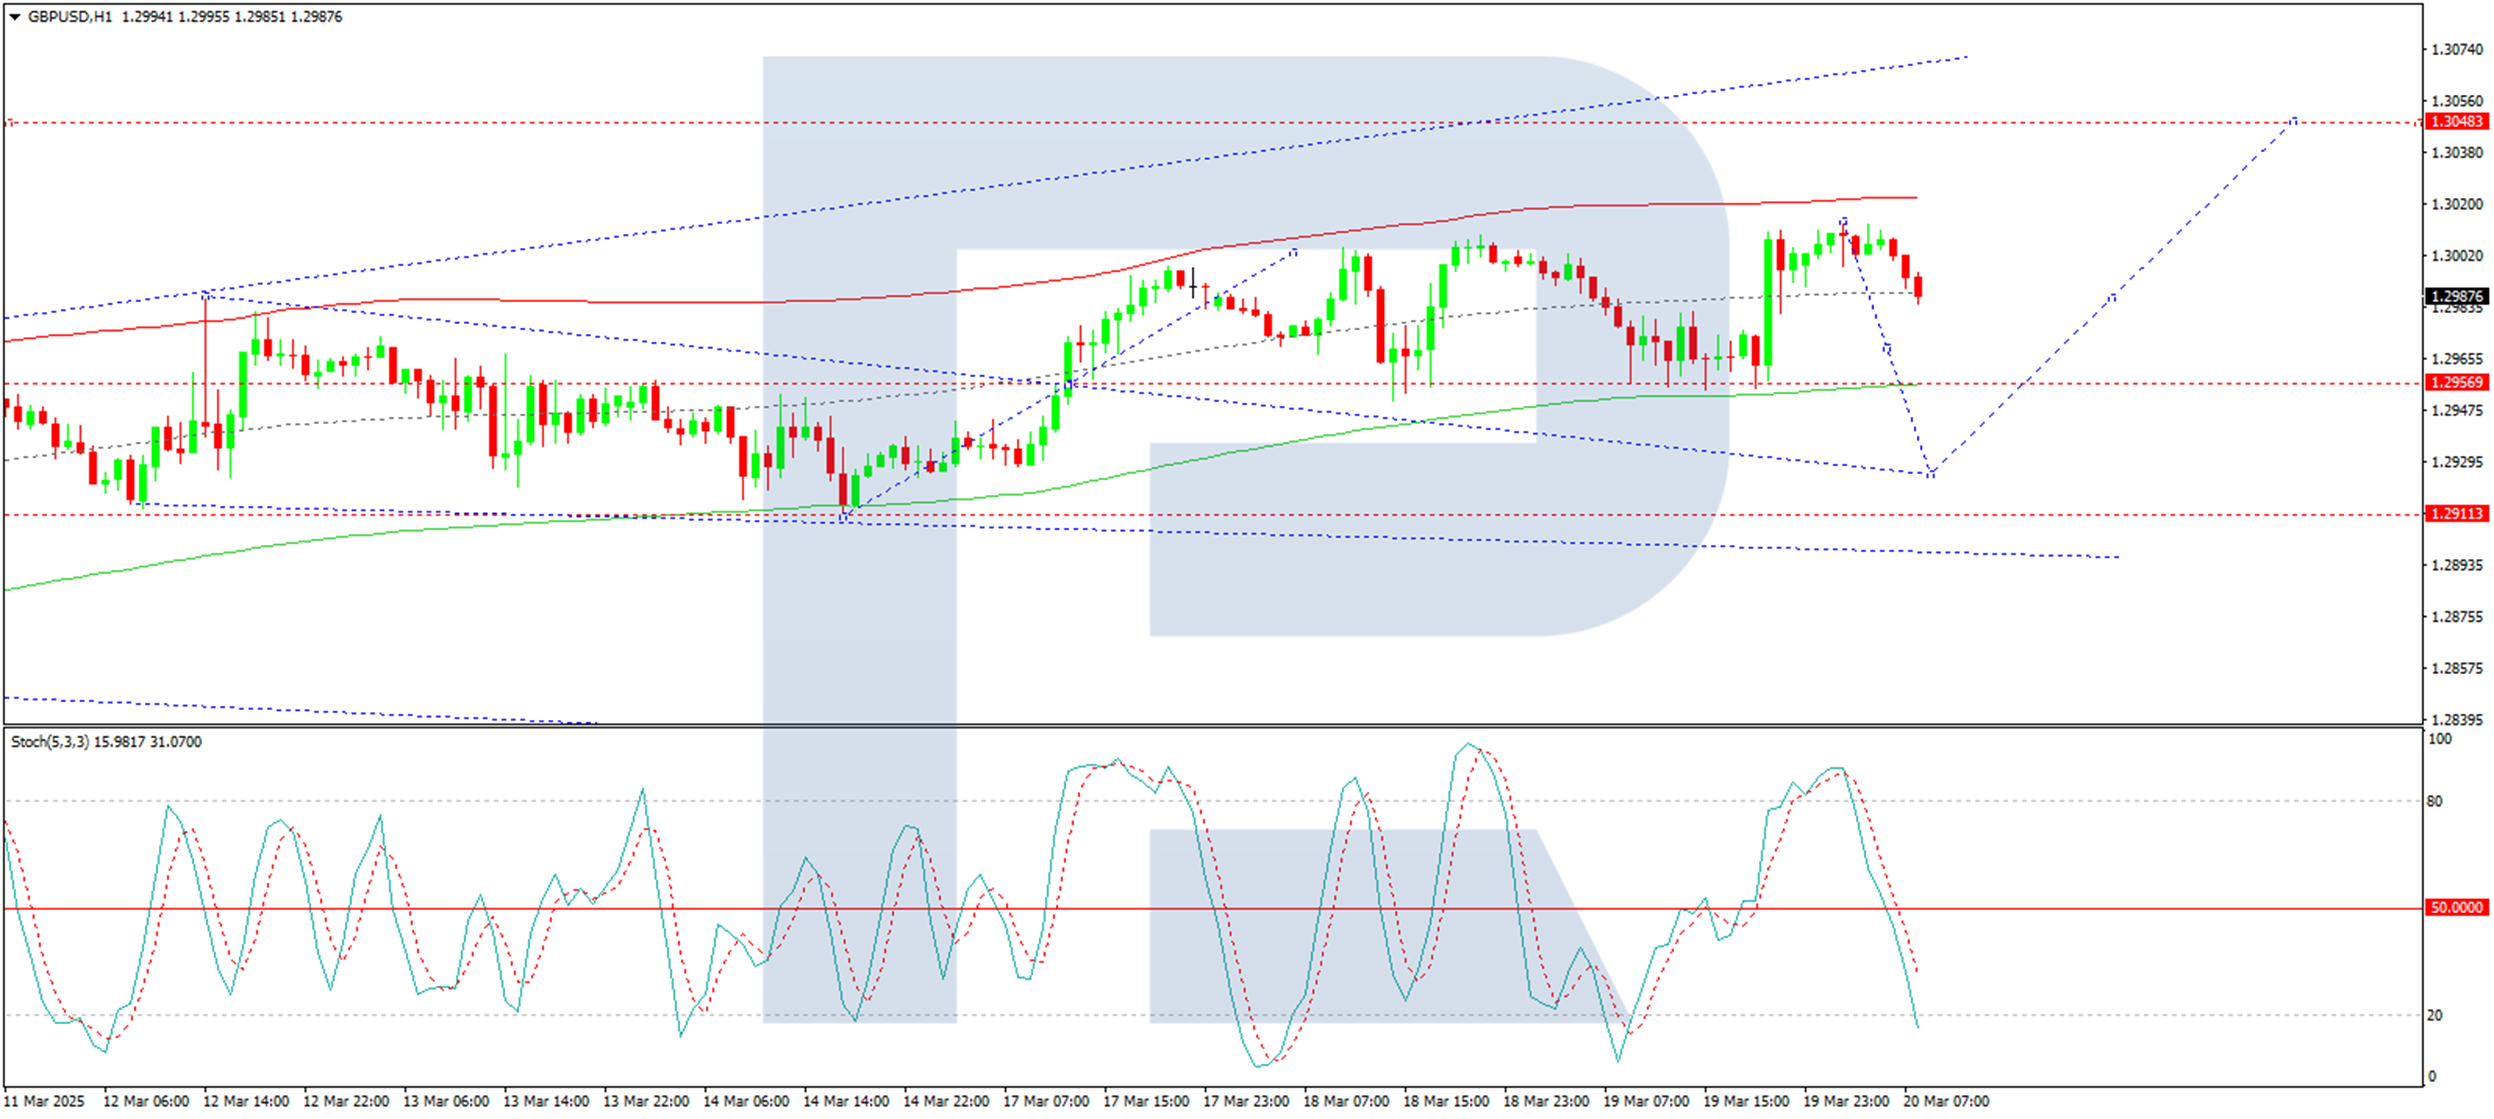
On the H1 chart, GBP/USD is forming a downward wave structure toward 1.2925. Once this wave completes, a move higher to 1.3048 is possible. Further ahead, a decline to 1.2717 remains a possibility. This outlook is corroborated by the Stochastic oscillator, whose signal line is below 50 and trending downward toward 20.
Conclusion
The pound’s recent rally to a 4.5-month high reflects a combination of US dollar weakness and the UK’s advantageous position in global trade dynamics. While the BoE meeting is unlikely to deliver surprises, the central bank’s cautious tone and data-dependent approach will be closely watched. Technically, GBP/USD is poised for further gains, though a corrective pullback is possible. Investors should watch global developments, which will likely dictate the pound’s next moves.
Yen and Euro Strengthen After Fed Meeting
At yesterday’s Fed meeting, contrary to expert expectations, officials left the benchmark interest rate unchanged at 4.50%. The Fed Chair highlighted a high degree of uncertainty in the current state of the US economy due to changes in tariff policy introduced by Donald Trump’s administration. Jerome Powell also noted rising inflation and a possible economic slowdown, stating that officials need more clarity before adjusting monetary policy.
These statements from the Fed contributed to a broad decline in the US dollar.
EUR/USD
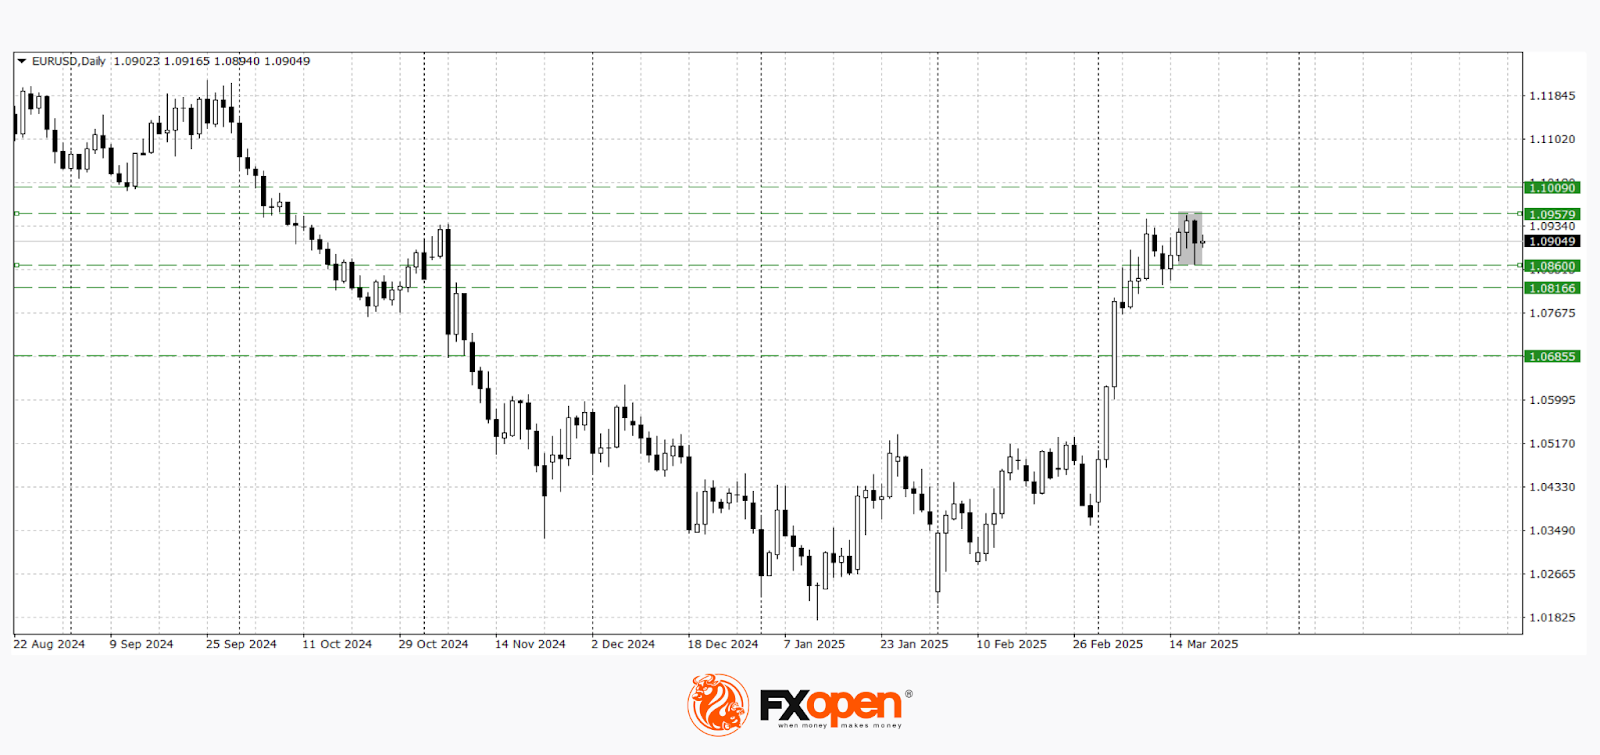
The euro weakened throughout the day yesterday, retreating from its recent highs near 1.0950. After the Fed’s decision, the pair rebounded from 1.0860 and briefly traded above 1.0900.
Technical analysis of EUR/USD suggests the possible start of a downward correction, as a "bearish engulfing" pattern has formed on the daily timeframe. If sellers manage to hold the pair below 1.0860, a retest of the key 1.0800 support level is likely. Conversely, if yesterday’s high is broken, the pair could continue its upward movement towards the psychological level of 1.1000.
Key events that may impact EUR/USD pricing in the upcoming trading sessions:
- Today at 10:00 (GMT+2): Germany Producer Price Index (PPI)
- Today at 11:00 (GMT+2): ECB President Lagarde’s speech
- Today at 12:00 (GMT+2): ECB Monthly Report
- Today at 13:00 (GMT+2): EU Leaders’ Summit
USD/JPY
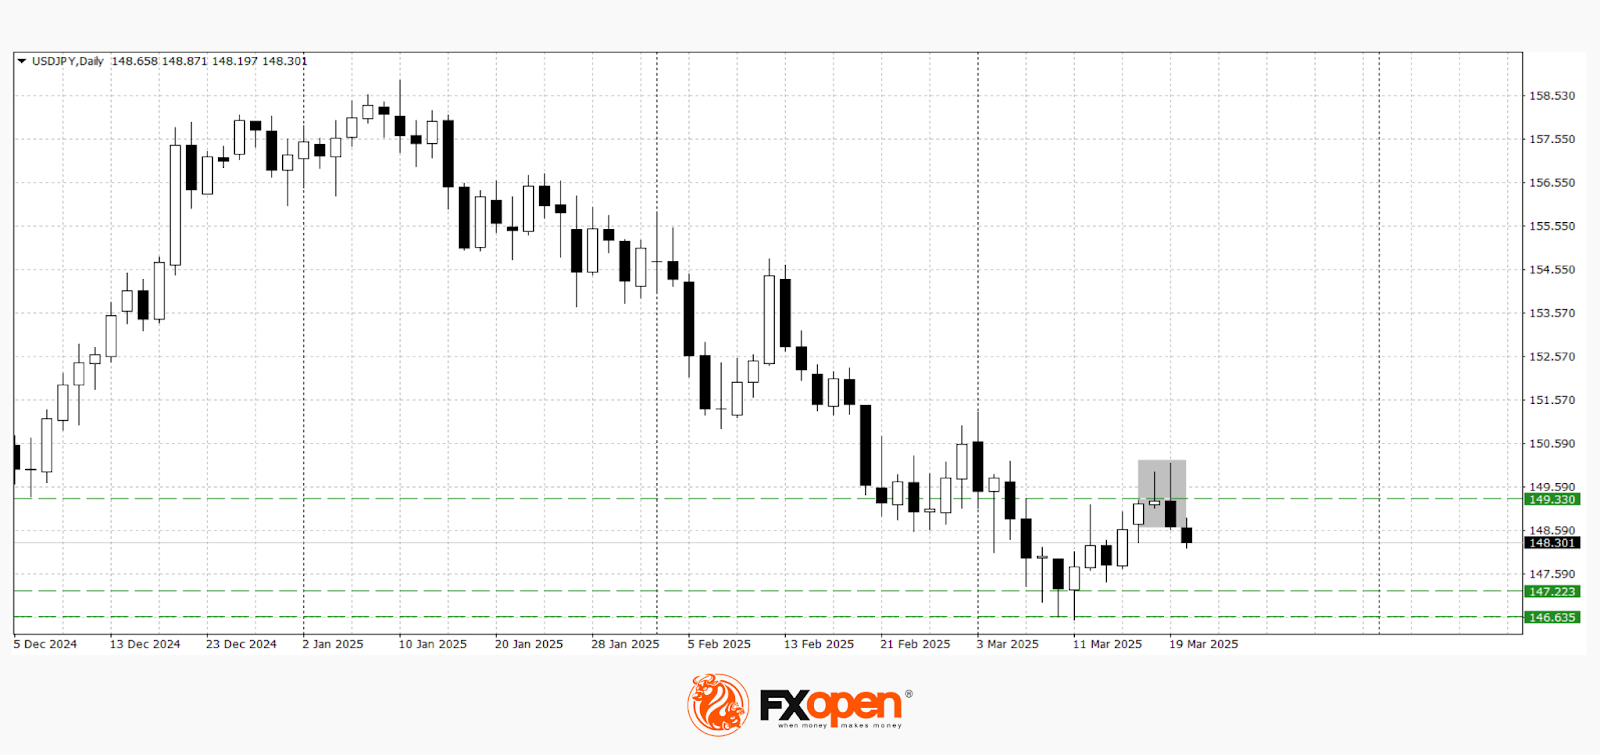
The USD/JPY currency pair tested the psychological resistance level at 150.00 yesterday. However, it failed to strengthen above this level, and a sharp rejection from 150.10 allowed sellers to form a "bearish engulfing" pattern on the daily timeframe.
Technical analysis of USD/JPY indicates a potential decline towards the 148.00–147.30 range. A break above 149.30 would invalidate the bearish scenario.
Key events that may impact USD/JPY pricing in the upcoming trading sessions:
- Today at 15:30 (GMT+2): US Initial Jobless Claims
- Today at 15:30 (GMT+2): Philadelphia Fed Manufacturing Index (US)
- Today at 17:00 (GMT+2): US Existing Home Sales
- Today at 23:30 (GMT+2): US Federal Reserve Balance Sheet
Trade over 50 forex markets 24 hours a day with FXOpen. Take advantage of low commissions, deep liquidity, and spreads from 0.0 pips. Open your FXOpen account now or learn more about trading forex with FXOpen.
This article represents the opinion of the Companies operating under the FXOpen brand only. It is not to be construed as an offer, solicitation, or recommendation with respect to products and services provided by the Companies operating under the FXOpen brand, nor is it to be considered financial advice.
SNB cuts 25bps, flags downside inflation risks and uncertain growth outlook
SNB delivered a widely expected 25bps rate cut, bringing the policy rate down to 0.25%. In its statement, SNB justified the decision by pointing to low inflationary pressures and "heightened downside risks to inflation".
The central bank acknowledged that Switzerland’s economic outlook has become "considerably more uncertain", particularly due to rising global trade tensions and geopolitical risks. The external environment remains a key threat to growth.
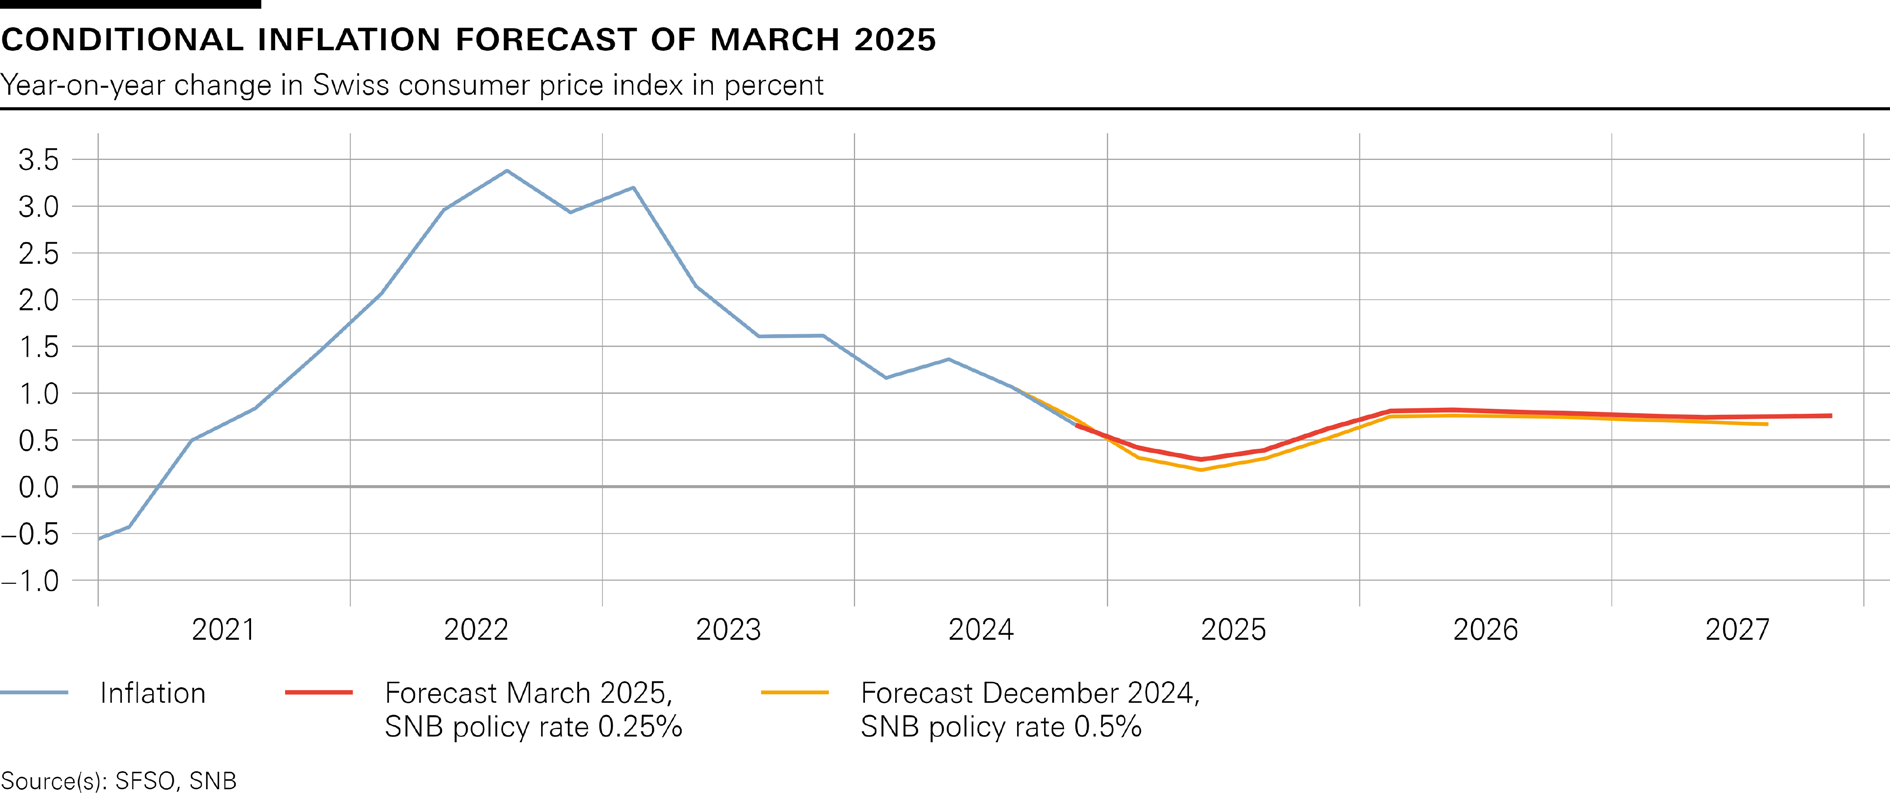
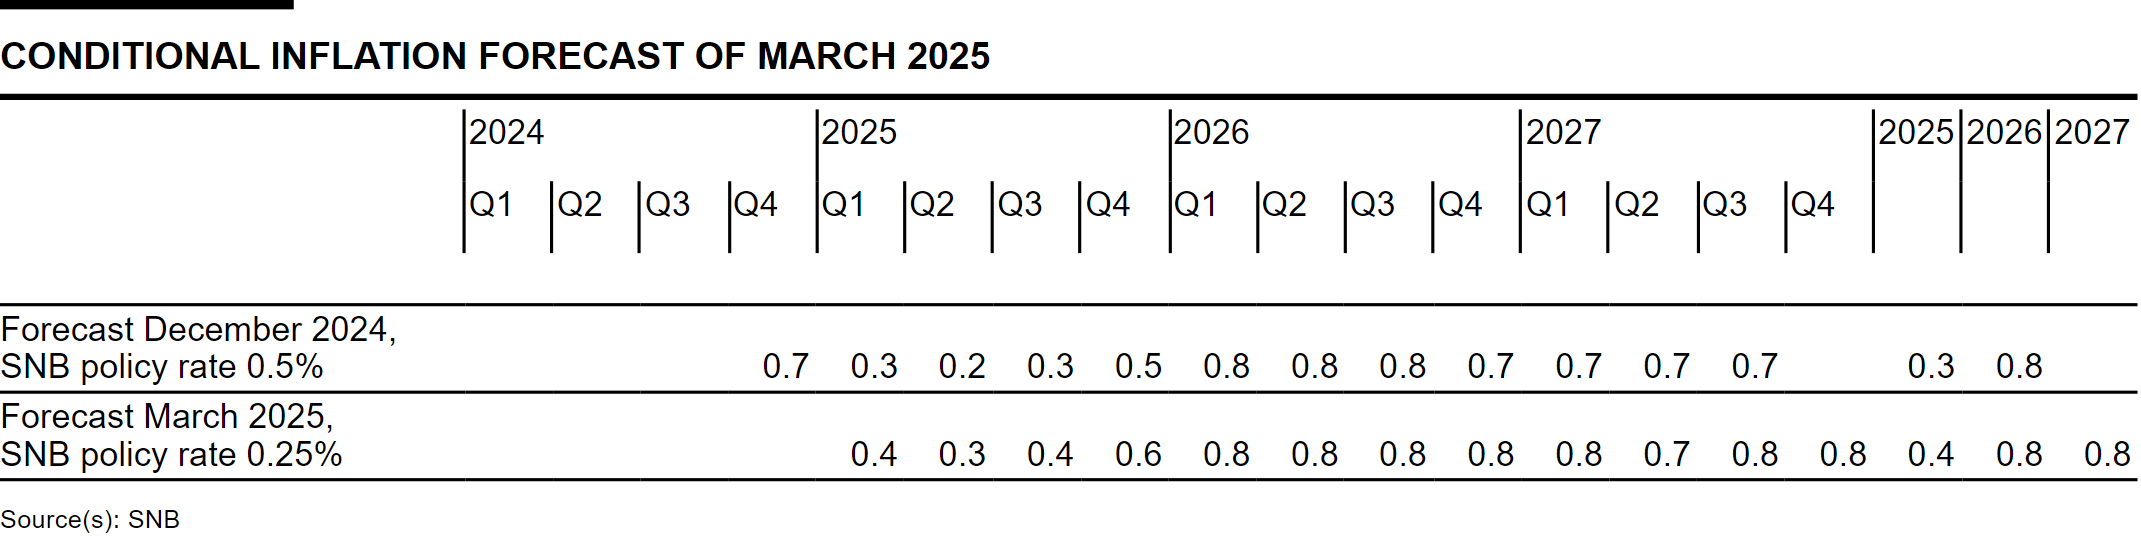
The new conditional inflation forecast suggests that inflation will remain well within its price stability range, averaging 0.4% in 2025, and 0.8% in both 2026 and 2027. These projections assume that the policy rate stays at 0.25% throughout the forecast horizon.
On the growth front, SNB expects GDP to expand between 1% and 1.5% in 2025, with domestic demand benefiting from rising real wages and easier monetary conditions. However, weak external demand is expected to act as a drag on growth. For 2026, SNB anticipates GDP growth of around 1.5%.
(SNB) Swiss National Bank eases monetary policy and lowers SNB policy rate to 0.25%
The Swiss National Bank is lowering the SNB policy rate by 0.25 percentage points to 0.25%. The new policy rate applies from tomorrow, 21 March 2025. Banks’ sight deposits held at the SNB will be remunerated at the SNB policy rate up to a certain threshold, and at 0% above this threshold. The SNB also remains willing to be active in the foreign exchange market as necessary.
With today’s rate adjustment, the SNB is ensuring that monetary conditions remain appropriate, given the low inflationary pressure and the heightened downside risks to inflation. The SNB will continue to monitor the situation closely and adjust its monetary policy if necessary, to ensure that inflation remains within the range consistent with price stability over the medium term.
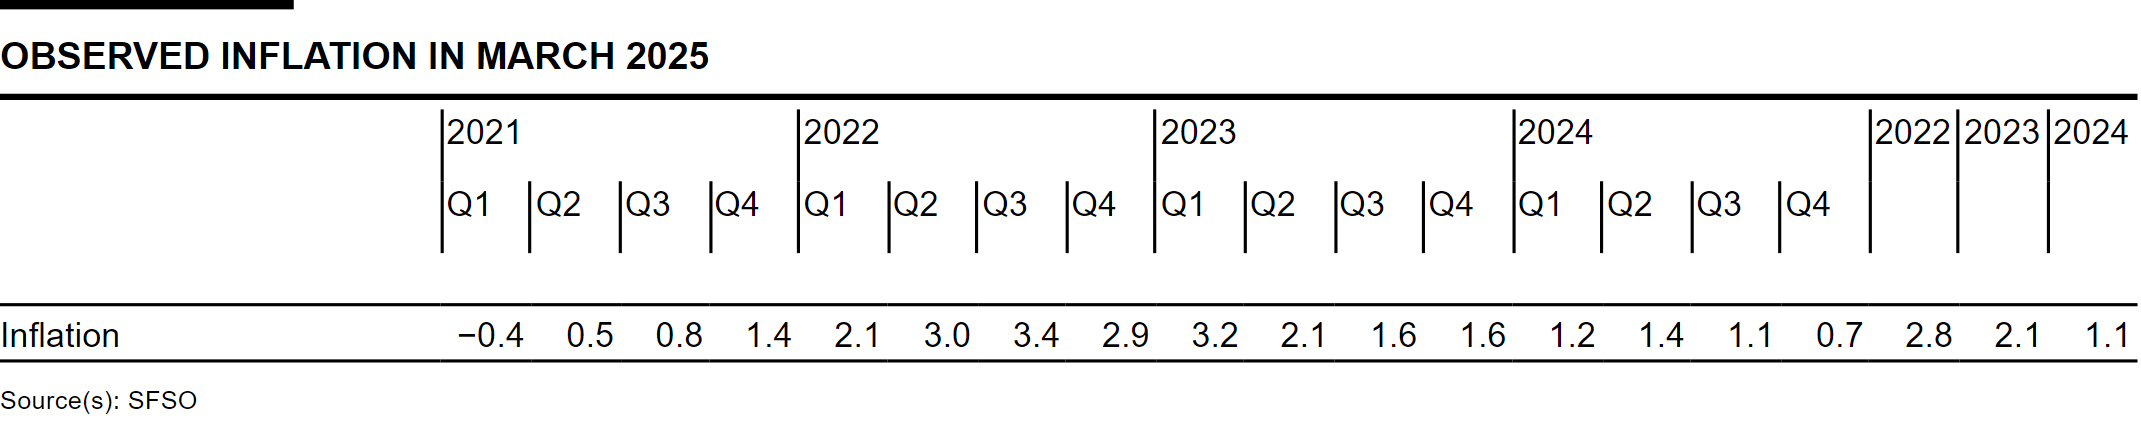
Since the last monetary policy assessment, inflation has developed in line with expectations. It decreased from 0.7% in November to 0.3% in February. This decline is attributable in particular to the drop in electricity prices in January. Overall, inflation is still being driven mainly by domestic services.
The new conditional inflation forecast has hardly changed since December. Without today’s rate cut, the forecast would have been lower in the medium term. The forecast is within the range of price stability over the entire forecast horizon (cf. chart). It puts average annual inflation at 0.4% for 2025, 0.8% for 2026 and 0.8% for 2027 (cf. table). The forecast is based on the assumption that the SNB policy rate is 0.25% over the entire forecast horizon.
Global economic growth was moderate in the fourth quarter of 2024. Inflation recently rose again somewhat in many countries, primarily driven by energy products. Underlying inflationary pressure is still elevated in many countries, albeit less markedly than a few quarters ago. Various central banks have therefore cut their policy rates further.
In its baseline scenario, the SNB anticipates that growth in the global economy will remain moderate over the coming quarters. Underlying inflationary pressure should continue to ease gradually over the next quarters, particularly in Europe.
This scenario for the global economy is currently subject to high uncertainty. The situation could change rapidly and markedly, particularly from a trade and geopolitical perspective. For example, increasing trade barriers could lead to weaker global economic development. At the same time, a more expansionary fiscal policy in Europe could provide stimulus to the economy in the medium term.
Economic growth in Switzerland was solid in the fourth quarter of 2024. The services sector and parts of manufacturing developed favourably. There was a further slight increase in unemployment, while the utilisation of overall production capacity was normal.
The SNB expects GDP growth of between 1% and 1.5% for the current year. Domestic demand is likely to benefit from rising real wages and the easing of monetary policy. By contrast, moderate economic activity abroad looks set to have a dampening effect on foreign trade. In this environment, unemployment is likely to continue to rise slightly. The SNB anticipates GDP growth of around 1.5% for 2026.
The economic outlook for Switzerland has become considerably more uncertain. Against the backdrop of increased trade and geopolitical uncertainties worldwide, developments abroad continue to represent the main risk.
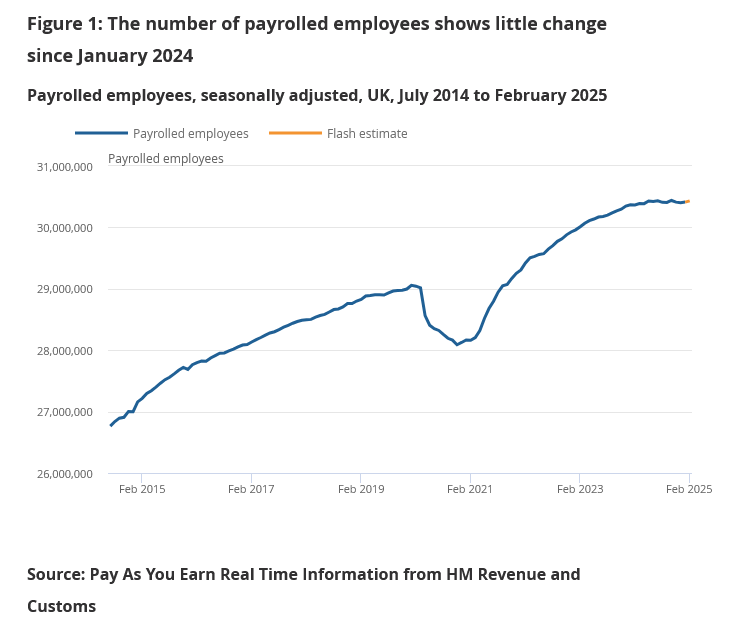
UK payrolled employment rises 21k in Feb, unemployment rate unchanged at 4.4% in Jan
In February, UK payrolled employment rose by 21k (0.1% mom). However, median monthly pay growth slowed to 5.0% yoy from 6.0%, reinforcing signs that wage pressures are gradually easing. However claimant count, surged 44.2k, far exceeding expectations of 7.9k.
In the three months to January, unemployment rate remained unchanged at 4.4%, slightly better than the expected 4.5%. Average earnings including bonuses rose by 5.8% yoy, just below expectations of 5.9%. Excluding bonuses, wages rose 5.9% yoy, in line with forecasts.

EUR/USD Kept the 1.09, But Barely
Markets
The Fed’s policy rate was left unchanged at the March meeting yesterday (4.25-4.5%). The decision was a unanimous one. It was accompanied with a slower pace in QT with the cap on the UST roll-off lowered from $25bn to $5bn. Fed Waller opposed against the latter, favouring to hold the pace steady. The possibility of a slower pace was first discussed in January, amongst others in anticipation of the debt ceiling getting raised at some point in time. After that Treasury is likely to refill their coffers in a frontloading move (thus heavily tapping market liquidity). This could happen as soon as June. The Fed’s updated forecast scream stagflation risks: growth was revised lower to 1.7% this year (from 2.1%) and the economy will no longer expand above potential (1.8%) in the years after. Inflation got a bump mainly for this year (2.7% headline PCE, 2.8% core) amid import tariffs. Chair Powell said these cost push factors were probably “transitory”. In a higher-inflation environment (compared to Trump’s first term), we’re not so sure. Uncertainty on GDP, the unemployment rate and PCE forecasts is very high and risks are heavily skewed to the downside for the first and to the upside for the latter two. Governor’s policy rate forecasts underwent a broad shift higher across the horizon, but median forecasts remain unchanged for now: two cuts in 2025 and 2026 and one more in 2027. That triggered a relief rally in US Treasuries. Powell still held an optimistic view during the presser, which we think doesn’t really capture the forecast narrative. He noted weakness in soft indicators but these are not yet filtering through in the hard data. It’s not until they do that the Fed’s willing to reprioritize growth over inflation. US yields fell between 6.7 and 3.5 bps lower in a bull flattener. Money market expectations stayed broadly unchanged with a first, full cut priced in for July at the earliest. Stocks jumped up to 1.4% (Nasdaq). The dollar retreated from the intraday highs. EUR/USD kept the 1.09, but barely. It’s still struggling this morning ahead of an important EU summit the next two days during which EU leaders are to agree on specific defense spending measures. The EC further detailed its ReArm Europe proposal yesterday. It allows 1.5% of GDP in defense spending to be exempted from the 3% deficit rule for the next four years, starting in 2025. A flurry of ECB speeches are a wildcard for trading. The UK’s labour market report on balance came in close to expectations. But with the Bank of England meeting scheduled later today (status quo expected), sterling’s initial reaction is muted. EUR/GBP trades unchanged around 0.838.
News & Views
The Brazilian central bank hiked its key policy rate as flagged by another 100 bps (third time straight), to 14.25% and bringing the Selic Rate now above the post-Covid peak of 13.75%. Brazilian growth and the labor market remained strong, though there are some early signs of growth moderation. Headline inflation and measures of underlying inflation remain above the inflation target (3% +-1.5%) and have again increased recently. Risks remain tilted to the upside. Inflation expectations moved up further to 5.7% and 4.5% respectively for this year and next and are at risk of deanchoring for longer. Persistent services inflation and a weaker currency (mix from domestic loose fiscal agenda and external trade policies) are threats as well. The BCB commits to another rate hike at its next meeting (May 7) but of a lower magnitude following a small (and premature?!) downward revision to its Q4 2026 inflation forecast from 4% to 3.9%.
The Aussie dollar manages to limit losses this morning (AUD/USD 0.6336) despite a big miss in February labour market figures. Employment fell by 52.8k with consensus expecting 30k growth. January numbers were downwardly revised from 44k to 30.5k as well. Details showed both lower full time occupations (-35.7k) and less part time jobs (-17k). The unemployment rate stabilized at 4.1%, but that was mainly because of a big setback in participation rate, from 67.2% to 66.8%. The Bureau of Statistics specifically referred to fewer older workers (>= 55 years) returning to work in February. We don’t expect this weak figure to derail February RBA plans from gradual rather than consecutive rate cuts. Money markets still bank on a status quo at the next, April 1st , meeting. The kiwi dollar failed to profit from stronger Q4 GDP numbers (+0.7% Q/Q vs 0.4% expected & -1.1% Y/Y) which were mainly boosted by tourism. Domestic demand remained rather soft.
Fed Provides Relief – Focus on BoE and SNB
The Fed
US markets breathed a sigh a relief following the Federal Reserve (Fed) decision. The Fed kept its policy rate unchanged as expected, cut the growth forecast and lifted its inflation outlook quite notably but Chair Jerome Powell stressed out that the potential impact of tariffs on inflation would be ‘transitory’ – implying that the Fed could continue to ease policy to support growth. And more importantly, the Fed decided to reduce the pace of Quantitative Tightening (QT) – a move that eases the tightening of the financial conditions.
As such, the Fed elegantly downplayed the long-term impact of rising inflation while cutting its growth forecast. The dot plot showed that the Fed officials continue to foresee two rate cuts on average this year, and activity on Fed funds futures now gives around 70% chance for the next cut to land in June. The decision was more dovish than expected.
The US 2-year yield slipped below the 4%, the 10-year yield eased below 4.25%. The S&P500 jumped more than 1%, Nasdaq 100 gained 1.30%, the Dow Jones recovered 0.93%, the mid-cap stocks jumped 1.26% while the Russell 2000 led gains with a more than 1.50% rebound on relief that the Fed – though cautious – is not planning to deviate from its rate cutting and policy easing plans, as again, the inflation peak due to tariffs would be ‘transitory’.
In the FX, the US dollar index rebounded on the back of a dovish and supportive Fed stance. It’s important to note that up until recently, the dovish central bank expectations would have a weakening effect on currency valuations as lower yields reduce the natural attractivity of a currency. BUT right now, the currency pricing is influenced by growth expectations. Therefore, a more dovish Fed stance increases US growth expectations, tempers the recession odds, and supports the US dollar.
The ECB
Elsewhere, the EURUSD eased below the 1.09 mark. Inflation in the Eurozone came in lower than previously printed for February, wages and labour costs eased in Q4. The latest data brought the possibility of another rate cut from the European Central Bank (ECB) before it pauses, though pause looks more likely in the next meeting due to massive fiscal spending plans. Either way, optimistic shift in EZ growth expectations remain supportive of the euro against the USD and sterling though the appreciation will likely slow provided that most of the optimism is already priced in.
The BoJ
The USDJPY resisted near the 150 offers and is swiftly sold on Bank of Japan’s (BoJ) decision to maintain its rates unchanged citing the geopolitical and trade uncertainties. Here as well, not rushing toward policy normalization is supportive of growth expectations and the currency.
The BoE
Cable keeps bumping its head against the 1.30 offers before the Bank of England (BoE) decision due today. The BoE is expected to stay seated on its hands at today’s meeting, but the MPC landscape is quite not smooth: 7 members out of 9 will probably vote for no change, while two doves are expected to favour a 50bp cut. Investors are feeling dovish regarding the upcoming BoE meeting given that the British growth numbers have taken a hit from the governments’ tax raising plans while the rising gilt yields decreased the spending potential. And the weakening potential for government spending increases the BoE’s ability to support the economy with a more supportive monetary policy, and that could be positive for sterling. But yes, it’s a bit stretched. If sterling breaks the back of the 1.30 offers against the US dollar, it will be thanks to a stronger depreciation of the US dollar than conviction in sterling.
And the SNB
Last but not least, the Swiss National Bank (SNB) is expected to announce a 25bp cut today. Mounting geopolitical and trade tensions between the U.S. and the rest of the world have largely kept neutral, non-EU Switzerland out of the direct line of aggressive tariffs. The Swiss franc has strengthened against the dollar since the start of the year while losing ground against the euro—its biggest trade partner.
This is the best of both worlds for Switzerland: a stronger franc against the dollar helps keep energy prices and inflation in check, while a softer franc against the euro preserves what remains of Swiss competitiveness against European peers, or at least prevents further deterioration.
The SMI index has gained almost 14% since the start of the year, as Swiss companies benefited from sectoral rotations. The high concentration of defensive names—such as pharmaceuticals and consumer staples—positions Swiss stocks well. Additionally, Switzerland’s diplomatic relations with the Trump administration remain manageable for now.
As such, the SMI could continue to benefit from rising appetite for defensive and value stocks, as well as a supportive SNB policy. Rates in Switzerland will likely stay low as long as inflation remains in check—and inflation is now back to 0.4% year-on-year. We maintain our preference for Swiss stocks.
Central Bank Rate Decisions in the Spotlight
In focus today
Today we receive rate decisions from the Bank of England (BoE), the Swiss National Bank (SNB) and the Riksbank.
We expect the BoE will keep the Bank Rate unchanged at 4.50% in line with consensus and market pricing. Additionally, we anticipate the BoE will stick to its previous guidance noting that "a gradual approach to removing monetary policy restraint remains appropriate".
For the SNB, we expect they will cut the policy rate by 25bp to 0.25% as inflation pressures remain muted, hovering in the lower end of the target range. Markets also favour a cut, pricing in roughly 20bp for the meeting.
We think the Riksbank will stay on hold at 2.25% and present a completely flat rate path, which is widely expected. However, we believe the risk is more likely to lean towards a dovish surprise rather than a hawkish one, considering that market pricing is slightly inclined towards the next move being a rate hike.
Norges Bank will release the Regional Survey today. We will keep an eye on the growth prospects for both Q1 and Q2. Based on leading indicators, we expect the expectations to be around 0.3-0.4% q/q, which should be well in line with Norges Bank's forecast from the December MPR. But we will put more emphasis on the capacity metrics this time around, as they are paramount for the inflation and hence rate outlook in the medium turn. This could prove decisive ahead of the monetary policy meeting next week after the latest inflation numbers.
Economic and market news
What happened overnight
In China, the People's Bank of China kept Loan Prime Rate 1Y and 5Y steady at 3.10% and 3.60% respectively. This was widely anticipated by markets and the market reaction was muted. Economic data on the Chinese economy at the start of the year was a mixed bag.
What happened yesterday
In the US, the FOMC meeting in the evening concluded with an unchanged rate decision from the Fed as widely expected. Powell sent a message as balanced as it could be. Not downplaying any downside risks but also emphasising that the Fed is not in a hurry to move. Markets reacted with lower rates, weaker USD and stronger equities. We maintain our call for the next cut in June, and a total of three cuts this year. Read more in our Fed review: Cautious stability, 19 March.
In Ukraine, the call between President Zelenskiy and President Trump was spent aligning both Russia and Ukraine in terms of their requests. We see the latest developments, namely the outcome from the Zelenskyi-Trump call yesterday, as positive for Ukraine, and for the broader long-term security in Europe. The White House is now saying their focus has shifted from the minerals deal to discussing the long-term peace deal. The limited ceasefire now seems possible in our view, but the road to a sustainable peace is still a long and rocky one, not least because there is no consensus on any credible security guarantees for Ukraine.
Equities: Global equities ended higher yesterday, with the US leading advances, closing near the day's high and interpreting the Fed's message rather positively. With the VIX ticking lower, cyclicals outperforming alongside small caps, and positive stories surrounding the MAG 7, we are likely seeing more US retail investors engaging in the buy-the-dip strategy.
In Europe, there was a slight "sell the fact" movement, with Germany lagging behind after its stellar performance, where the DAX is up 17% year-to-date. In the US yesterday: Dow +0.9%, S&P 500 +1.1%, Nasdaq +1.4%, Russell 2000 +1.6%.
Asian markets are split this morning, with both China and Japan being lower, while most other markets are higher.
European futures are unchanged (DAX slightly lower), while US futures are higher, led by the tech sector, not least due to the ambitious investment stories circulating around Nvidia.
FI&FX: This week's bunch of central bank decisions kicked off with the BoJ and the Fed yesterday - both held interest rates unchanged. USD/JPY did not move on the BoJ decision but fell below 149 after US interest rates dropped in response to the slight dovish signals from the Fed. EUR/USD was steady around the 1.09 level. EUR/SEK rose above the 11.00 level again ahead of the Riksbank rate decision today.
GBP/JPY Daily Outlook
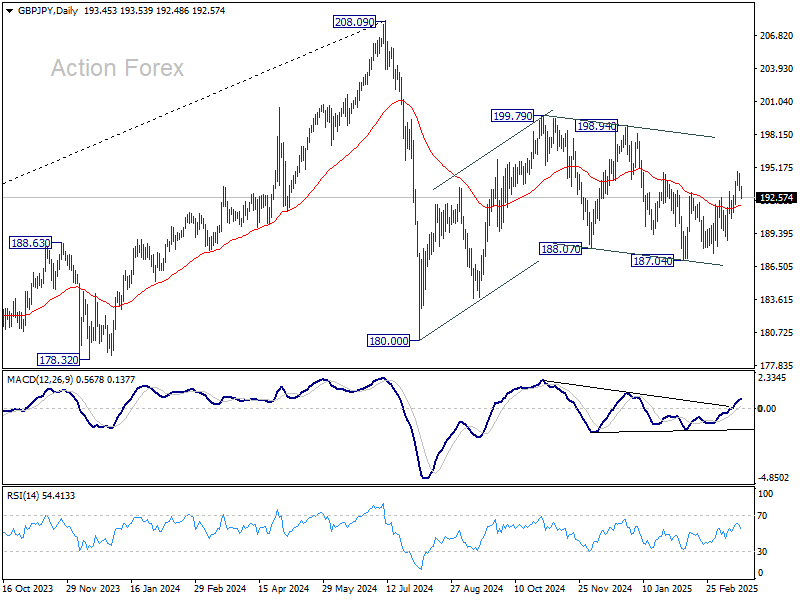
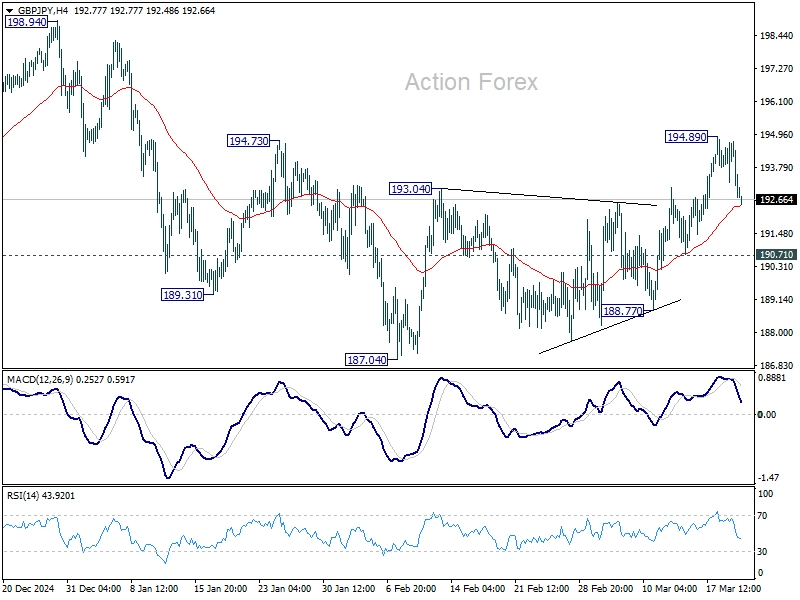
Daily Pivots: (S1) 192.83; (P) 193.77; (R1) 194.29; More...
Intraday bias in GBP/JPY is turned neutral again with current retreat. On the upside, break of 194.89 will resume the rebound from 187.04 to 198.94/199.79 resistance zone. Nevertheless, break of 190.71 support will turn bias back to the downside for 188.77. Overall, corrective pattern from 208.09 is still in progress, with price actions from 180.00 as the second leg.
In the bigger picture, price actions from 208.09 are seen as a correction to rally from 123.94 (2020 low). Strong support should be seen from 38.2% retracement of 123.94 to 208.09 at 175.94 to contain downside. However, sustained break of 152.11 will bring deeper fall even still as a correction.