Sample Category Title
Gold Slide Continues as US Dollar Shines, Fed Meeting Next
Gold prices continue to slide on Tuesday, as the base metal has shed 1.4% so far this week. In North American trade, the spot price for an ounce of gold is $1304.85, down 0.82% on the day. On the release front, the ISM Manufacturing PMI also disappointed, dropping to 57.3 points. This was short of the forecast of 58.4 points. On Wednesday, market attention shifts to US employment indicators in the latter part of the week, starting with ADP Nonfarm Employment Change. As well, the Federal Reserve will release a rate statement.
The US dollar continues to gain ground, and that has been bad news for gold prices. Gold has plunged 3.4% since April 16 and is likely to fall below the symbolic $1300 level, for the first time since late December. There are a number of factors weighing on gold prices. Investor risk appetite remains strong, as tensions in the Korean peninsula have dropped rapidly. The leaders of North and South Korea met last week for a historic meeting, and US President Trump is scheduled to meet with North Korean leader Kim in the near future. On the domestic front, the US economy continues to perform well and inflation is moving higher. This has raised expectations that the Federal Reserve will raise rates four times in 2018, which is bullish for the US dollar.
The markets are keeping a close eye on the Federal Reserve, which winds up its monthly policy meeting on Wednesday. The Fed is expected to maintain the benchmark rate at a range between 1.50% and 1.75%, and analysts will be keeping a close eye on the rate statement – a hawkish statement could propel the US dollar to higher levels. There is growing sentiment that the Federal Reserve will raise interest rates four times this year, although Fed policymakers have not changed their forecast of three increases in 2018. One scenario envisions the Fed raising rates once each quarter until the economy shows signs of slowing down. If inflation continues to move higher and economic conditions remain strong, the dollar should continue to perform well against the euro and other major currencies.
ISM: Continued Growth as Input Prices Rise
The ISM purchasing managers index came in at 57.3—a moderation in line with regional indices. Production, new orders and employment remain in expansion mode. Problems are still brewing in the rise in prices paid.
Growth Remains the Headline Story: But What About Prices?
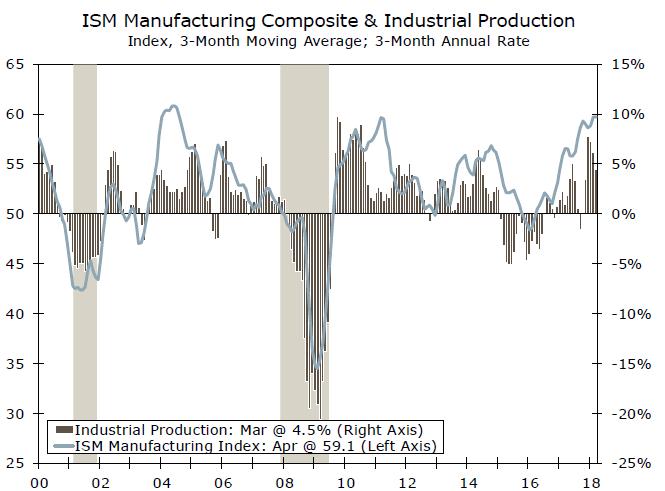
Moderation in the ISM index is in line with regional indices, while remaining consistent with GDP growth. Seventeen of 18 industries reported growth in April, a repeat from March, led by wood, electrical equipment, appliances and fabricated metals. As seen in the top graph, the ISM manufacturing index is consistent with gains in industrial production this year.
For the ISM production subcomponent, the index had been above 60 for ten straight months but dipped to 57.2 in April. The ISM report reiterated last month's concerns that labor constraints and supply chain disruptions are limiting production potential. Fifteen industries reported growth in production, led by furniture, apparel and electrical equipment.
Employment registered 54.2 in April and has been above the 50 breakeven level since October 2016. Twelve of the 18 industries reported growth in employment, including paper, fabricated metals and machinery. Our outlook remains for near three percent GDP growth for the rest of 2018.
New Orders: Signal for Continued Growth Ahead
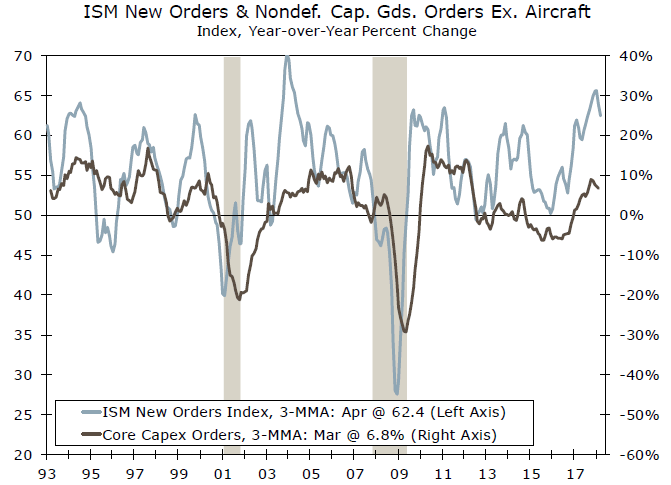
New orders registered 61.2 in April, a slight dip from 61.9 in March, but continues to signal growth in new orders by remaining above 60 since April 2017. The index corroborates the gains in core capital goods orders shown in the middle graph. Sixteen of the 18 industries reported growth in new orders, including wood, furniture, plastics and rubber.
Prices Paid a Warning Sign for Profits—and Trade
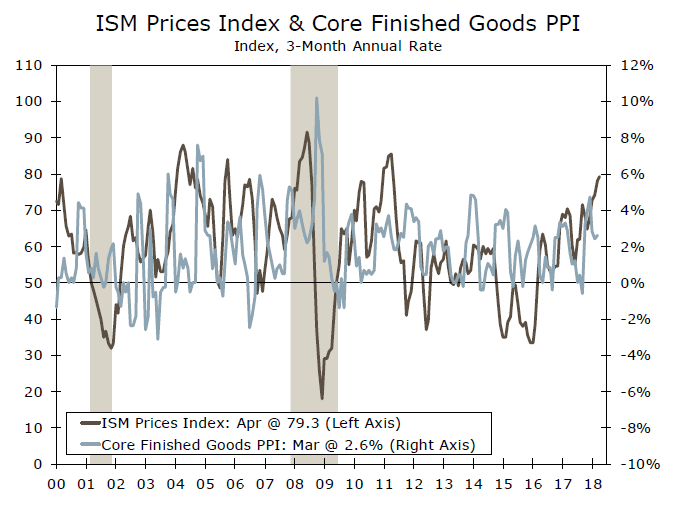
The prices index has been above 70 all year, rising to 79.3 in April, which is the highest print in seven years. The rise in the index follows the path of core finished goods PPI (bottom graph). In April, 61.2 percent of respondents reported paying higher prices. Of the industries, seventeen reported paying higher prices, including apparel, textile mills, furniture, fabricated metals and electrical equipment.
To corroborate the price pressures, supplier deliveries remained above 60 for the third consecutive month, indicating slower deliveries to meet orders. Sixteen industries reported slower deliveries, including apparel, machinery, fabricated metals and textiles. Commentary from survey respondents highlighted the issue of labor shortages, transportation delays and tariff uncertainties.
This report reinforces our outlook for continued increases in the PCE deflator and the employment cost index for 2018. While output has improved, the bigger story from the ISM release is the rise in uncertainty on supply chain availability and rising prices paid for inputs. Higher input prices could weigh on profit margins, causing upward pressure on inflation. Similarly, a higher level of uncertainty will impact economic actions going forward and, in our view, lead to higher inflation and thereby continued Fed rate increases this year.
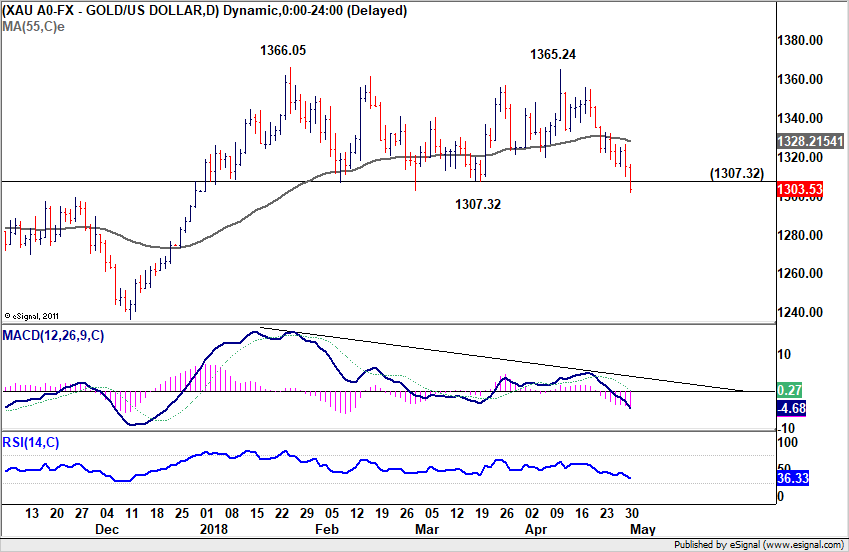
Gold completes double top, threatening 1300 psychological support.
Gold tumbles sharply today on the back of broad based strength in USD. 1300 handle is now at risk . And, considering the break of 1307.32 support, a double top bottom should be formed (1366.06, 1365.23). 1300 will likely be taken out with relative ease.
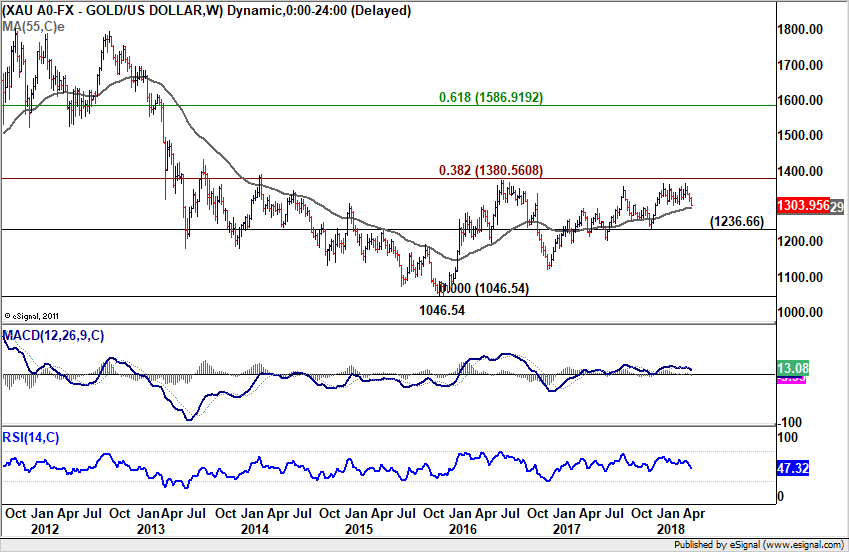
More importantly, gold could have been rejected by key fibonacci level of 38.2% Retracement of 1920.94 (2012 high) to 1046.54 (2015 low) at 1380.56 again. 55 week EMA (now at 1296.08) is the first point of support. 1236.66 is the second point of key support. It's early to say, but firm break of 1236.66 will pave the way to retest 1046.54 low.
Pound Stumbles to 4-Month Low as Manufacturing PMI Slips
The US dollar has steamrolled the British pound in the Tuesday session. In North American trade, the pair is trading at 1.3599, down 1.18% on the day. On the release front, British Manufacturing PMI fell to 53.9, well below the estimate of 54.8 points. Consumer lending dropped to GBP 4.2 billion, missing the estimate of GBP 4.9 billion. In the US, the ISM Manufacturing PMI also disappointed, dropping to 57.3 points. This was short of the forecast of 58.4 points. On Wednesday, Britain releases Construction PMI. Market attention will shift to US employment indicators in the latter part of the week, starting with ADP Nonfarm Employment Change. As well, the Federal Reserve will release a rate statement.
The pound continues to struggle as the currency has fallen to its lowest level since the first week in January. The pound plunged on Tuesday, after a weak reading from Manufacturing PMI. The indicator fell to 53.9, marking a fifth consecutive drop. This was its lowest level since November 2016. Investors have not taken kindly to soft numbers, as the pound also recorded sharp losses on Friday, after the release of Preliminary GDP. This first estimate of GDP posted a negligible gain of 0.1%, missing the estimate of 0.3%. The poor performance of the economy in the first quarter has dampened expectations that the BoE will raise rates at next week’s rate meeting, with the odds of a hike plunging to 20%, compared to 90% at the beginning of April. Most analysts expect the BoE to delay a rate hike until the second half of the year, with August or November being the most likely months for a rate hike. This sentiment sent the pound lower on Friday and the currency declined 1.6% last week. Currently, GDP/USD is trading at its lowest level since the end of February.
All eyes will be on the Federal Reserve on Wednesday when it concludes a 2-day policy meeting. The markets are expecting the Fed to maintain the benchmark rate at a range between 1.50% and 1.75%, and analysts will be keeping a close eye on the rate statement – a hawkish statement could propel the US dollar to higher levels. There is growing sentiment that the Federal Reserve will raise interest rates four times this year, although Fed policymakers have not changed their forecast of three increases in 2018. One scenario envisions the Fed raising rates once each quarter until the economy shows signs of slowing down. If inflation continues to move higher and economic conditions remain strong, the dollar should continue to shine against its major rivals.
US: Manufacturing Activity Remains Robust but Expands at a Slower Pace in April
The Institute for Supply Management (ISM) index of manufacturing for April declined two points to 57.3, slightly worse than market expectations of a one point decline to 58.3. Despite the decline, the index remains in expansionary territory for the 20th consecutive month.
All of the subindices that comprise the headline index recorded declines in the month, with the exception of supplier deliveries (+0.5 to 61.1). The three largest declines (indicating decelerating growth) occurred in the production (-3.8 to 57.2), employment (-3.1 to 54.2), and inventories (-2.6 to 52.9) subindices.
Prices paid rose 1.2 points to 79.3, hitting yet another new cycle high and the highest level since April 2011 (82.6). Survey respondents reported rising commodity prices across industry sectors, while also reporting shortages of capacitors, electrical components, resistors, and hot rolled steel.
The spread between new orders and inventories – a good leading indicator of activity – rose to 8.3 (+1.9 points) in April, owing to the decline in inventories outpacing that for new orders. Overall this indicator remains consistent with manufacturing activity continuing to expand through the first half of 2018.
Of the 18 reporting manufacturing industries, 17 recorded growth in April. No industries reported a decline in the month.
Key Implications
The hot U.S. manufacturing sector appears to be reaching its maximum current capacity limit. Survey respondents report strong demand from domestic and foreign sources, but labor and component shortages are starting to take their toll on production. As a result delivery times, the backlog of orders, and input prices all continue to rise.
Although steel and aluminum tariffs have yet to take effect, with most advanced economy trade partners largely exempt for at least another month, they continue to drive anxiety in manufacturers about shortages of steel, driving up the price of the commodity. Moreover, the announced tariffs appear to be affecting expansion plans, with at least one survey respondent citing that 'business planning is at a standstill until [the tariffs] are resolved'.
With manufacturing activity slowing from a very strong pace of expansion in Europe, many are worried that global economic momentum is starting to slip. We continue to anticipate global growth to expand 3.8% in 2018, but momentum has clearly slowed a touch earlier than anticipated in Europe and some other regions. While the proposed tariffs announced by the U.S. administration remain more bluster than bite, they are acting to elevate economic policy uncertainty and denting business confidence both domestically and abroad.
USD/CAD Mid-Day Outlook
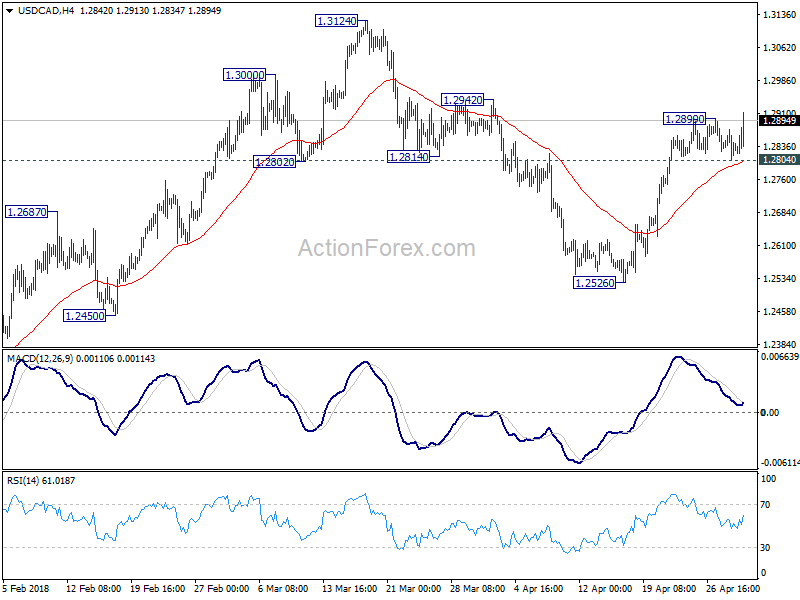
Daily Pivots: (S1) 1.2805; (P) 1.2839; (R1) 1.2875; More....
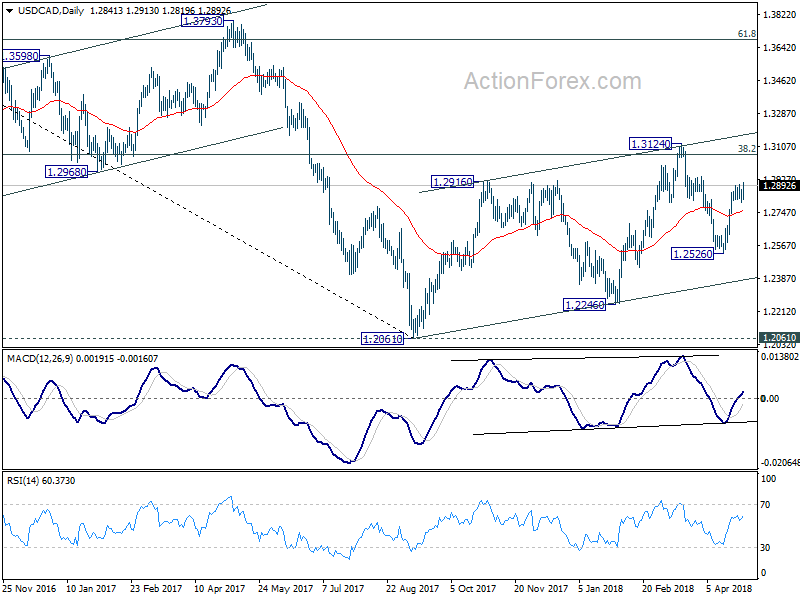
USD/CAD's rally from 1.2526 resumes by taking out 1.2899 and hits as high as 1.2910 so far. Intraday bias is back on the upside for 1.3124 resistance. On the downside, below 1.2804 minor support will turn intraday bias neutral again and bring another consolidation.
In the bigger picture, current development suggests that rebound from 1.2061 has not completed yet. Focus is back on 38.2% retracement of 1.4689 to 1.2061 at 1.3065. Sustained trading above there will confirm medium term bullish reversal. That is, down trend from 1.4689 has completed at 1.2061 already. In that case, next target will be 61.8% retracement at 1.3685.
Dollar accelerates as ISM manufacturing prices paid hit highest since April 2011
US ISM manufacturing index dropped to 57.3 in April, down from 59.3 and missed expectation of 58.5. That' the lowest level in 9 months. Price paid component rose to 79.3, up from 78.1 and beat expectation of 76.8. That's the highest level since April 2011. Employment component dropped to 54.2, down from 57.3.
Some comments from respondents:
- "We are seeing strong sales in the U.S., Europe and Asia." (Chemical Products)
- "Business is off the charts. This is causing many collateral issues: a tightening supply chain market and longer lead times. Subcontractors are trading capacity up, leading to a bidding war for the marginal capacity. Labor remains tight and getting tighter." (Transportation Equipment)
- "Shortages of trucks and drivers has impacted delivery times." (Food, Beverage & Tobacco Products)
- "The recent steel tariffs have made it difficult to source material, and we have had to eliminate two products due to availability and cost of raw material." (Fabricated Metal Products)
- "Demand is up for products. Commodity pricing for steel and other materials increased due to the proposed tariffs. We are seeing commodity futures coming down. A lot of suppliers are asking for increases, and the team is battling those requests." (Machinery)
- "[The] 232 and 301 tariffs are very concerning. Business planning is at a standstill until they are resolved. Significant amount of manpower [on planning and the like] being expended on these issues." (Miscellaneous Manufacturing)
- "Production orders at this time are still strong and being driven partially by construction factors and customers purchasing ahead to avoid potential price increases." (Plastics & Rubber Products)
- "The general outlook for 2018 remains positive and upbeat as we see continued signs of a growing economy and investment in housing and infrastructure." (Nonmetallic Mineral Products)
- "Business conditions have been good; order book is full and running around 98 percent capacity." (Primary Metals)
- "Backorders remain strong. New order rate exceeds shipment rate." (Computer & Electronic Products)
Dollar shrugs off the weaker than expected headline number and slowing in employment component. Instead, it seems to be reacting to upside surprise in price paid. The greenback is extending recent rally, and even overwhelms Canadian Dollar.
Japanese Yen Falls to 11-Week Low, US Manufacturing PMI Looms
The Japanese yen has posted losses in the Tuesday session, continuing the downward movement we saw on Monday. In North American trade, USD/JPY is trading at 109.67, up 0.31% on the day. On the release front, manufacturing PMIs are in focus. Japanese Manufacturing PMI improved to 53.8, beating the estimate of 53.3 points. In the US, ISM Manufacturing PMI is expected to dip to 58.4 points. On Wednesday, Japan releases consumer confidence, with the markets expecting a weak reading of 44.6 points. Market attention will shift to US employment indicators in the latter part of the week, starting with ADP Nonfarm Employment Change on Wednesday. As well, the Federal Reserve will release a rate statement.
There was a surprise development last week at the Bank of Japan, which removed its target timeframe for reaching its inflation target. Governor Haruhiko Kuroda stated that the removal of the timeframe would prevent market speculation on additional easing each time the BoJ pushed back the timeframe for reaching its inflation goal. The bank has pushed back its inflation timeframe six times, due to weak inflation. In his remarks, Kuroda said that the reluctance of the business sector to raise wages continued to hamper the inflation outlook. In its quarterly review, the bank projected an inflation rate of 1.8% in fiscal 2019. The bank is expected to hold course and maintain its ultra-accommodative monetary policy until inflation moves closer to BoJ target of around 2 percent.
All eyes will be on the Federal Reserve on Wednesday when it concludes a 2-day policy meeting. The markets are expecting the Fed to maintain the benchmark rate at a range between 1.50% and 1.75%, and analysts will be keeping a close eye on the rate statement – a hawkish statement could propel the US dollar to higher levels. There is growing sentiment that the Federal Reserve will raise interest rates four times this year, although Fed policymakers have not changed their forecast of three increases in 2018. One scenario envisions the Fed raising rates once each quarter until the economy shows signs of slowing down. If inflation continues to move higher and economic conditions remain strong, the dollar should continue to shine against its major rivals.
Canadian February GDP Rebounds More than Expected
Highlights:
- Canadian February GDP rose 0.4% in the month which was stronger than the 0.3% expected going into the report and more than reversed the 0.1% drop in January.
- The gain was led by a 3.0% jump in oil and gas extraction with manufacturing up 1.0%.
- Output of services rose a more modest 0.1% though this was up from flat output in January.
Our Take:
The average level of activity in February and January is consistent with annualized Q1 GDP growth of 1.8% which is in line with the Bank of Canada’s recently upwardly revised view of long-run average or potential growth rate of the Canadian economy. Though this pace of growth is as desired given an economy at capacity, the current stance of monetary policy remains highly stimulative and more in line with trying to boost growth. Thus, as the central bank stated in its most recent policy statement, “higher interest rates will be warranted over time” though quickly adding the caveat that “some policy accommodation will still be needed to keep inflation on target.” In other words the current overnight rate of 1.25% is likely too stimulative and thus needs to be hiked though conditions do not warrant this rate immediately returning to equilibrium levels of between 2.50% to 3.50%. Thus today’s report does not alter our expectation that the Bank of Canada will continue to gradually raise official rates with a further 100 basis points of tightening expected by 2019.
GBP/JPY Mid-Day Outlook
Daily Pivots: (S1) 149.92; (P) 150.38; (R1) 150.92; More...
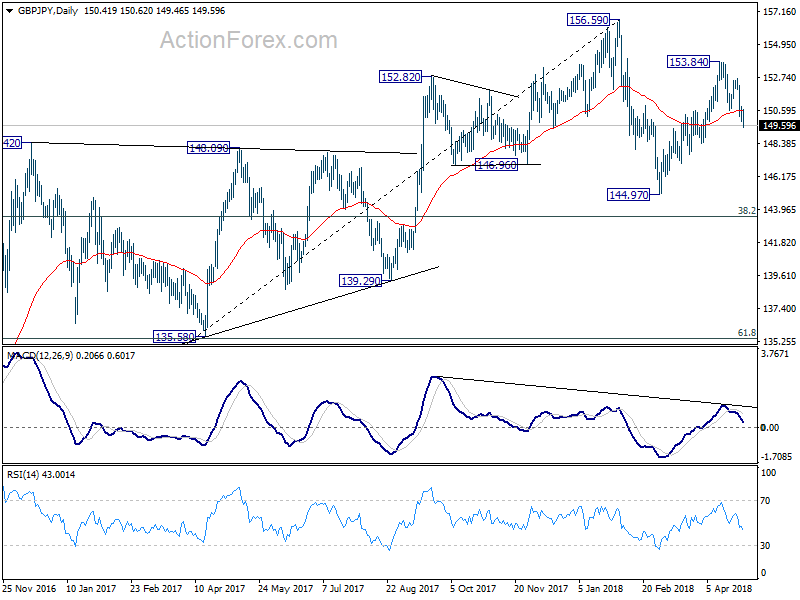
GBP/JPY drops to as low as 149.46 so far as decline from 153.84 extends. Intraday bias remains on the downside for 148.37 support next. As current fall from 153.84 is seen as the third leg of the corrective pattern from 156.59. Break of 148.37 will pave the way to 144.97 and below. On the upside, above 150.62 minor support will turn intraday bias neutral first. But outlook will remain cautiously bearish as long as 152.71 resistance holds.
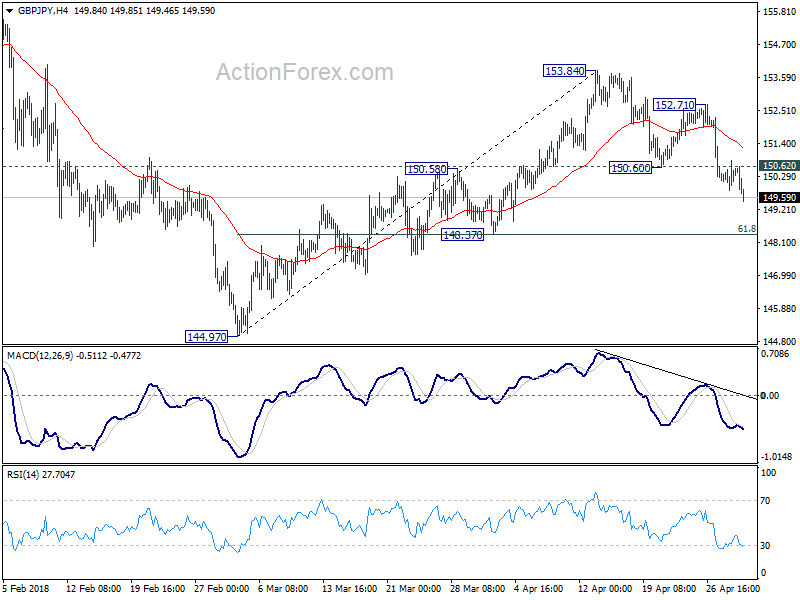
In the bigger picture, price actions from 156.59 are viewed as a corrective pattern. For now, we'd expect at least one more fall for 38.2% retracement of 122.36 to 156.59 at 143.51 before the consolidation completed. Though, firm break of 156.59 will resume whole up trend from 122.36 (2016 low) to 50% retracement of 195.86 (2015high) to 122.36 at 159.11 next.