Sample Category Title
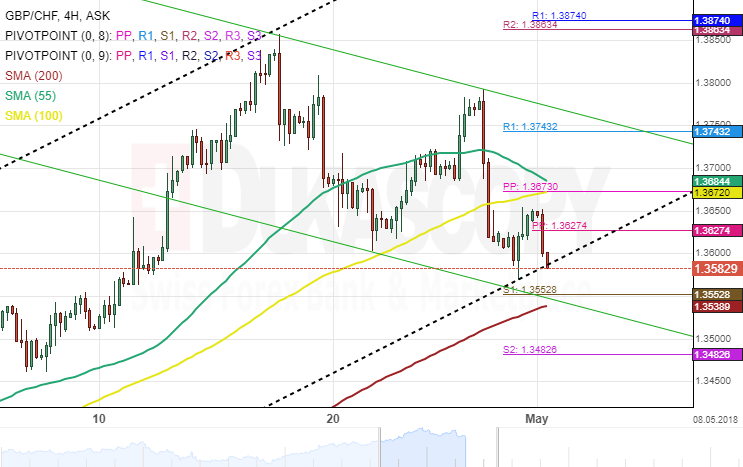
GBP/CHF 4H Chart: Bulls Likely To Prevails
The Pound Sterling has diminished in trading range against the Swiss Franc during the past two-week, thus forming a new descending channel. The lower boundary of this pattern was tested yesterday.
After reaching the monthly support level near the 1.3552 area, the GBP/CHF currency pair began to appreciate. Meanwhile, the rate has breached the weekly pivot point at the 1.3627 mark.
Furthermore, in the four-hour time frame, technical indicators are still strongly in favour of bearish sentiment.
Everything being equal, it is expected that bulls prevail in the market during the following trading sessions, thus sending the pair for a test of a resistance cluster set by the combination of the 55-, 100– hour SMAs and the weekly PP at 1.3673.
EUR/USD Analysis: Should Try Moving North
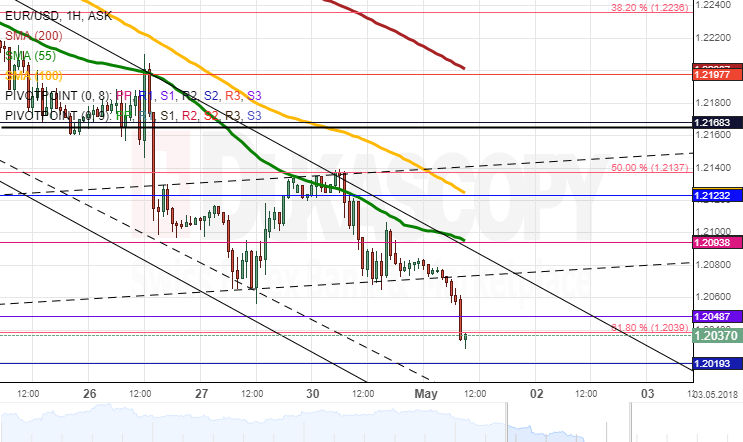
EUR/USD was driven by downside risks on Monday, as a move above the 1.2140 mark was restricted by the 55-hour SMA and the 50.00% Fibonacci retracement. As a result, bears pushed the rate down to 1.2070. The pair, however, halted at this four-month low reached on Friday, thus pointing to a possible change in sentiment.
A massive fall is not expected to occur in this session. The daily low is should be the same as yesterday—the weekly S1 and the 61.80% Fibo retracement near 1.2035.
It is more likely the Euro tries to push higher; however, some important resistance levels, including the 55– and 100-hour SMAs and the weekly PP, still need to be surpassed to allow further advance. These levels might hinder the pair for some hours, but the general direction should nevertheless remain north.
GBP/USD Analysis: Continues Moving Sideways
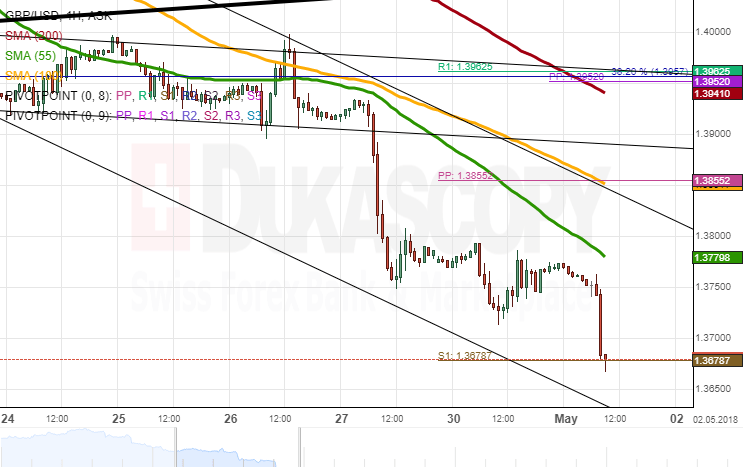
Monday's trading session was calm for the GBP/USD currency pair, as it remained trading sideways for the second consecutive session. Despite bears failing to push the pair down to the weekly S1 at 1.3979, the expected up-move towards 1.3885 did not occur either.
Technical indicators are starting to recover; thus, the price should follow soon. A strong surge is likely to be limited by the nearby-located 55-hour SMA. The pair, however, should eventually reach the 1.39—a move which might actually be boosted by today's British Manufacturing PMI and the ISM Manufacturing PMI released at 0830GMT and 1400GMT, respectively.
It is unlikely that the 1.39 level is breached in this session, and the same assumption holds for the 1.3660 area where the senior channel and the weekly S1 are located.
USD/JPY Analysis: Guided By SMAs
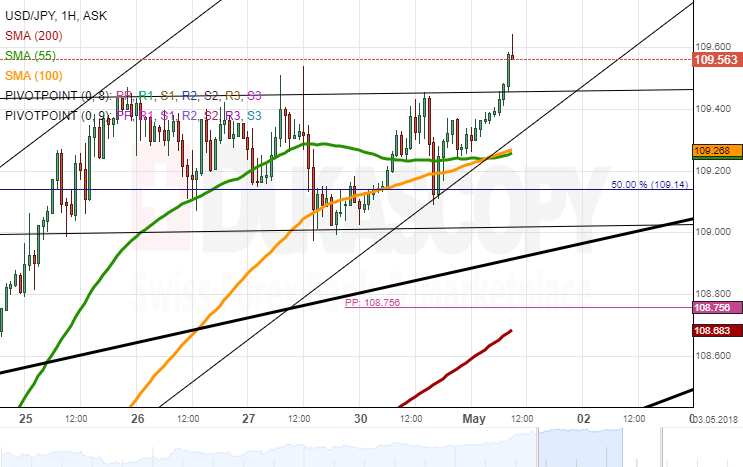
The US Dollar continues to move sideways against the Japanese Yen for the fourth consecutive session. The pair's movement on Monday was guided by the 55– and 100-hour SMAs which allowed the Greenback to return to the upper boundary of its four-day trading range by Tuesday morning. This level is likewise the pair's highest position since early February.
Technical indicators remain bullish for this session, suggesting that the aforementioned moving averages are likely to continue supporting the rate. In case the prevailing range is breached to the upside, the US Dollar should approach and eventually test the weekly R1 at 109.85.
Meanwhile, the weekly PP should provide an unbreakable support at 108.80.
Gold Analysis: Trades Near 2018 Low
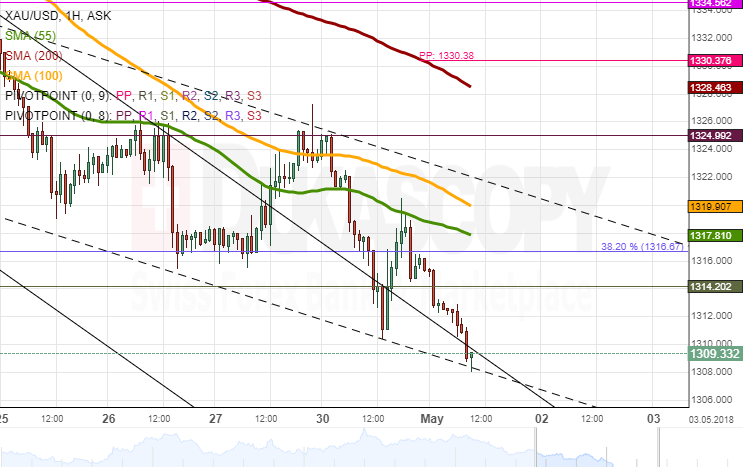
XAU/USD was pressured by the 55-hour SMA on Monday. The pair tried to surpass this moving average and the 38.20% Fibonacci retracement mid-day, but was stopped near the 1,320.00 mark.
It seems that the pair should maintain its bearish sentiment and edge lower in this session. This fall, however, is likely to be limited either by the 2018 low at 1,306.80 or by the senior channel and the 50.00% Fibo retracement at 1,300.00.
Even if the given commodity still manages to realise the aforementioned downside potential today, the following trading days should mark a bullish reversal, especially following an upside breakout of the 55– and 100-hour SMAs.
EUR/USD: US Advance GDP
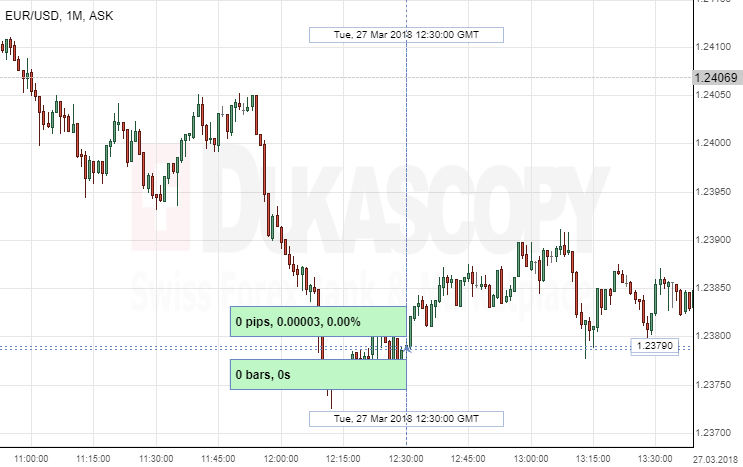
The Greenback weakened against the Eurozone's single currency, following the US Advance GDP data release on Friday. The EUR/USD currency pair gained almost nothing, to continue fluctuating in the 1.2385 area.
The Bureau of Economic Analysis released Advance Gross Domestic Product data for Q1 2018, but despite the fact that the data came out better-than-expected of 2.3%, compared to the 2.0% estimate, the EUR/USD currency pair moved upwards after bouncing a little bit lower at the moment of the report. The move upwards may be caused by the fact that in the previous quarter Advance GDP data was 2.6%, which was about 0.3% higher than in the latest quarter.
USDCAD Is Showing Signs Of A Bullish Continuation
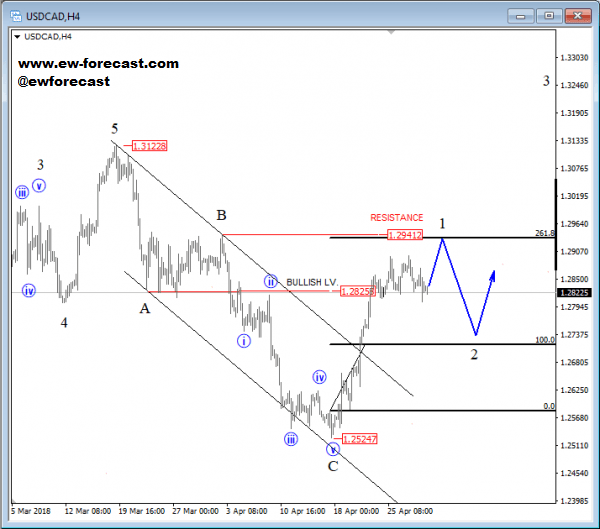
USDCAD made a break recently above 1.2826 level, which is now a confirmation that a three-wave correction from 1.3123 had ended and that now a new bullish continuation can be in progress. We see current strong recovery up from 1.2524 level as wave 1, which can see resistance around the 1.2941 level, from where a new temporary pause can show up.
USDCAD, 4h
Bitcoin Trading Below 9000
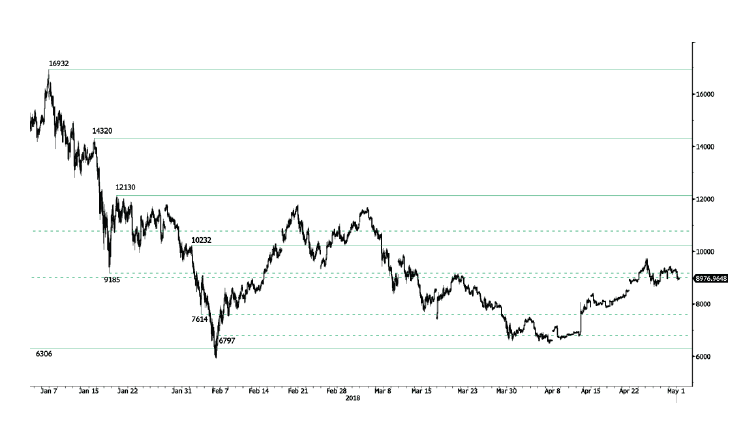
Bitcoin rise started in mid April pauses, currently trading below 9000 and heading along the 8880 range. Bitcoin bearish pattern started in March 2018 weakens. The pair is contained between hourly support and resistance given at 6306 (13/11/2017 low) and 10232 (01/02/2018 high). The technical structure suggests shortterm decrease.
In the long-term, the digital currency has had an exponential growth but also presented important downturns. There is decent likelihood that the currency could stabilize between 7'000 - 12'000 in 2018. Bitcoin is trading slightly above its 200 DMA (8200 range)
CRUDE OIL Heading Higher
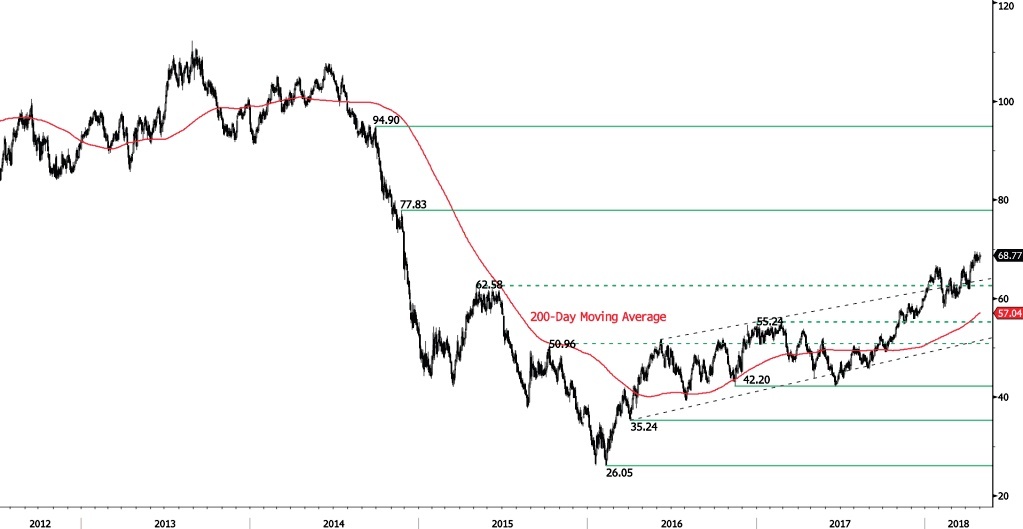
Crude oil is increasing, currently trading at 68.60 and heading along the 69.35 range. Crude Oil is trading at mid-December 2014 high. The bullish pattern started in mid-February 2017 is maintained. Hourly support is given at 65.56 (17/04/2018 low). The technical structure suggests short-term upward moves.
In the long-term, crude oil has recovered after its sharp decline last year. However, we consider that further weakness is very likely. For the time being, the pair lies in an upside trend since June 2017. Support lies at 42.20 (16/11/2016) while resistance is located at 77.83 (20/11/2014). Crude oil is trading largely above its 200 DMA.
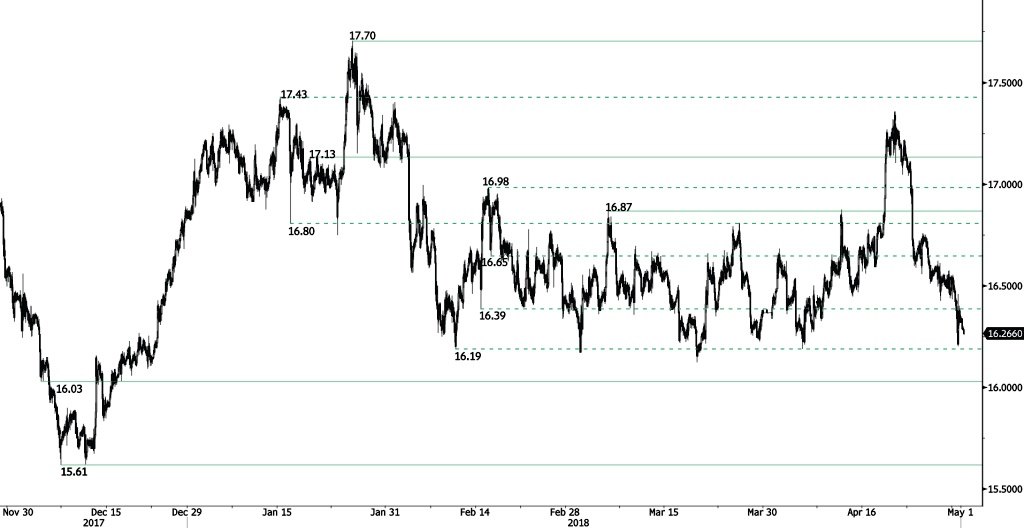
SILVER Breaking Support At 16.39
Silver is decreasing further, breaking hourly support at 16.39 (14/02/2018) and heading along the 16.18 range. Hourly support and resistance are now given at 16.03 (05/12/2017 low) and 16.87 (06/03/2018 high). The technical structure suggests further short-term decrease.
In the long-term, the trend remains negative/ sideways. Further downside is very likely. The pair is trading below its 200 DMA. Resistance is located at 21.58 (10/07/2014 high). Strong support can be found at 11.75 (20/04/2009).