Sample Category Title
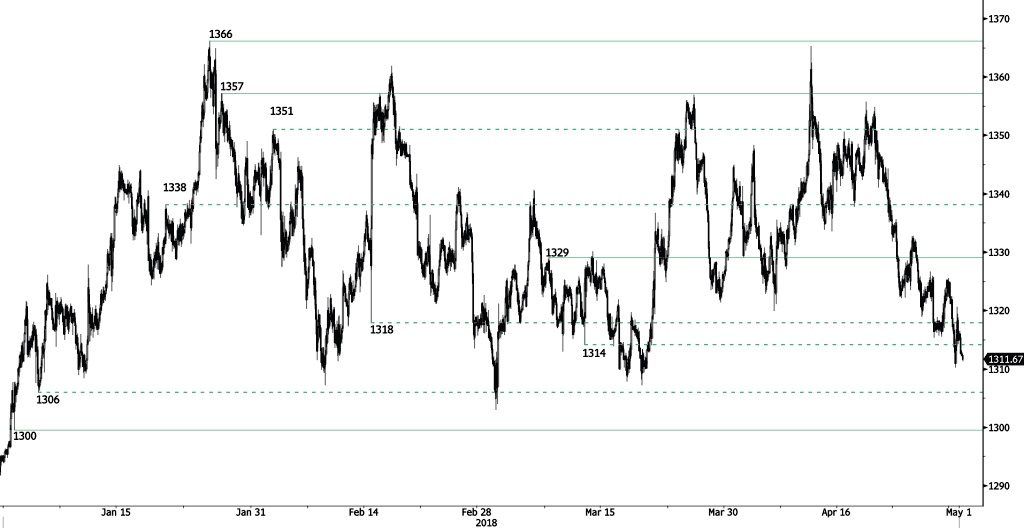
GOLD Bearish Momentum
Gold decline continues, breaking hourly support at 1314 (13/03/2018) and heading along the 1310 range. Hourly support and resistance are given at 1300 (29/12/2017 low) and 1329 (08/03/2018 high). The technical structure suggests short-term decrease.
In the long-term, the technical structure suggests that there is a growing upside momentum. A break of 1'392 (17/03/2014) is required to confirm it. A major support can be found at 1'045 (05/02/2010 low).
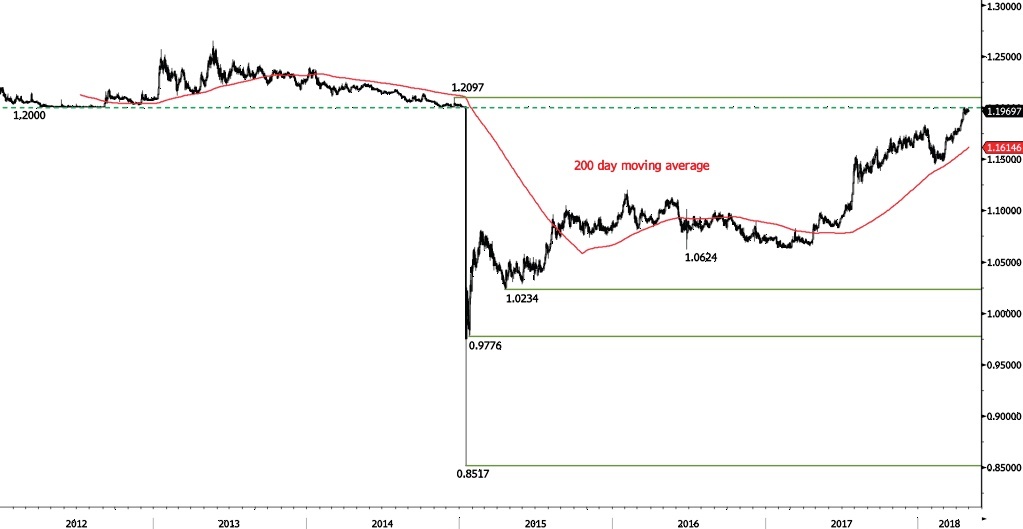
EUR/CHF Maintained Below 1.20
EUR/CHF is maintained at the 1.1960 range, trading sideways. Strong resistance at 1.20 remains. Hourly support given at 1.1842 (11/04/2018 low) is distanced. The short-term technical structure suggests further short-term sideways trading moves.
In the longer term, the technical structure has reversed. Strong resistance at 1.20 (level before the unpeg) is now at reach. The ECB's slowing QE program is likely to cause buying pressures on the euro, which should weigh in favour of the EUR/CHF. Support and resistance can be found at 1.0624 (24/06/2016 low) and 1.2097 (18/12/2014 high).
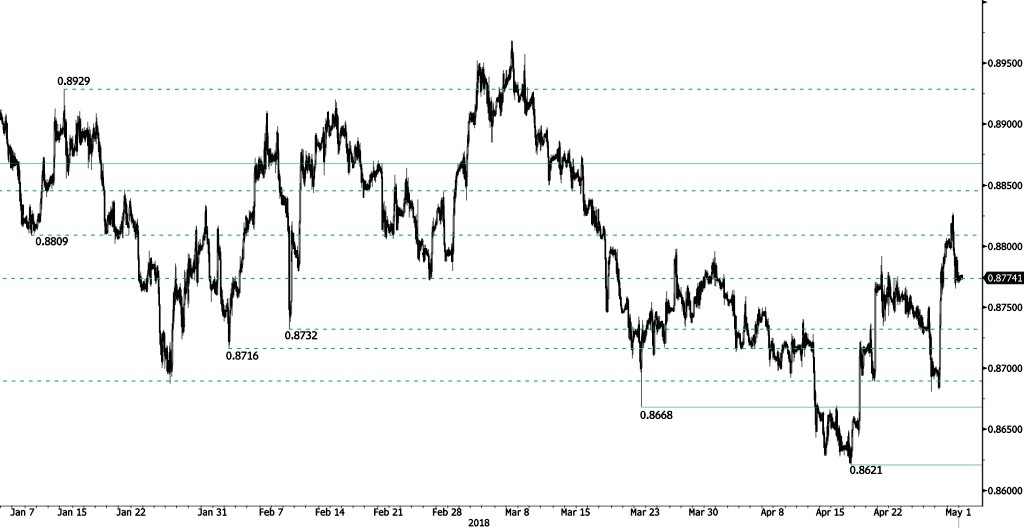
EUR/GBP Starting A Consolidation Phase
EUR/GBP is trading sideways following recent rise at 0.8827, approaching 0.8770. EUR/GBP bearish pattern started in March is weakening. Hourly support and resistance are given at 0.8668 (22/03/2018 low) and 0.8868 (05/12/2017 high). The technical structure suggests shortterm sideways trading moves.
In the long-term, the pair has largely recovered from 2015 lows. The technical structure suggests further upside pressure. Strong resistance can be found at 0.9500 (psychological level) while support remains at 0.8304 (05/12/2016 low). The pair is trading below its 200 DMA.
AUD/USD Bearish Consolidation
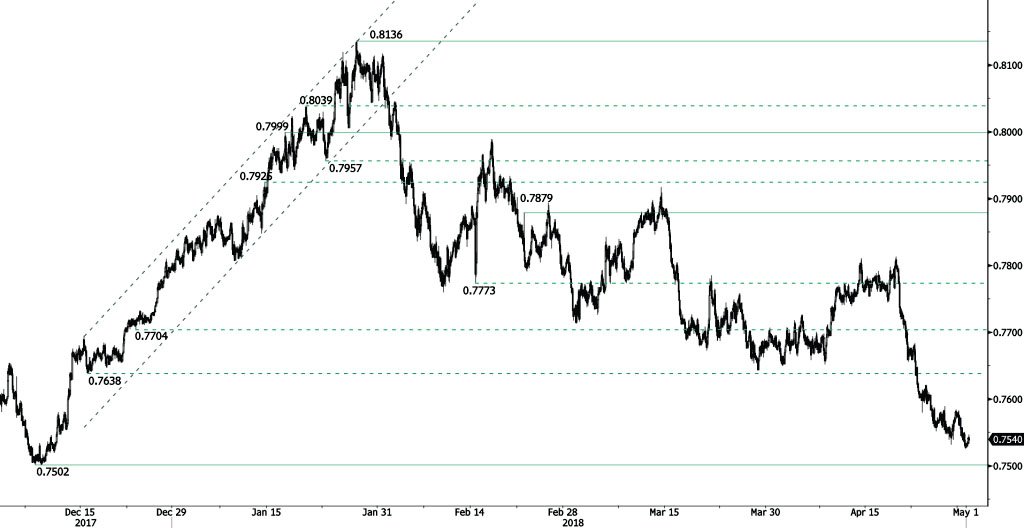
AUD/USD bearish pattern from 0.7813 (19/04/2018) continues, heading along the 0.7525 range. The pair is trading at mid- December 2017 low. Hourly support and resistance are given at 0.7502 (21/02/2018 low) and 0.7879 (28/02/2018 high). The technical structure suggests short-term sideways trading moves.
In the long-term, the upward trend slows down after failing to reach key resistance at 0.8164 (14/05/2015 low). Key support stands at 0.6009 (31/10/2008 low). A break of the key resistance at 0.8164 (14/05/2015 high) is needed to invalidate our long-term bearish view.
USD/CAD Weakening
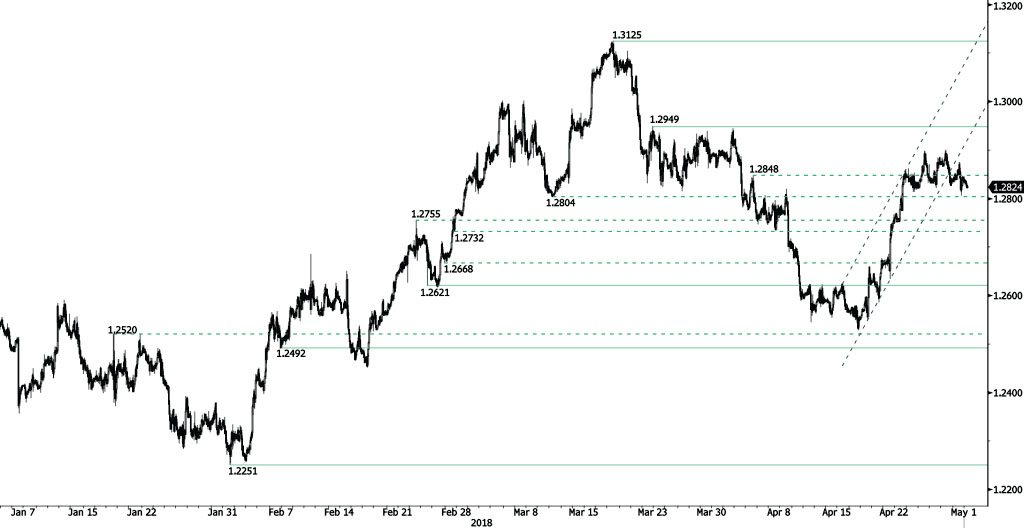
USD/CAD bullish trend pauses, the pair is heading along the 1.2820 range. Hourly support and resistance are given at 1.2621 (23/02/2018 low) and 1.2949 (22/03/2018 high). The technical structure suggests short-term downward moves.
In the longer term, the pair is trading between resistance point at 1.3805 (05/05/2017 high) and support at 1.2128 (18/06/2015 low). Strong resistance is given at 1.4690 (22/01/2016 high). The pair is likely to head lower. The pair is trading above its 200 DMA.
USD/CHF Trading Above 0.99
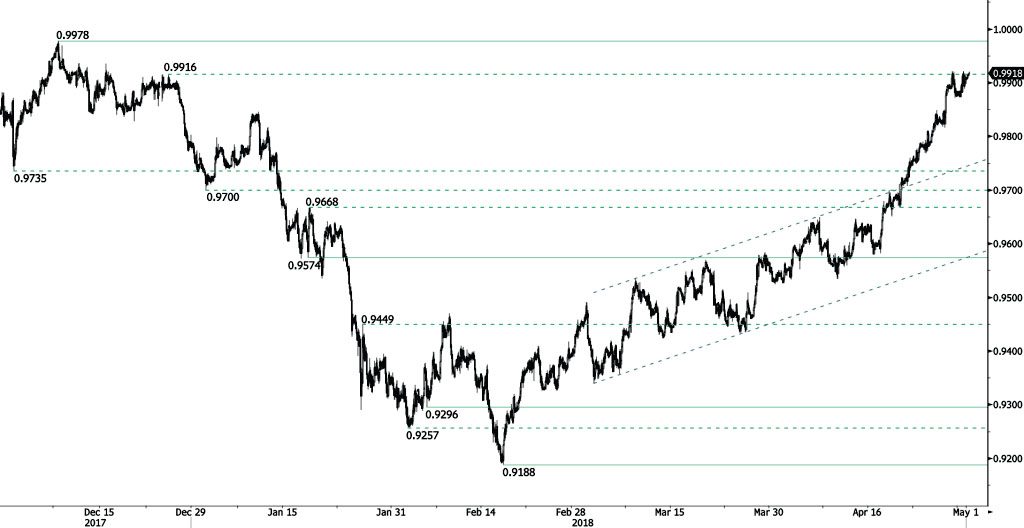
USD/CHF bullish pattern continues, the pair is bouncing off from 0.9872 low, heading along the 0.9925 range. The bullish pattern started from 0.9188 (16/02/2018 low) continues. The pair is contained between hourly support and resistance given at 0.9574 (17/01/2018 low) and 0.9978 (08/12/2017 high). The technical structure suggests further short-term upward moves.
In the long-term, the pair is still trading in range since 2011 despite some turmoil when the SNB unpegged the CHF. Key support lies at 0.9072 (07/05/2015 low) while resistance at 1.0344 (15/12/2016 high) is distanced. The technical structure favours a long term bullish bias since the unpeg in January 2015.
USD/JPY Continued Strength
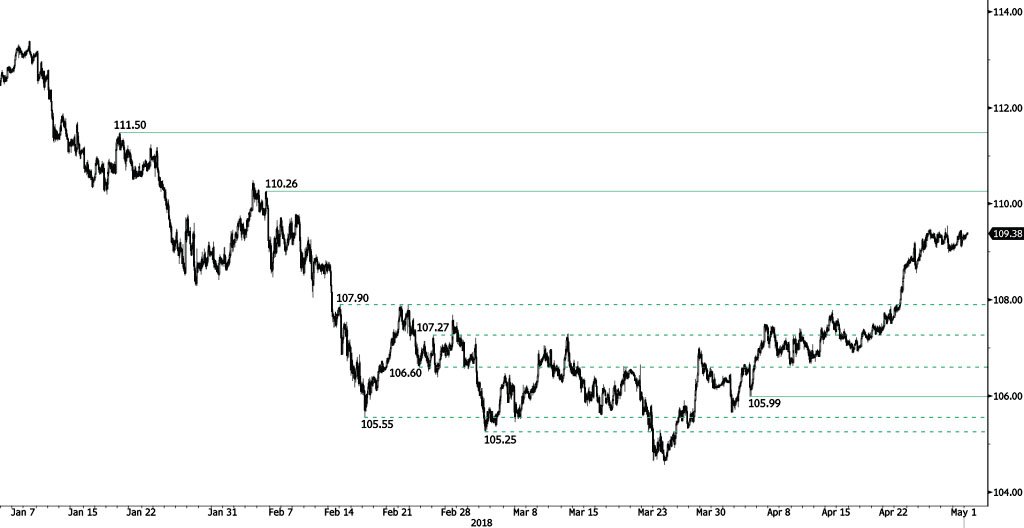
USD/JPY bullish pattern continues, currently trading at 109.45 and heading along the 109.50 range. The bearish pattern started in January 2018 is weakening. Hourly support and resistance are given at 110.26 (05/02/2018 low) and 105.99 (04/04/2018 high). The short-term technical structure suggests short-term increase.
We favor a long-term bearish bias. Support remains at 101.20 (09/11/2016 low). A gradual rise toward the major resistance at 125.86 (05/06/2015 high) seems unlikely. Expected to decline further support at 101.20 (09/11/2016 low). The pair trades below its 200 DMA.
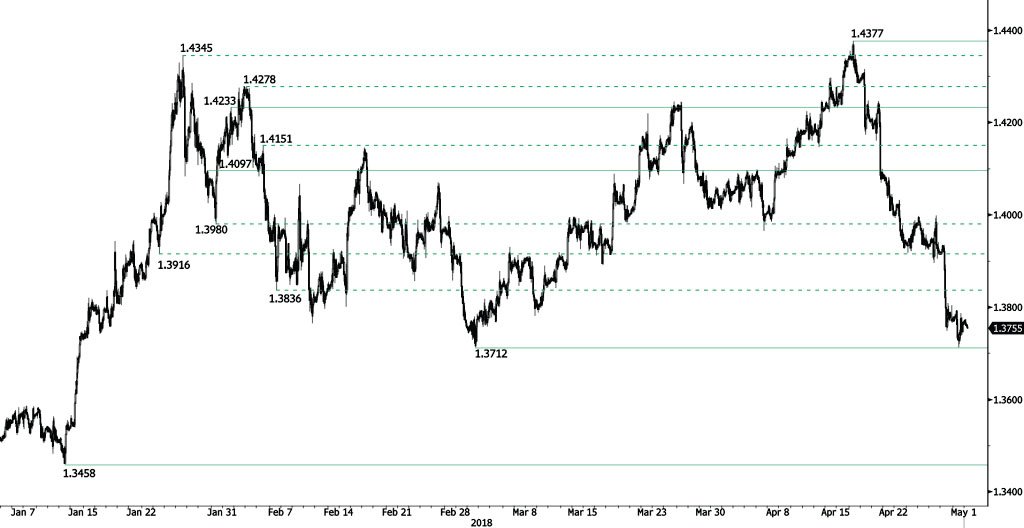
GBP/USD Failing To Break Resistance At 1.3712
GBP/USD is trading lower following recent rise at 1.3773, heading along the 1.3745 range. The pair is currently trading at March low. Hourly support and resistance are given at 1.3712 (01/30/2018 low) and 1.4097 (29/01/2018 high). The technical structure suggests further shortterm decrease.
The long-term technical pattern is reversing. The Brexit vote had paved the way for further decline but the pair is moving to 2016 highs. Long-term support and resistance are given at 1.1841 (07/10/2017 low) and 1.5018 (24/06/2016 high).
EUR/USD Slight Decrease
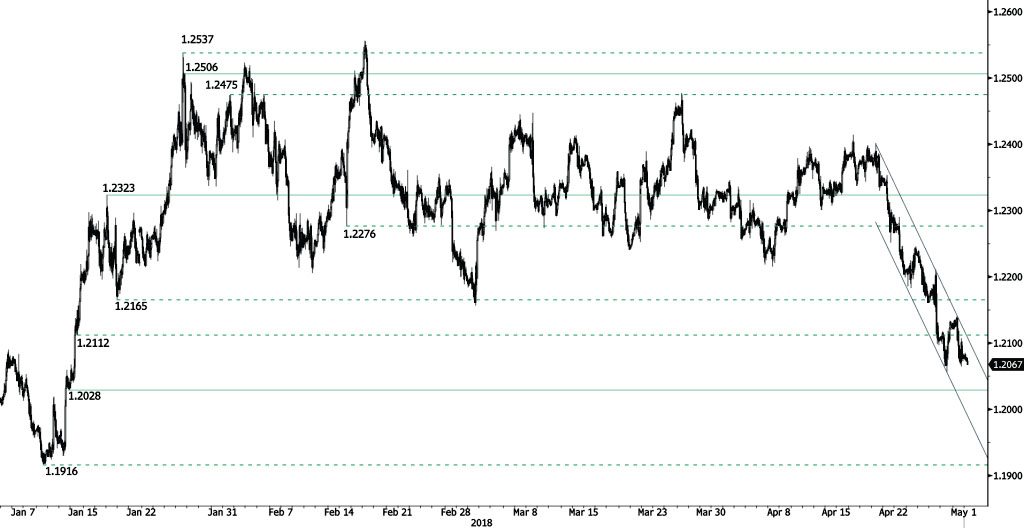
EUR/USD bearish pattern started from 1.24 (19/04/2018 high) continues, trading within downtrend channel. The pair is heading along the 1.2060 range. The pair is currently trading at mid-January 2018 low. Hourly support and resistance are given at 1.2028 (11/01/2018 low) and 1.2323 (17/01/2018 high). The technical structure suggests further short-term downward trading moves.
In the longer term, the momentum is turning largely positive. We favor a continued bullish bias. Key resistance is holding at 1.2886 (15/10/2014 high) while strong support lies at 1.1554 (08/11/2017 low).
RBA More Upbeat on Growth, Likely on Hold for 2018
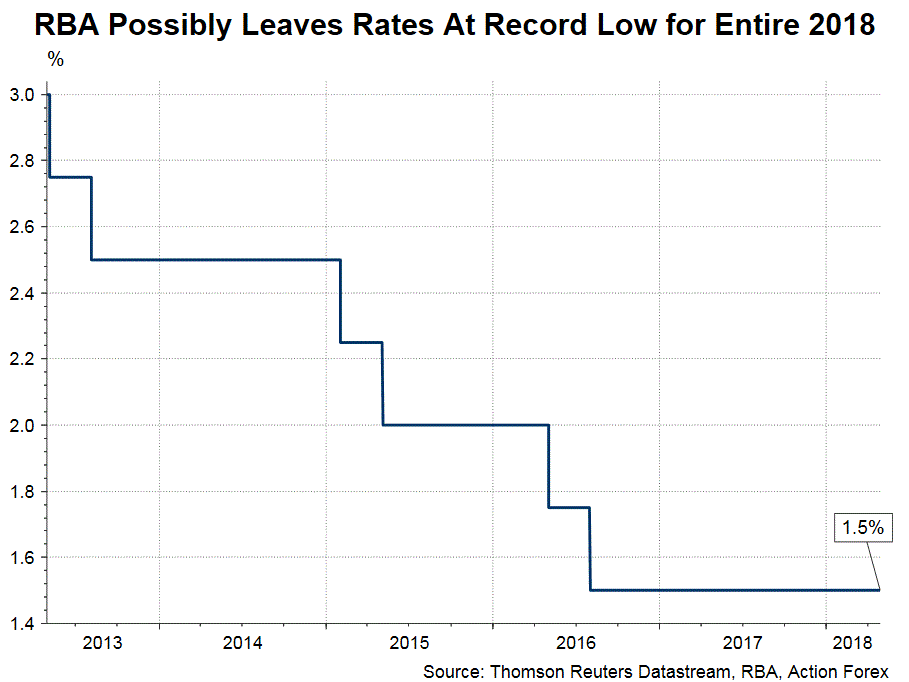
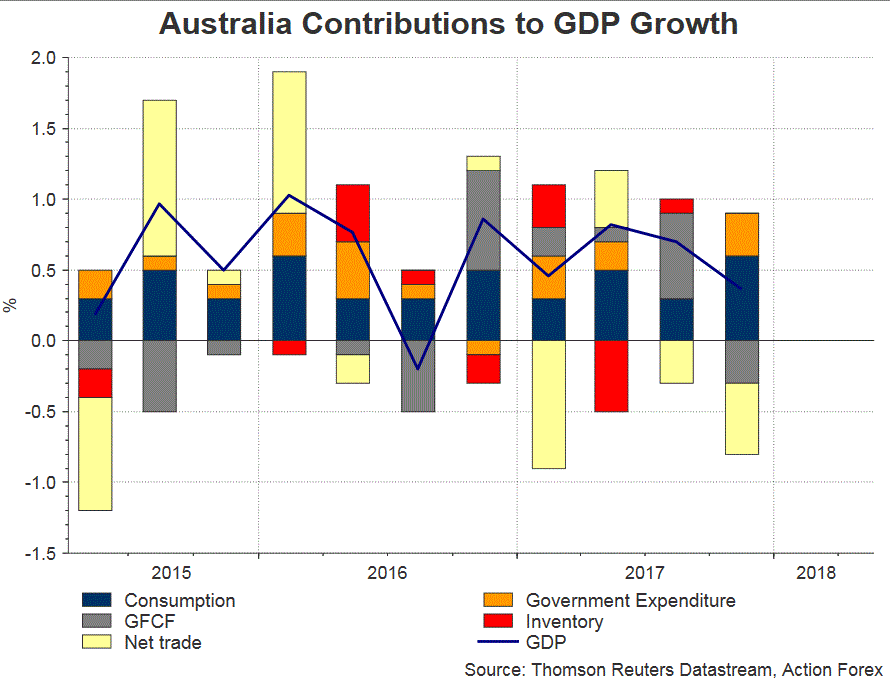
Extending the streak for a 19th month, RBA left the cash rate unchanged at 1.5% in May. Benign inflation and recent slowdown in employment growth are allowing policymakers to keep the monetary policy accommodative. The accompanying statement was largely unchanged from the previous one, with the key positive coming from the forecast that GDP growth would rose above +3% this year. All in all, we retain the view that RBA would leave the policy rate unchanged for the full 2018.
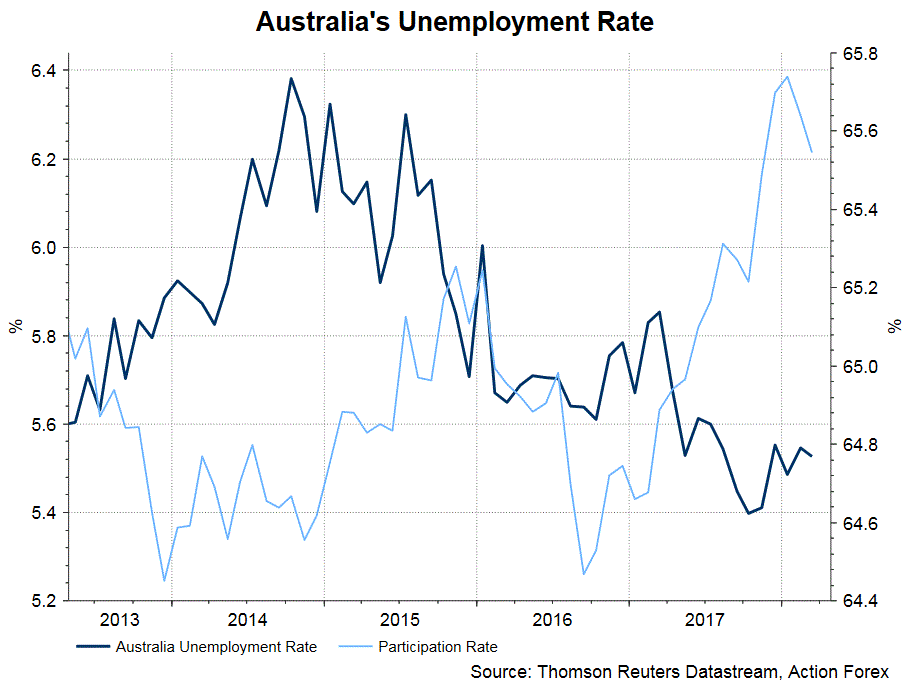
On the positive note, RBA indicated that its “central forecast for the Australian economy remains for growth to pick up, to average a bit above 3% in 2018 and 2019”. It added that “this should see some reduction in spare capacity in the economy”. Despite recent slowdown in payrolls increase, policymakers reiterated the reference that “the strong growth in employment has been accompanied by a significant rise in labor force participation” and acknowledged that the unemployment rate would steady at around 5.5% for some months.
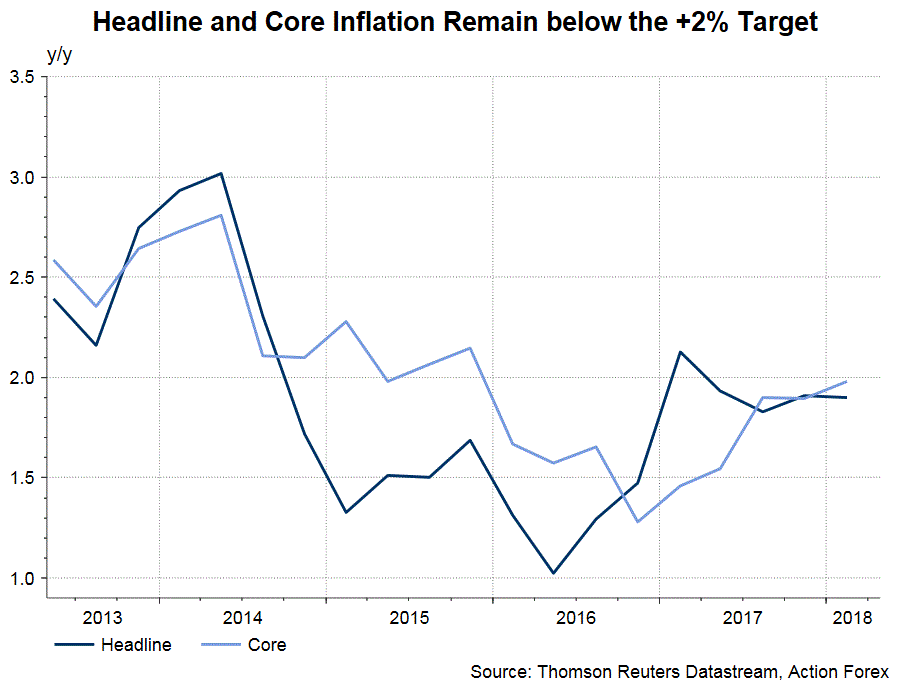
Headline inflation, at +1.9%, remained soft in the first quarter. Core CPI improved modestly to +1.9%. Regarding this, RBA noted that “the recent inflation data were in line with the Bank's expectations, with both CPI and underlying inflation running marginally below +2%. The central bank noted again that inflation should “remain low for some time, reflecting low growth in labour costs and strong competition in retailing”. Meanwhile, it retained the forecast that CPI would rose “a bit above +2%” this year.
AUDUSD plunged more than -2% since the April meeting, offering additional easing to the economy. RBA welcomed this phenomena and repeating the warning that “appreciating exchange rate would be expected to result in a slower pick-up in economic activity and inflation than currently forecast”.
Globally, RBA acknowledged that “The price of oil has increased recently, as have the prices of some base metals”. This is in contrast with April’s reference that “the prices of a number of Australia's commodity exports have fallen recently, but remain within the ranges seen over the past year or so”.