
Sample Category Title
Headline Inflation in Canada to Jump But Core Pressures to Stay Contained
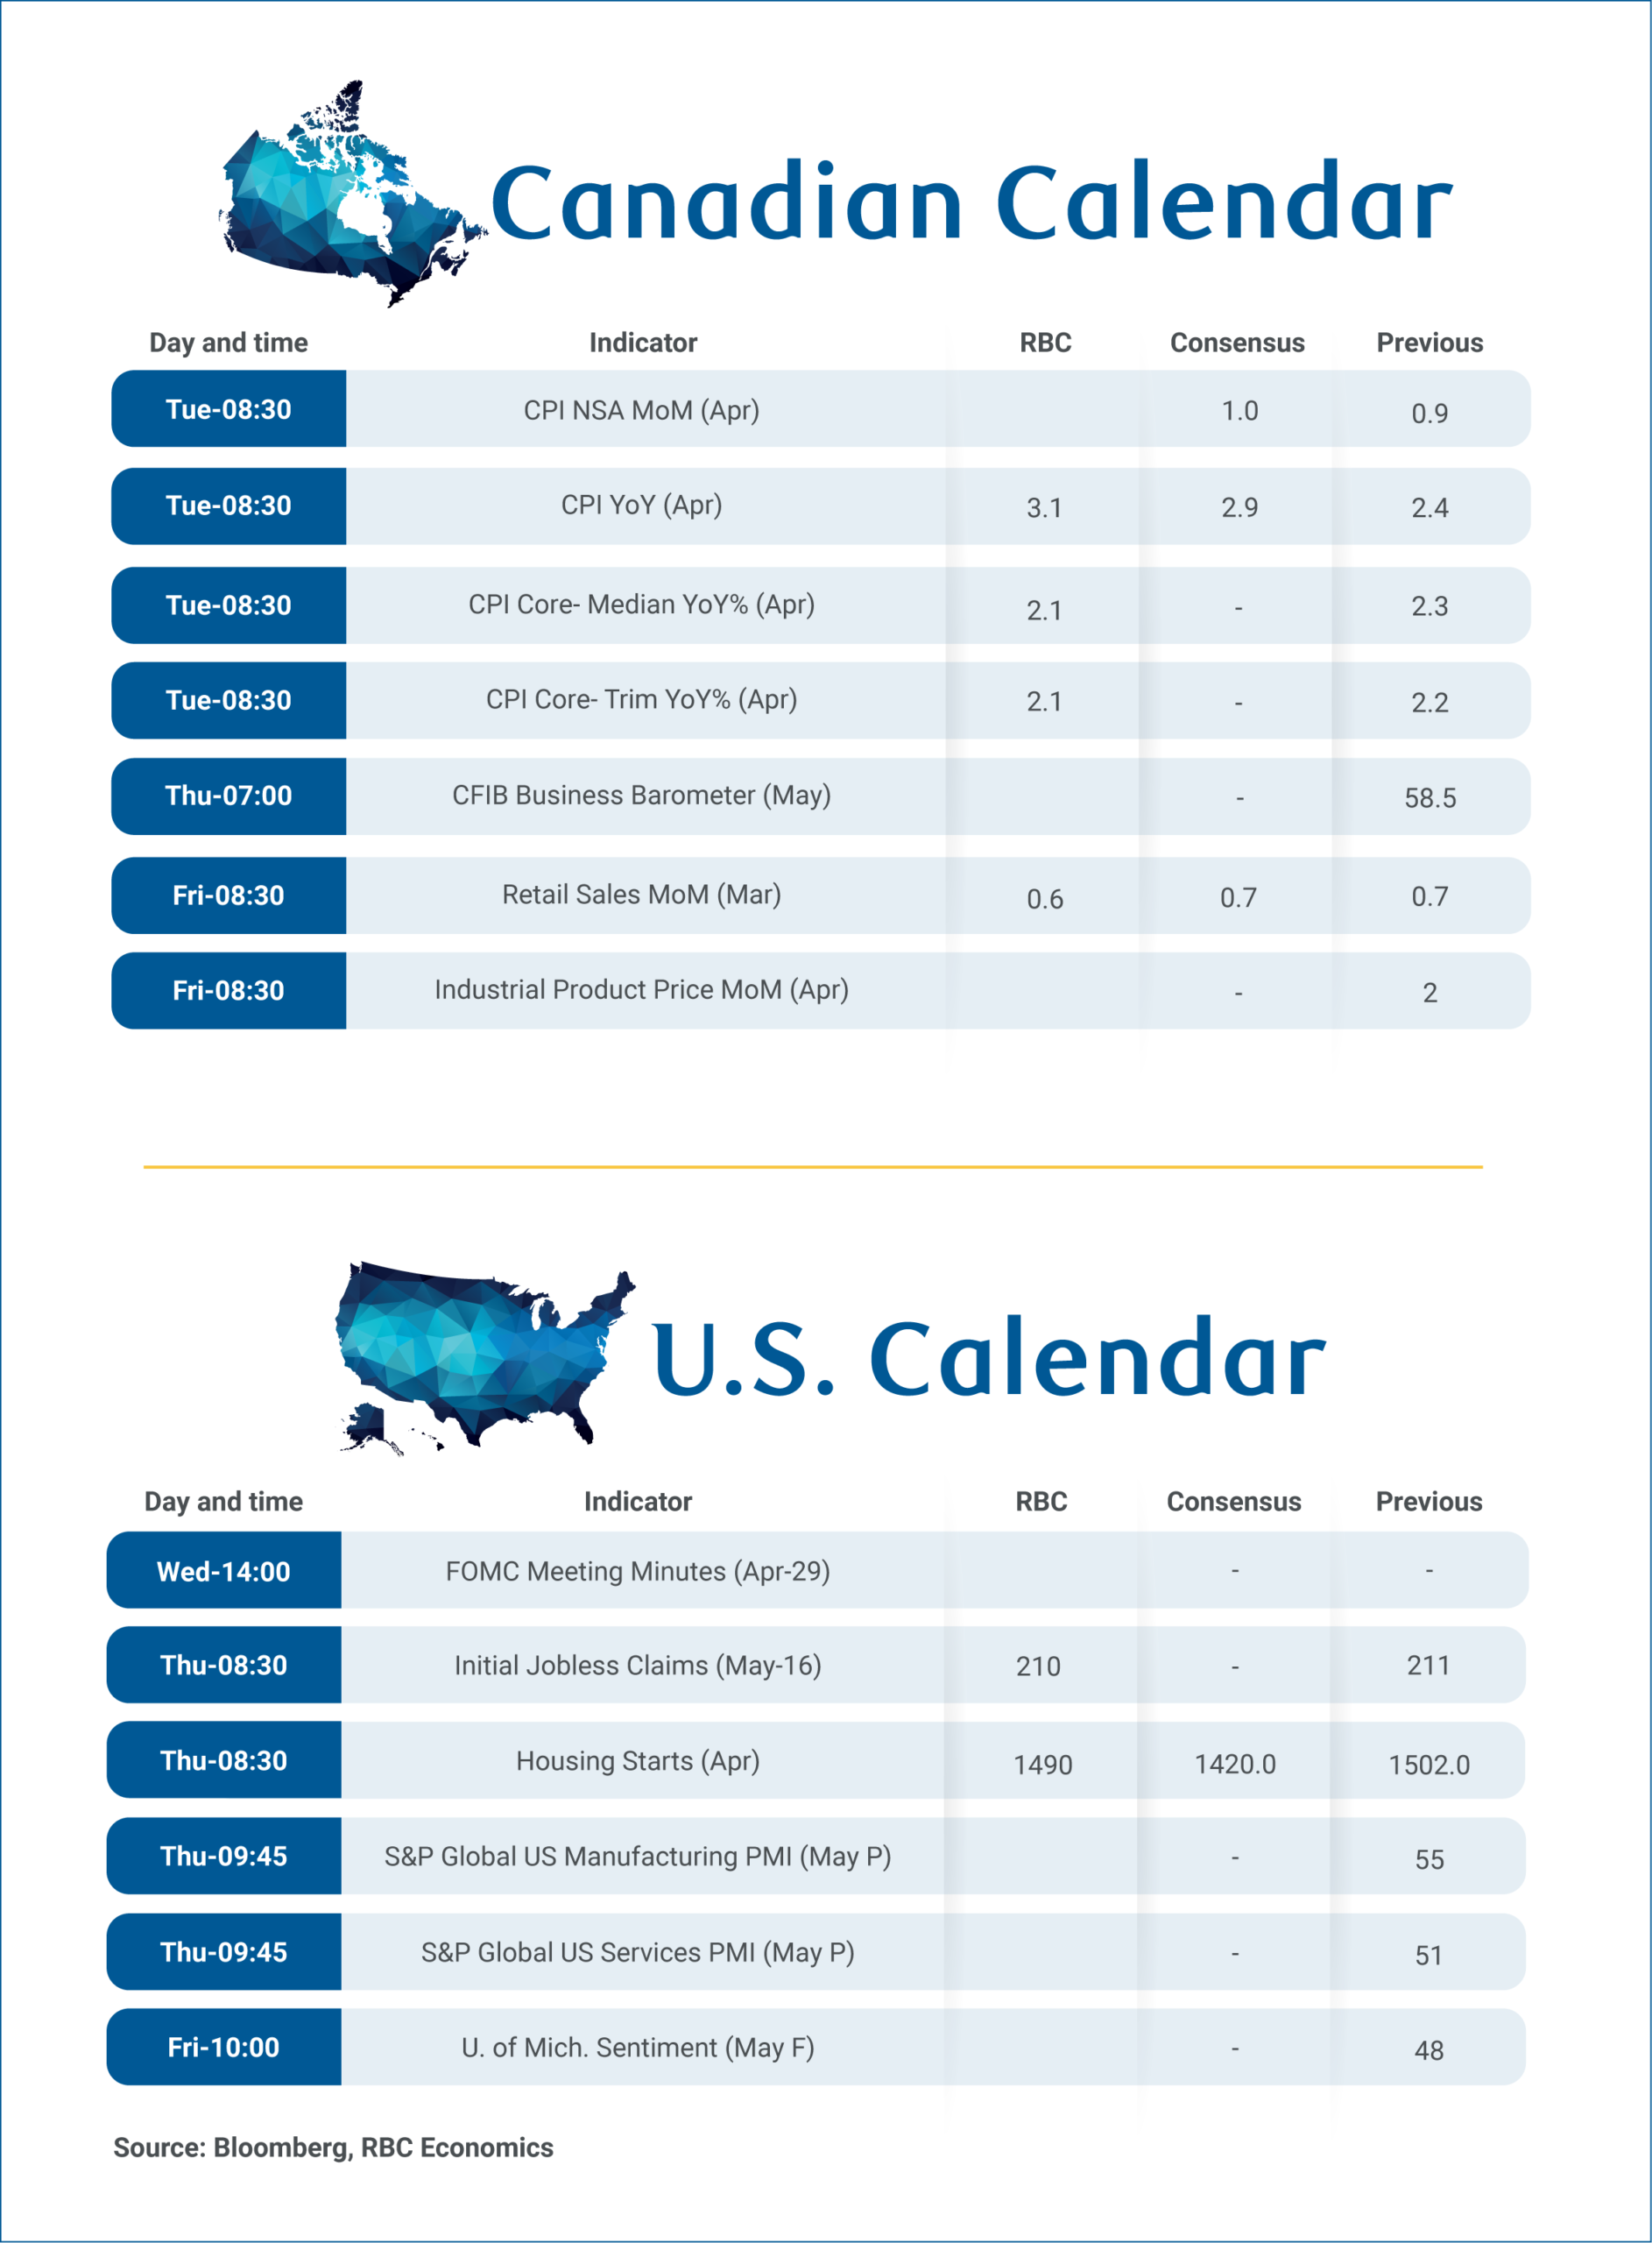
April’s inflation report on Tuesday will be closely watched as the surge in oil prices from conflict in the Middle East continues to drive up gas prices.
We expect headline inflation to rise to 3.1% year-over-year from 2.4% in March, driven primarily by higher fuel costs. Part of it is due to tax distortions. This April is the first month in a year that annual energy price growth won’t be artificially lowered by the removal of the consumer carbon tax in April 2025.
But, gasoline prices also rose another 8% in April after a 21% surge in March, and were up 28% from a year ago. Removal of the 10 cent per litre federal fuel excise tax from April 20 will provide only a small partial offset, and will show up more fully from May onwards. But, after-tax gasoline prices in May are still running more than 30% above a year ago.
The impact of higher oil prices on energy costs are well-known, so focus will be on the extent to which energy price pressures spread to other broader inflation measures.
Will broader inflation pressures reignite?
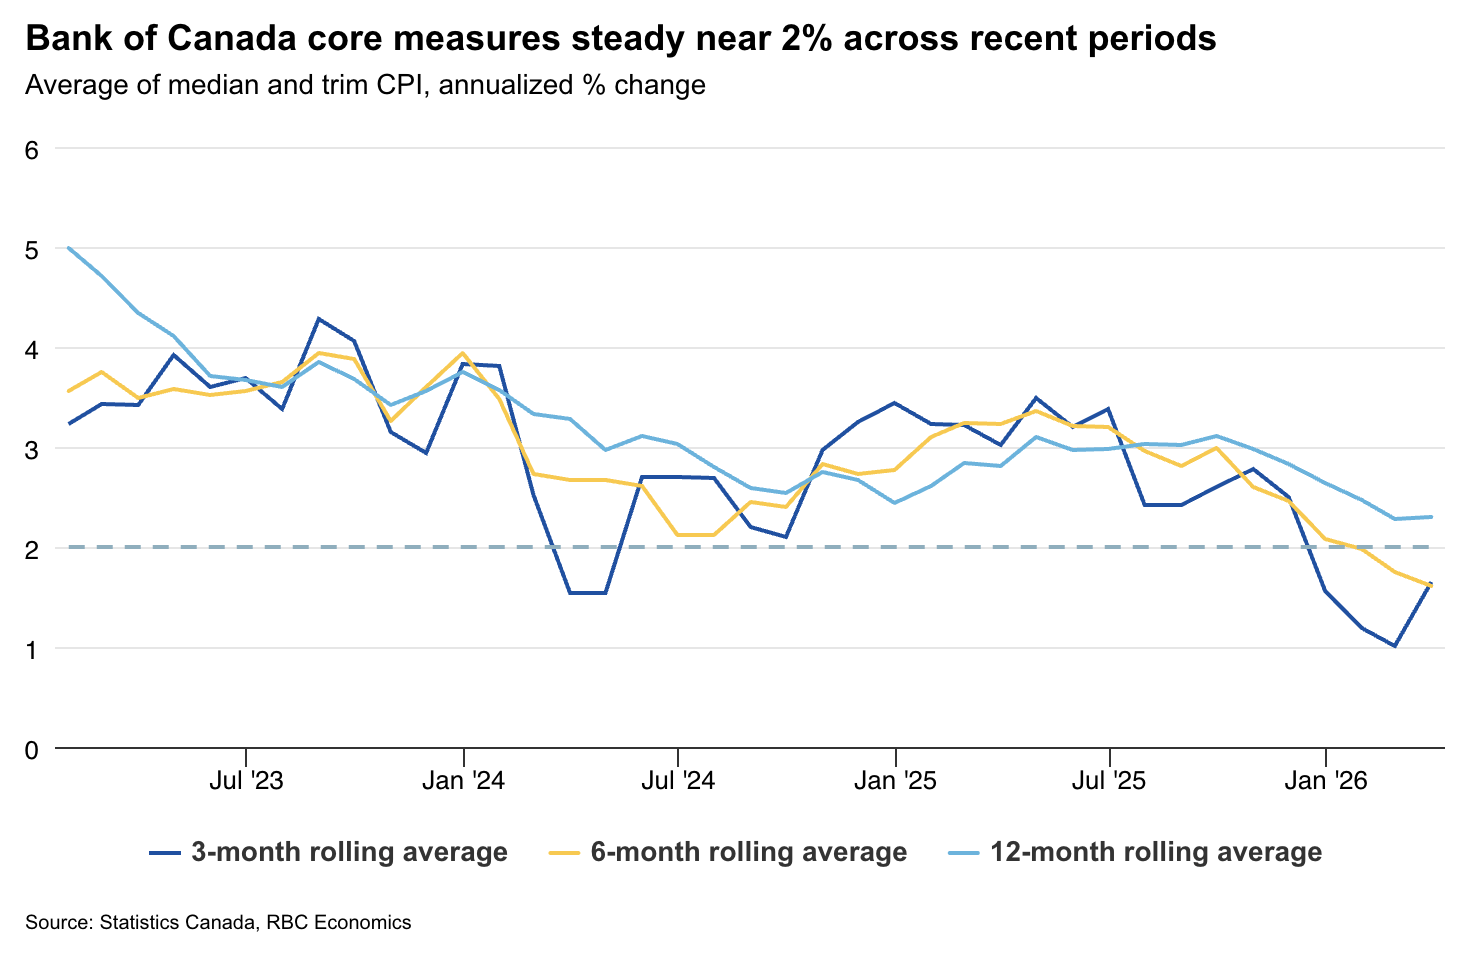
Food price growth remains higher, but we expect it will stay around 4% in April. Broader inflation measures have been consistent recently with cooling underlying price momentum so far. We look for the Bank of Canada’s preferred median and trim measures of broader inflation pressures to tick lower (year-over-year) as a large monthly increase a year ago falls out of the annual calculation.
We don’t expect higher oil prices to re-ignite broader inflation pressures, but that also will depend on the magnitude and duration of the oil price shock. The BoC will continue to watch for any evidence that pressures are spreading.
Business surveys show short-term inflation expectations have risen in recent months alongside energy price spikes, but longer-term expectations remain anchored around target.
This suggests the BoC has room to look through near-term headline volatility, particularly given slower core price growth, and what is still a soft economic backdrop with the unemployment rate elevated at 6.9%. Against this backdrop, our base case forecast for the BoC remains unchanged: We expect rates to hold steady through 2026.
Building on the momentum from February’s retail sales increase, Statistics Canada’s advance estimate suggests retail sales rose 0.6% in March. Household spending has remained a steady engine of growth with RBC cardholder transactions indicating resilience extended into Q1 2026 even as a significant new oil shock hit the economy.
Summary 5/18 – 5/22
Monday, May 18, 2026
| GMT | Ccy | Events | Cons | Prev |
|---|---|---|---|---|
| 22:30 | NZD | Business NZ PSI Apr | 46 | |
| 02:00 | CNY | Industrial Production Y/Y Apr | 5.90% | 5.70% |
| 02:00 | CNY | Retail Sales Y/Y Apr | 2.00% | 1.70% |
| 02:00 | CNY | Fixed Asset Investment (YTD) Y/Y Apr | 1.60% | 1.70% |
| 14:00 | USD | NAHB Housing Market Index May | 34 | 34 |
| 22:30 | NZD |
| Business NZ PSI Apr | |
| Consensus | |
| Previous | 46 |
| 02:00 | CNY |
| Industrial Production Y/Y Apr | |
| Consensus | 5.90% |
| Previous | 5.70% |
| 02:00 | CNY |
| Retail Sales Y/Y Apr | |
| Consensus | 2.00% |
| Previous | 1.70% |
| 02:00 | CNY |
| Fixed Asset Investment (YTD) Y/Y Apr | |
| Consensus | 1.60% |
| Previous | 1.70% |
| 14:00 | USD |
| NAHB Housing Market Index May | |
| Consensus | 34 |
| Previous | 34 |
Tuesday, May 19, 2026
| GMT | Ccy | Events | Cons | Prev |
|---|---|---|---|---|
| 22:45 | NZD | PPI Input Q/Q Q1 | 0.80% | -0.50% |
| 22:45 | NZD | PPI Output Q/Q Q1 | 0.50% | 0.10% |
| 23:50 | JPY | GDP Q/Q Q1 P | 0.40% | 0.30% |
| 23:50 | JPY | GDP Deflator Y/Y Q1 P | 3.10% | 3.40% |
| 00:30 | AUD | Westpac Consumer Confidence May | -12.50% | |
| 01:30 | AUD | RBA Meeting Minutes | ||
| 04:30 | JPY | Industrial Production M/M Mar F | -0.50% | -0.50% |
| 04:30 | JPY | Tertiary Industry Index M/M Mar | -0.40% | -0.40% |
| 06:00 | GBP | Claimant Count Change Apr | 27.3K | 26.8K |
| 06:00 | GBP | ILO Unemployment Rate (3M) Mar | 4.80% | 4.90% |
| 06:00 | GBP | Average Earnings Including Bonus 3M/Y Mar | 3.70% | 3.80% |
| 09:00 | EUR | Eurozone Trade Balance (EUR) Mar | 6.5B | 7.0B |
| 12:30 | CAD | Building Permits M/M Mar | 3.80% | -8.40% |
| 12:30 | CAD | New Housing Price Index M/M Apr | 0.00% | -0.20% |
| 12:30 | CAD | CPI M/M Apr | 0.70% | 0.90% |
| 12:30 | CAD | CPI Y/Y Apr | 3.10% | 2.40% |
| 12:30 | CAD | CPI Common Y/Y Apr | 2.60% | 2.60% |
| 12:30 | CAD | CPI Median Y/Y Apr | 2.20% | 2.30% |
| 12:30 | CAD | CPI Trimmed Y/Y Apr | 2.30% | 2.20% |
| 14:00 | USD | Pending Home Sales M/M Apr | 1.60% | 1.50% |
| 22:45 | NZD |
| PPI Input Q/Q Q1 | |
| Consensus | 0.80% |
| Previous | -0.50% |
| 22:45 | NZD |
| PPI Output Q/Q Q1 | |
| Consensus | 0.50% |
| Previous | 0.10% |
| 23:50 | JPY |
| GDP Q/Q Q1 P | |
| Consensus | 0.40% |
| Previous | 0.30% |
| 23:50 | JPY |
| GDP Deflator Y/Y Q1 P | |
| Consensus | 3.10% |
| Previous | 3.40% |
| 00:30 | AUD |
| Westpac Consumer Confidence May | |
| Consensus | |
| Previous | -12.50% |
| 01:30 | AUD |
| RBA Meeting Minutes | |
| Consensus | |
| Previous | |
| 04:30 | JPY |
| Industrial Production M/M Mar F | |
| Consensus | -0.50% |
| Previous | -0.50% |
| 04:30 | JPY |
| Tertiary Industry Index M/M Mar | |
| Consensus | -0.40% |
| Previous | -0.40% |
| 06:00 | GBP |
| Claimant Count Change Apr | |
| Consensus | 27.3K |
| Previous | 26.8K |
| 06:00 | GBP |
| ILO Unemployment Rate (3M) Mar | |
| Consensus | 4.80% |
| Previous | 4.90% |
| 06:00 | GBP |
| Average Earnings Including Bonus 3M/Y Mar | |
| Consensus | 3.70% |
| Previous | 3.80% |
| 09:00 | EUR |
| Eurozone Trade Balance (EUR) Mar | |
| Consensus | 6.5B |
| Previous | 7.0B |
| 12:30 | CAD |
| Building Permits M/M Mar | |
| Consensus | 3.80% |
| Previous | -8.40% |
| 12:30 | CAD |
| New Housing Price Index M/M Apr | |
| Consensus | 0.00% |
| Previous | -0.20% |
| 12:30 | CAD |
| CPI M/M Apr | |
| Consensus | 0.70% |
| Previous | 0.90% |
| 12:30 | CAD |
| CPI Y/Y Apr | |
| Consensus | 3.10% |
| Previous | 2.40% |
| 12:30 | CAD |
| CPI Common Y/Y Apr | |
| Consensus | 2.60% |
| Previous | 2.60% |
| 12:30 | CAD |
| CPI Median Y/Y Apr | |
| Consensus | 2.20% |
| Previous | 2.30% |
| 12:30 | CAD |
| CPI Trimmed Y/Y Apr | |
| Consensus | 2.30% |
| Previous | 2.20% |
| 14:00 | USD |
| Pending Home Sales M/M Apr | |
| Consensus | 1.60% |
| Previous | 1.50% |
Wednesday, May 20, 2026
| GMT | Ccy | Events | Cons | Prev |
|---|---|---|---|---|
| 01:15 | CNY | 1-y Loan Prime Rate | 3.00% | 3.00% |
| 01:15 | CNY | 5-y Loan Prime Rate | 3.50% | 3.50% |
| 06:00 | EUR | Germany PPI M/M Apr | 1.00% | 2.50% |
| 06:00 | EUR | Germany PPI Y/Y Apr | 1.50% | -0.20% |
| 06:00 | GBP | CPI M/M Apr | 0.90% | 0.70% |
| 06:00 | GBP | CPI Y/Y Apr | 3.00% | 3.30% |
| 06:00 | GBP | Core CPI Y/Y Apr | 2.70% | 3.10% |
| 06:00 | GBP | RPI M/M Apr | 1.40% | 0.80% |
| 06:00 | GBP | RPI Y/Y Apr | 3.70% | 4.10% |
| 06:00 | GBP | PPI Input M/M Apr | 1.10% | 4.40% |
| 06:00 | GBP | PPI Input Y/Y Apr | 5.90% | 5.40% |
| 06:00 | GBP | PPI Output M/M Apr | 0.90% | 0.90% |
| 06:00 | GBP | PPI Output Y/Y Apr | 2.80% | 2.60% |
| 06:00 | GBP | PPI Core Output M/M Apr | 0.20% | |
| 06:00 | GBP | PPI Core Output Y/Y Apr | 2.00% | |
| 09:00 | EUR | Eurozone CPI Y/Y Apr F | 3.00% | 3.00% |
| 09:00 | EUR | Eurozone Core CPI Y/Y Apr F | 2.20% | 2.20% |
| 14:30 | USD | Crude Oil Inventories (May 15) | -2.5M | -4.3M |
| 18:00 | USD | FOMC Minutes |
| 01:15 | CNY |
| 1-y Loan Prime Rate | |
| Consensus | 3.00% |
| Previous | 3.00% |
| 01:15 | CNY |
| 5-y Loan Prime Rate | |
| Consensus | 3.50% |
| Previous | 3.50% |
| 06:00 | EUR |
| Germany PPI M/M Apr | |
| Consensus | 1.00% |
| Previous | 2.50% |
| 06:00 | EUR |
| Germany PPI Y/Y Apr | |
| Consensus | 1.50% |
| Previous | -0.20% |
| 06:00 | GBP |
| CPI M/M Apr | |
| Consensus | 0.90% |
| Previous | 0.70% |
| 06:00 | GBP |
| CPI Y/Y Apr | |
| Consensus | 3.00% |
| Previous | 3.30% |
| 06:00 | GBP |
| Core CPI Y/Y Apr | |
| Consensus | 2.70% |
| Previous | 3.10% |
| 06:00 | GBP |
| RPI M/M Apr | |
| Consensus | 1.40% |
| Previous | 0.80% |
| 06:00 | GBP |
| RPI Y/Y Apr | |
| Consensus | 3.70% |
| Previous | 4.10% |
| 06:00 | GBP |
| PPI Input M/M Apr | |
| Consensus | 1.10% |
| Previous | 4.40% |
| 06:00 | GBP |
| PPI Input Y/Y Apr | |
| Consensus | 5.90% |
| Previous | 5.40% |
| 06:00 | GBP |
| PPI Output M/M Apr | |
| Consensus | 0.90% |
| Previous | 0.90% |
| 06:00 | GBP |
| PPI Output Y/Y Apr | |
| Consensus | 2.80% |
| Previous | 2.60% |
| 06:00 | GBP |
| PPI Core Output M/M Apr | |
| Consensus | |
| Previous | 0.20% |
| 06:00 | GBP |
| PPI Core Output Y/Y Apr | |
| Consensus | |
| Previous | 2.00% |
| 09:00 | EUR |
| Eurozone CPI Y/Y Apr F | |
| Consensus | 3.00% |
| Previous | 3.00% |
| 09:00 | EUR |
| Eurozone Core CPI Y/Y Apr F | |
| Consensus | 2.20% |
| Previous | 2.20% |
| 14:30 | USD |
| Crude Oil Inventories (May 15) | |
| Consensus | -2.5M |
| Previous | -4.3M |
| 18:00 | USD |
| FOMC Minutes | |
| Consensus | |
| Previous | |
Thursday, May 21, 2026
| GMT | Ccy | Events | Cons | Prev |
|---|---|---|---|---|
| 22:45 | NZD | Trade Balance (NZD) Apr | 980M | 698M |
| 23:00 | AUD | Manufacturing PMI May P | 51.3 | |
| 23:00 | AUD | Services PMI May P | 50.7 | |
| 23:50 | JPY | Trade Balance Apr | -0.20T | 0.09T |
| 23:50 | JPY | Machinery Orders M/M Mar | -7.70% | 13.60% |
| 00:30 | JPY | Manufacturing PMI May P | 54.5 | 55.1 |
| 00:30 | JPY | Services PMI May P | 51 | |
| 01:00 | AUD | Consumer Inflation Expectations May | 5.90% | |
| 01:30 | AUD | Employment Change Apr | 15.2K | 17.9K |
| 01:30 | AUD | Unemployment Rate Apr | 4.30% | 4.30% |
| 07:15 | EUR | France Manufacturing PMI May P | 52.3 | 52.8 |
| 07:15 | EUR | France Services PMI May P | 46.7 | 46.5 |
| 07:30 | EUR | Germany Manufacturing PMI May P | 51 | 51.4 |
| 07:30 | EUR | Germany Services PMI May P | 47.1 | 46.9 |
| 08:00 | EUR | Eurozone Current Account (EUR) Mar | 25.3B | 24.9B |
| 08:00 | EUR | Eurozone Manufacturing PMI May P | 51.8 | 52.2 |
| 08:00 | EUR | Eurozone Services PMI May P | 48 | 47.6 |
| 08:30 | GBP | Manufacturing PMI May P | 53 | 53.7 |
| 08:30 | GBP | Services PMI May P | 51.9 | 52.7 |
| 12:30 | USD | Initial Jobless Claims (May 15) | 210K | 211K |
| 12:30 | USD | Building Permits Apr | 1.38M | 1.37M |
| 12:30 | USD | Housing Starts Apr | 1.42M | 1.50M |
| 12:30 | USD | Philadelphia Fed Manufacturing Survey May | 15.3 | 26.7 |
| 13:45 | USD | Manufacturing PMI May P | 53.7 | 54.5 |
| 13:45 | USD | Services PMI May P | 51.3 | 51 |
| 14:00 | EUR | Eurozone Consumer Confidence May P | -21 | -20.6 |
| 14:30 | USD | Natural Gas Storage (May 15) | 96B | 85B |
| 22:45 | NZD |
| Trade Balance (NZD) Apr | |
| Consensus | 980M |
| Previous | 698M |
| 23:00 | AUD |
| Manufacturing PMI May P | |
| Consensus | |
| Previous | 51.3 |
| 23:00 | AUD |
| Services PMI May P | |
| Consensus | |
| Previous | 50.7 |
| 23:50 | JPY |
| Trade Balance Apr | |
| Consensus | -0.20T |
| Previous | 0.09T |
| 23:50 | JPY |
| Machinery Orders M/M Mar | |
| Consensus | -7.70% |
| Previous | 13.60% |
| 00:30 | JPY |
| Manufacturing PMI May P | |
| Consensus | 54.5 |
| Previous | 55.1 |
| 00:30 | JPY |
| Services PMI May P | |
| Consensus | |
| Previous | 51 |
| 01:00 | AUD |
| Consumer Inflation Expectations May | |
| Consensus | |
| Previous | 5.90% |
| 01:30 | AUD |
| Employment Change Apr | |
| Consensus | 15.2K |
| Previous | 17.9K |
| 01:30 | AUD |
| Unemployment Rate Apr | |
| Consensus | 4.30% |
| Previous | 4.30% |
| 07:15 | EUR |
| France Manufacturing PMI May P | |
| Consensus | 52.3 |
| Previous | 52.8 |
| 07:15 | EUR |
| France Services PMI May P | |
| Consensus | 46.7 |
| Previous | 46.5 |
| 07:30 | EUR |
| Germany Manufacturing PMI May P | |
| Consensus | 51 |
| Previous | 51.4 |
| 07:30 | EUR |
| Germany Services PMI May P | |
| Consensus | 47.1 |
| Previous | 46.9 |
| 08:00 | EUR |
| Eurozone Current Account (EUR) Mar | |
| Consensus | 25.3B |
| Previous | 24.9B |
| 08:00 | EUR |
| Eurozone Manufacturing PMI May P | |
| Consensus | 51.8 |
| Previous | 52.2 |
| 08:00 | EUR |
| Eurozone Services PMI May P | |
| Consensus | 48 |
| Previous | 47.6 |
| 08:30 | GBP |
| Manufacturing PMI May P | |
| Consensus | 53 |
| Previous | 53.7 |
| 08:30 | GBP |
| Services PMI May P | |
| Consensus | 51.9 |
| Previous | 52.7 |
| 12:30 | USD |
| Initial Jobless Claims (May 15) | |
| Consensus | 210K |
| Previous | 211K |
| 12:30 | USD |
| Building Permits Apr | |
| Consensus | 1.38M |
| Previous | 1.37M |
| 12:30 | USD |
| Housing Starts Apr | |
| Consensus | 1.42M |
| Previous | 1.50M |
| 12:30 | USD |
| Philadelphia Fed Manufacturing Survey May | |
| Consensus | 15.3 |
| Previous | 26.7 |
| 13:45 | USD |
| Manufacturing PMI May P | |
| Consensus | 53.7 |
| Previous | 54.5 |
| 13:45 | USD |
| Services PMI May P | |
| Consensus | 51.3 |
| Previous | 51 |
| 14:00 | EUR |
| Eurozone Consumer Confidence May P | |
| Consensus | -21 |
| Previous | -20.6 |
| 14:30 | USD |
| Natural Gas Storage (May 15) | |
| Consensus | 96B |
| Previous | 85B |
Friday, May 22, 2026
| GMT | Ccy | Events | Cons | Prev |
|---|---|---|---|---|
| 22:45 | NZD | Retail Sales Q/Q Q1 | 0.50% | 0.90% |
| 22:45 | NZD | Retail Sales ex Autos Q/Q Q1 | 0.80% | 1.50% |
| 23:01 | GBP | GfK Consumer Confidence May | -28 | -25 |
| 23:30 | JPY | National CPI Y/Y Apr | 1.50% | |
| 23:30 | JPY | National CPI Core Y/Y Apr | 1.70% | 1.80% |
| 23:30 | JPY | National CPI Core-Core Y/Y Apr | 2.40% | |
| 06:00 | EUR | Germany GDP Q/Q Q1 F | 0.30% | 0.30% |
| 06:00 | EUR | Germany GfK Consumer Confidence Jun | -33.7 | -33.3 |
| 06:00 | GBP | Retail Sales M/M Apr | -0.60% | 0.70% |
| 06:00 | GBP | Public Sector Net Borrowing (GBP) Apr | 20.7B | 12.6B |
| 08:00 | EUR | Germany IFO Business Climate May | 84.2 | 84.4 |
| 08:00 | EUR | Germany IFO Current Assessment May | 85.1 | 85.4 |
| 08:00 | EUR | Germany IFO Expectations May | 83.5 | 83.3 |
| 12:30 | CAD | Industrial Product Price M/M Apr | 1.20% | 2.40% |
| 12:30 | CAD | Raw Material Price Index M/M Apr | 2.70% | 12% |
| 12:30 | CAD | Retail Sales M/M Mar | 0.60% | 0.70% |
| 12:30 | CAD | Retail Sales ex Autos M/M Mar | 0.90% | 0.50% |
| 14:00 | USD | UoM Consumer Sentiment May F | 48.2 | 48.2 |
| 14:00 | USD | UoM 1-Yr Inflation Expectations May F | 4.50% |
| 22:45 | NZD |
| Retail Sales Q/Q Q1 | |
| Consensus | 0.50% |
| Previous | 0.90% |
| 22:45 | NZD |
| Retail Sales ex Autos Q/Q Q1 | |
| Consensus | 0.80% |
| Previous | 1.50% |
| 23:01 | GBP |
| GfK Consumer Confidence May | |
| Consensus | -28 |
| Previous | -25 |
| 23:30 | JPY |
| National CPI Y/Y Apr | |
| Consensus | |
| Previous | 1.50% |
| 23:30 | JPY |
| National CPI Core Y/Y Apr | |
| Consensus | 1.70% |
| Previous | 1.80% |
| 23:30 | JPY |
| National CPI Core-Core Y/Y Apr | |
| Consensus | |
| Previous | 2.40% |
| 06:00 | EUR |
| Germany GDP Q/Q Q1 F | |
| Consensus | 0.30% |
| Previous | 0.30% |
| 06:00 | EUR |
| Germany GfK Consumer Confidence Jun | |
| Consensus | -33.7 |
| Previous | -33.3 |
| 06:00 | GBP |
| Retail Sales M/M Apr | |
| Consensus | -0.60% |
| Previous | 0.70% |
| 06:00 | GBP |
| Public Sector Net Borrowing (GBP) Apr | |
| Consensus | 20.7B |
| Previous | 12.6B |
| 08:00 | EUR |
| Germany IFO Business Climate May | |
| Consensus | 84.2 |
| Previous | 84.4 |
| 08:00 | EUR |
| Germany IFO Current Assessment May | |
| Consensus | 85.1 |
| Previous | 85.4 |
| 08:00 | EUR |
| Germany IFO Expectations May | |
| Consensus | 83.5 |
| Previous | 83.3 |
| 12:30 | CAD |
| Industrial Product Price M/M Apr | |
| Consensus | 1.20% |
| Previous | 2.40% |
| 12:30 | CAD |
| Raw Material Price Index M/M Apr | |
| Consensus | 2.70% |
| Previous | 12% |
| 12:30 | CAD |
| Retail Sales M/M Mar | |
| Consensus | 0.60% |
| Previous | 0.70% |
| 12:30 | CAD |
| Retail Sales ex Autos M/M Mar | |
| Consensus | 0.90% |
| Previous | 0.50% |
| 14:00 | USD |
| UoM Consumer Sentiment May F | |
| Consensus | 48.2 |
| Previous | 48.2 |
| 14:00 | USD |
| UoM 1-Yr Inflation Expectations May F | |
| Consensus | |
| Previous | 4.50% |
Week Ahead: Geopolitics, Warsh, Nvidia and Data to Test Markets
- Stalled US-Iran talks support high oil prices and periodic risk-off market moves.
- Focus shifts to new Fed Chair and Fedspeak as inflationary pressures accelerate.
- Nvidia earnings could extend or derail the US equity rally; gold lacks bullish catalysts.
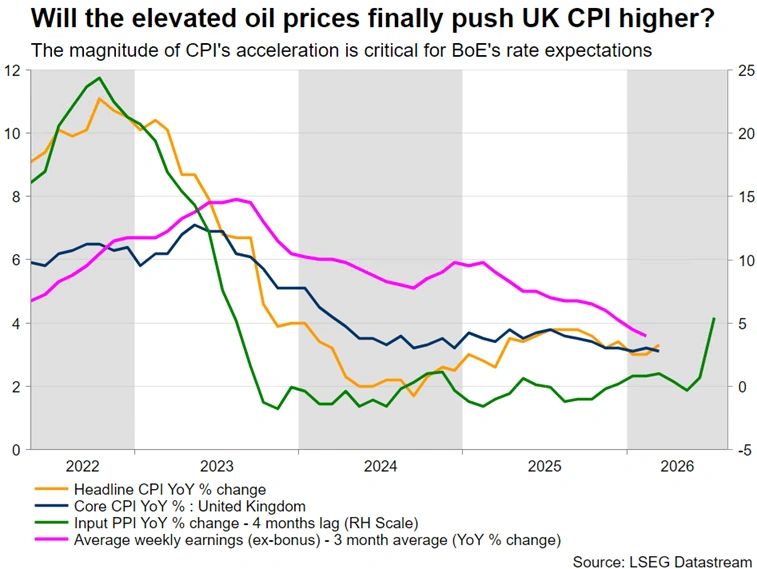
- PMIs are key to Euro’s performance; UK political unrest could intensify, weakening the Pound.
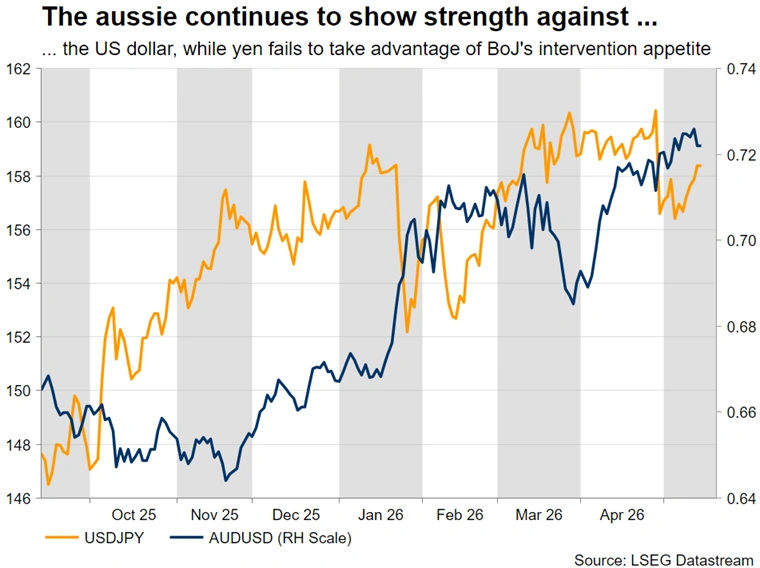
- Dollar/Yen rises again as BoJ’s intervention strategy fails.
Middle East Conflict Dictates Market Sentiment
Two-and-a-half months since the start of the US-Iran conflict, and a comprehensive agreement remains elusive. Behind-closed-doors negotiations continue, but there seems to be reduced incentives from both sides to find the solution that will reopen the Strait of Hormuz. This leaves the rest of the world fighting over reduced oil supply, keeping prices above $100, central bankers on edge and causing short-lived episodes of risk-off.
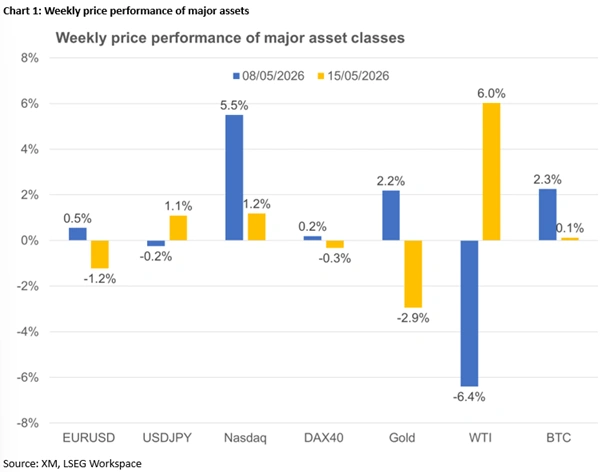
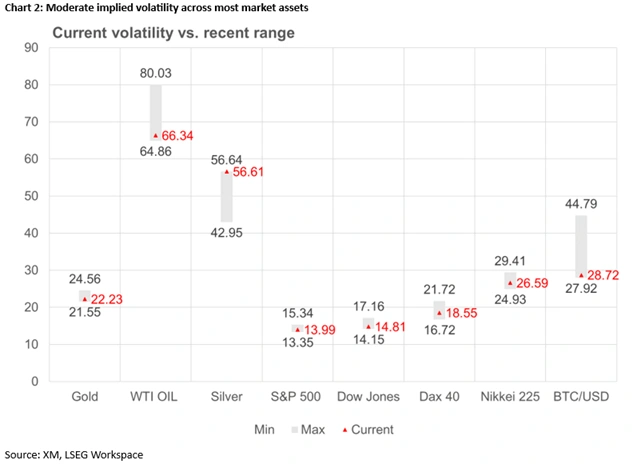
Following a period of range-trading, both the US dollar and gold are on the move, at the time of writing, driven mostly by Middle East headlines. Meanwhile, US equity indices have posted fresh all-time highs, despite the mixed data releases, while, oddly, bitcoin appears to be more responsive to these economic outlook concerns. With implied volatility remaining moderate, which events could shake markets next week?
Chair Powell Is Replaced by Warsh: The End of an Era
After eight years in charge, Powell’s term as the Chair of the Federal Reserve has been completed, with Kevin Warsh officially taking office. His monetary policy views are still a black box, but the countdown for his first speech, which would be extremely market-moving, has just commenced.
In this context, the minutes from the April meeting will be released on Wednesday. Investors will be interested in the extent of the hawkish debate within the council, and the members’ willingness to decide on a rate change in June. With Warsh in charge, the overall stance could materially shift though, but the minutes and the continued Fedspeak will give a strong indication of where the center of gravity lies within the council.
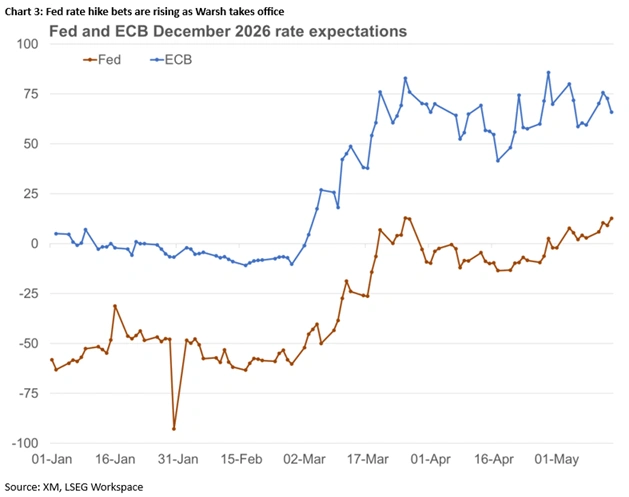
Various housing data, the preliminary PMIs and the Philadelphia Fed Manufacturing survey would offer valuable information on the underlying economic trends. Notably, despite the strongly accelerating CPI and PPI reports, markets are currently pricing in just 13bps of tightening in December, with the first 25bps rate hike fully priced in by April 2027.
Therefore, the dollar will remain torn between various headwinds and tailwinds. A US-Iran agreement, a harder stance on tariffs and potentially abysmal US Treasury auctions, Wednesday’s 20-year auctions could be the weakest link, might dent the dollar’s appeal, while renewed Middle East headlines keeping the door open to fresh hostilities, beefed up chances of rate hikes, and the continued strong performance by US equities will keep the dollar in demand.
The latter is key, as Wall Street continues to ignore the US economic data, concerns over a global slowdown and rising US Treasury yields, attracting interest from domestic and foreign investors. The focus shifts to the Nvidia earnings announcement on Wednesday, when a stellar report, with an upbeat outlook, would drive major US equity indices even higher. This also means that the bar for disappointment is rather low, as any hint of easing demand or lower investment appetite could hit risk appetite considerably, sending shockwaves across asset classes.
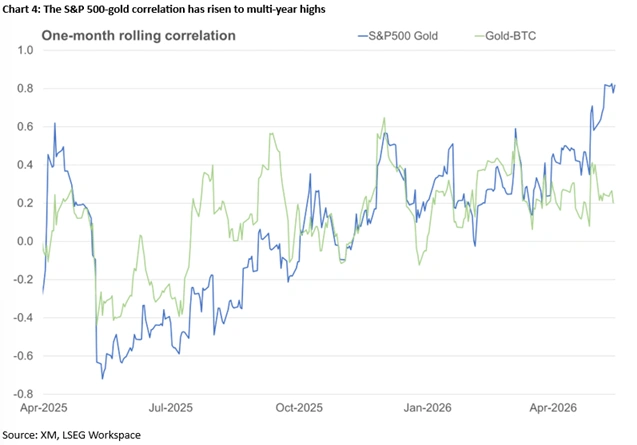
Meanwhile, gold remains driven by the dollar’s bouts of strength, higher Treasury yields and shrinking real rates. When investors eventually refocus on tariffs and the US ballooning debt, gold could surge again, but, at the moment, it remains highly correlated with equities. Interestingly, the one-month correlation between gold and the S&P 500 index has risen to the highest level since October 2012, when gold was drawn into a three-year long decline, losing around 40% of its then value.
Both the Euro and the Pound Face Various Issues
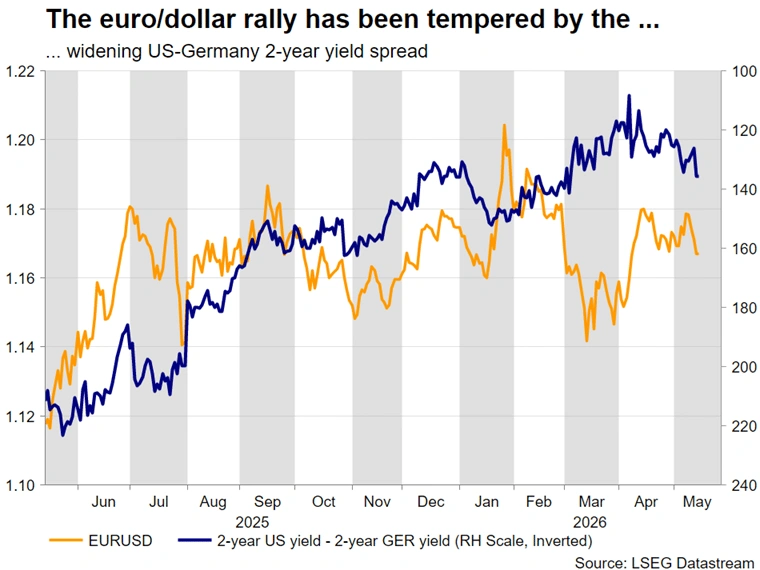
With inflation indicators edging higher, and the hawks appearing to have the upper hand in the ECB, the June rate hike seems inevitable, unless the US-Iran conflict is sorted fairly swiftly, with the Euro benefiting from the dollar’s broad weakness.
ECB doves are focused on the likely economic slowdown, and hence a weak set of PMI figures next week, showing for example a drop in the Germany Manufacturing PMI below 50, will not be taken lightly by the doves. That said, with the ECB’s price stability mandate and the price subindices of both German Services and Manufacturing PMIs rising to multi-year highs in April, rate hike bets will remain supported even if the Euro finds itself under selling pressure on expectations for a weak Q2 GDP performance.
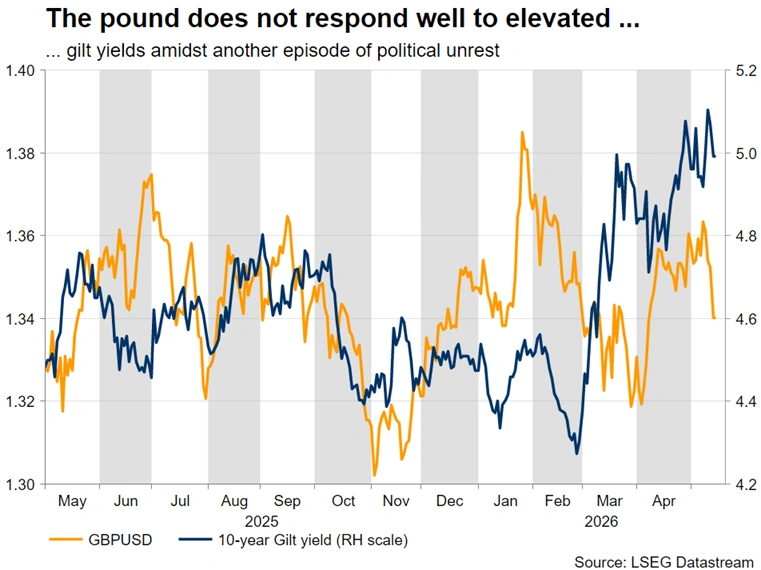
The situation is far more complicated in the UK. PM Starmer’s days in charge appear to be numbered, with the probability of a more left-leaning PM taking office rising daily, bringing back memories of the Truss market rout. Long-term gilt yields have climbed to a two-decade high, with the 30-year hovering above 5%, while the Pound is down 2% against the Dollar this week.
Meanwhile, despite the satisfaction with the Q1 and March GDP and production figures, economic sentiment remains weak, especially as there are concerns about consumer spending. This sentiment will be tested next week, with a barrage of data for April and more specifically, the Claimant Count figure, and the inflation and retail sales reports.
In particular, a jump in CPI near 4%, coupled with a weaker set of preliminary PMI surveys, which coincidentally have been holding up very well with the April Manufacturing survey climbing to a four-year high despite the evident inflation acceleration, would deepen the schism within the MPC ranks. The hawks are expected to become even bolder about their intention to support a June rate hike, with Pound traders being more worried about the growth outlook and the political unrest.
Never-Ending Pressure on the Yen
After dropping by five big figures on April 30, Dollar/Yen has climbed above 158 again, as investors are reacting to the weak approach by Japanese officials in terms of actual market intervention. Understandably, a sustainable Yen rally needs strong economic data and a realistic chance of tighter policy ahead, both of which could improve next week. A strong Q1 GDP report, along with another jump in the manufacturing PMI survey and further hawkish rhetoric from BoJ officials, could convince investors that a BoJ June rate hike is more likely than not.
Loonie’s Mixed Outlook, Aussie Focuses on China’s Data
Aussie traders will watch Monday’s Chinese data for some much-needed signals that the Chinese economy is finally over the recent prolonged soft patch, though such signals are highly unlikely considering the wider economic tensions, and Tuesday’s RBA minutes for hawkish signs to trigger another upleg in Aussie/Dollar.
In the meantime, the Loonie has been on the back foot in May, with the focus shifting to Tuesday’s April CPI report and Friday’s retail sales figures. An initial Loonie rally due to a potentially strong upside surprise in inflation would fade if retail sales data point to deteriorating domestic demand. Stagflation would complicate the BoC’s outlook, with the balance tilting towards rate cuts if tariff developments return to the spotlight again.
GBP/USD Mid-Day Outlook
Daily Pivots: (S1) 1.3352; (P) 1.3442; (R1) 1.3490; More...
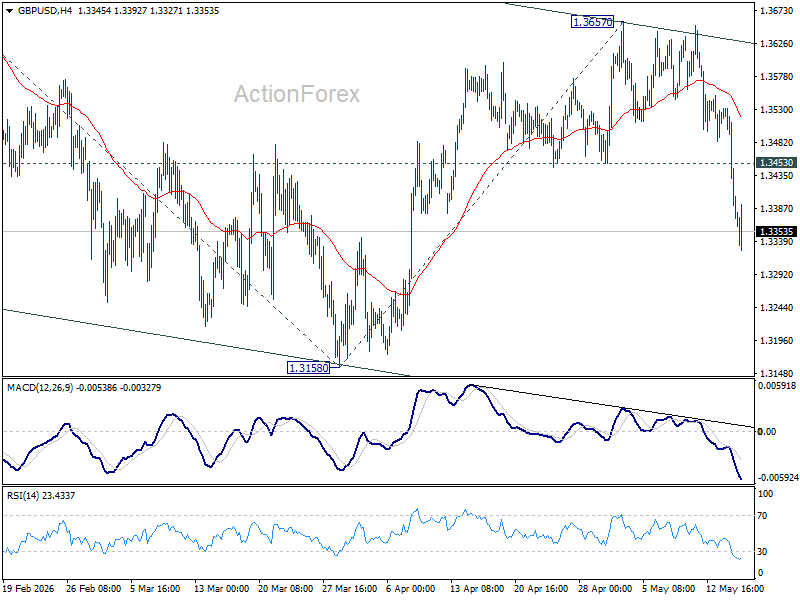
Intraday bias in GBP/USD remains on the downside as fall from 1.3657 is in progress. Retest of 1.3158 support should be seen next. Decisive break there will target 100% projection of 1.3867 to 1.3158 from 1.3657 at 1.2948. For now, risk will stay on the downside as long as 1.3453 support turned resistance holds, in case of recovery.
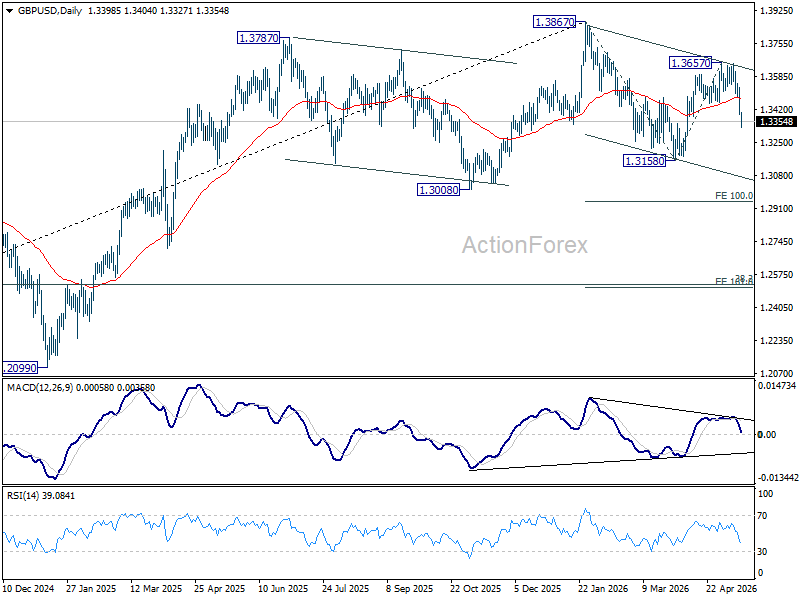
In the bigger picture, current development suggests that price actions from 1.3867 are merely a corrective pattern within the broader up trend from 1.0351 (2022 low). With 1.3008 support intact, medium term bullishness is maintained and break of 1.3867 is in favor for a later stage, towards 1.4248 key resistance (2021 high). However, firm break of 1.3008 will at least bring deeper fall to 38.2% retracement of 1.0351 to 1.3867 at 1.2524, with increased risk of bearish reversal.
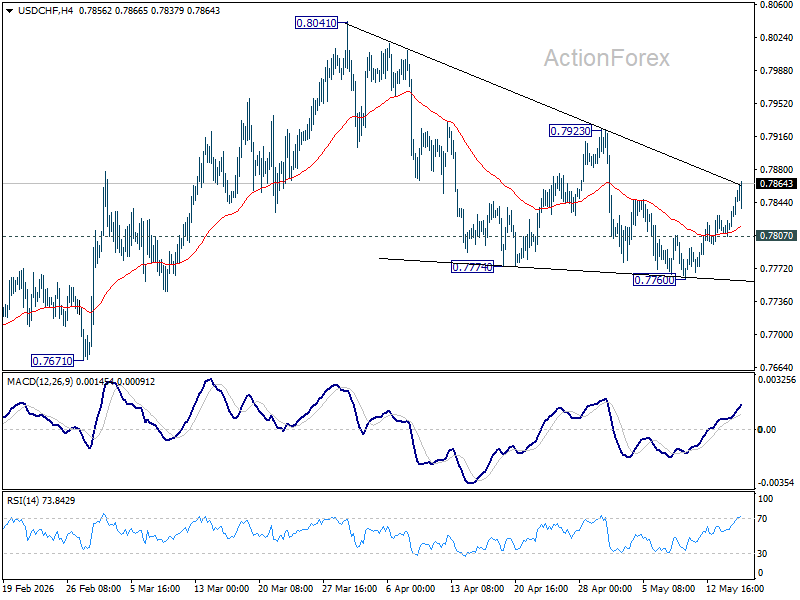
USD/CHF Mid-Day Outlook
Daily Pivots: (S1) 0.7813; (P) 0.7826; (R1) 0.7846; More….
Intraday bias in USD/CHF remains on the upside as rebound from 0.7760 continues. Break of 0.7923 resistance will argue that fall from 0.8041 has completed as a three wave correction, and bring further rise to retest this high. On the downside, below 0.7807 minor support will turn intraday bias neutral first.
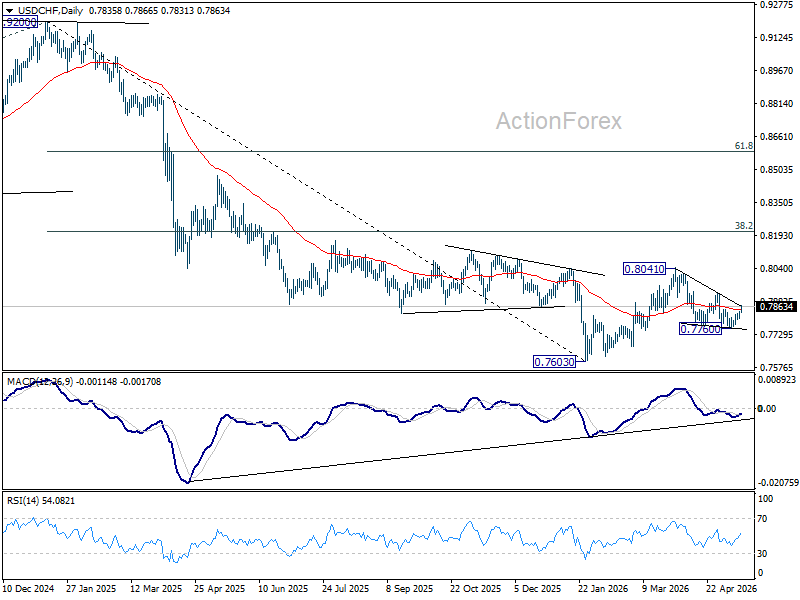
In the bigger picture, as long as 55 W EMA (now at 0.8051) holds, fall from 0.9200 is expected to continue, as part of the larger down trend. Firm break of 0.7603 will target 100% projection of 1.0146 (2022 high) to 0.8332 from 0.9200 at 0.7382.
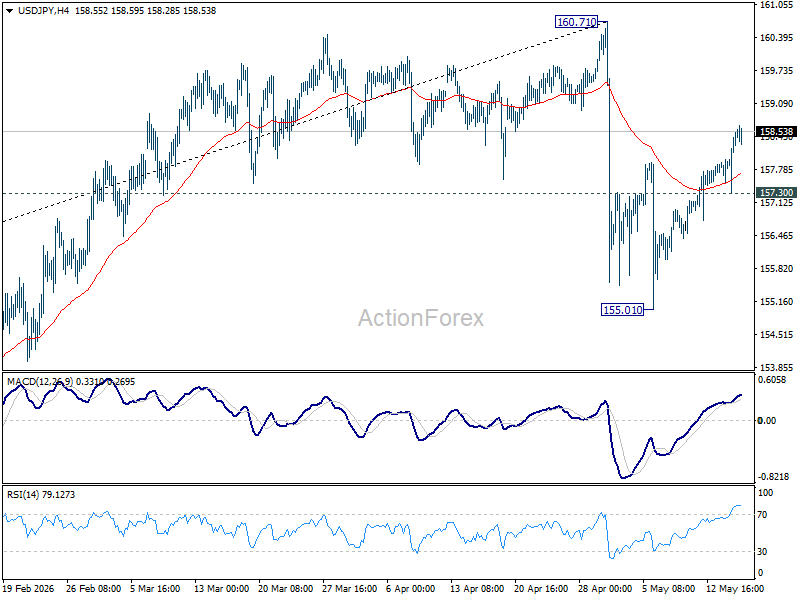
USD/JPY Mid-Day Outlook
Daily Pivots: (S1) 157.62; (P) 158.01; (R1) 158.74; More...
Intraday bias in USD/JPY remains on the upside as rise from 155.01 is in progress. As this rebound is seen as the second leg of the corrective pattern from 160.71, strong resistance should emerge from there to limit upside. On the downside, break of 157.30 minor support will argue that the third leg could have started, and target 155.01 support instead.
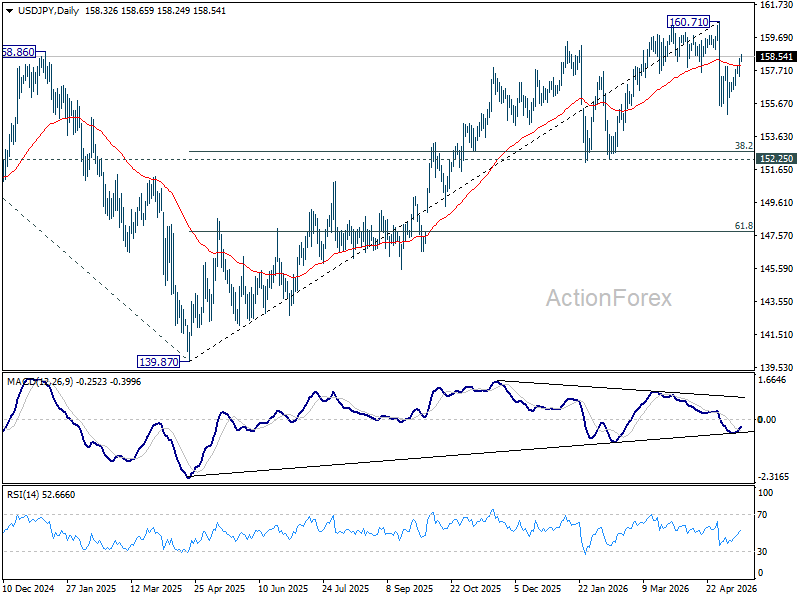
In the bigger picture, for now, corrective pattern from 161.94 (2024 high) is still seen as completed at 139.87. Rise from there is seen as resuming the long term up trend. So, break of 161.94 is expected at a later stage to resume the long term up trend. However, sustained break of 55 W EMA (now at 154.13) will dampen this view and bring deeper fall back towards 139.87 to extend the pattern from 161.94.
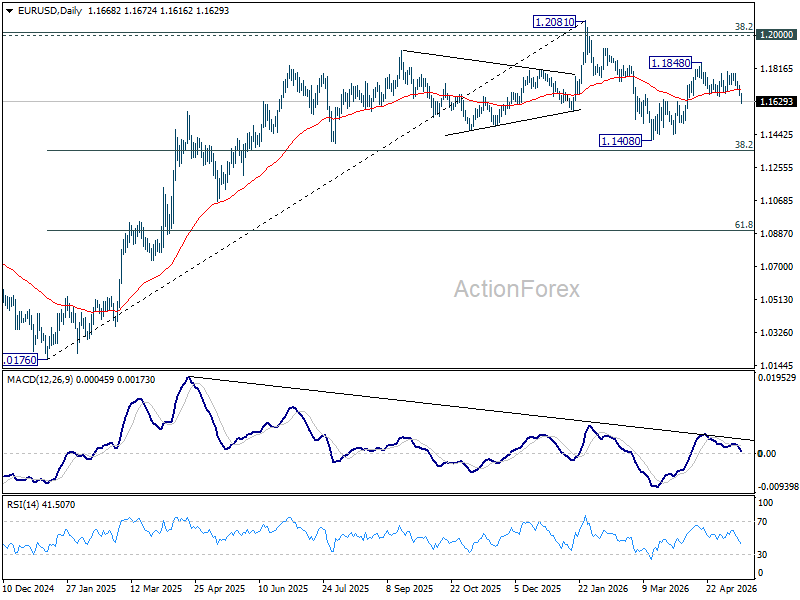
EUR/USD Mid-Day Outlook
Daily Pivots: (S1) 1.1647; (P) 1.1684; (R1) 1.1703; More….
EUR/USD's decline continues today and the break of 1.1639 resistance turned support suggests that rebound from 1.1408 has completed as a corrective three-wave move at 1.1848. Intraday bias remains on the downside for retesting 1.1408 low. Firm break there resume the whole fall from 1.2081. On the upside, above 1.1694 resistance will turn intraday bias neutral first.
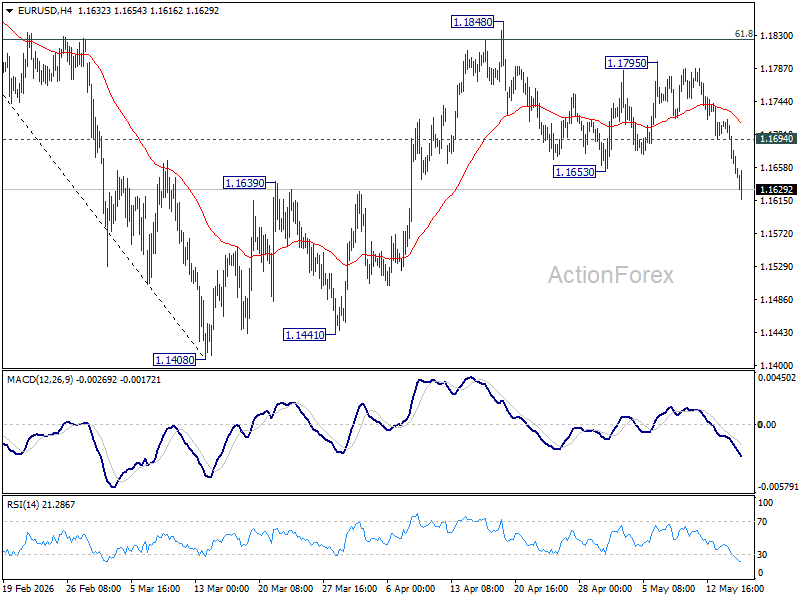
In the bigger picture, the strong support from 38.2% retracement of 1.0176 to 1.2081 at 1.1353 suggests that the pullback from 1.2081 is more likely a corrective move. Strong support was also found in 55 W EMA (now at 1.1539). Focus is back on 1.2 key cluster resistance level. Decisive break there will carry long term bullish implications. Nevertheless, break of 1.1408 support will revive the case of medium term bearish trend reversal.
Dollar Surges as Markets Price Longer Hormuz Crisis and Persistent Inflation
Risk sentiment deteriorated sharply today as investors concluded that the Trump-Xi summit failed to deliver a credible diplomatic breakthrough on the Strait of Hormuz, forcing markets to begin pricing a longer-lasting inflation shock tied to prolonged energy disruption. Global equities and precious metals are sold off together as rising oil prices and higher Treasury yields tightened global financial conditions. Dollar surged broadly in response, supported simultaneously by rising US yields, inflation fears, and defensive risk positioning.
China’s Foreign Ministry stated on Friday that shipping routes “should be reopened as soon as possible” and called for a “comprehensive and lasting” ceasefire. However, Beijing provided no operational details regarding how such reopening would be achieved, nor any indication that China would actively pressure Tehran into ending disruption risks in the Strait.
At the same time, the core strategic issue surrounding Iran’s uranium enrichment program remains unresolved. While US President Donald Trump said that: “We don't want them to have a nuclear weapon,” neither side provided clarity regarding enrichment limits, inspections, or broader nuclear conditions. For markets, the central issue increasingly remains a “black box.”
Instead of signaling de-escalation, investors interpreted Trump’s comments regarding expanded Chinese purchases of US crude as evidence that Washington may be preparing for a prolonged disruption rather than expecting rapid normalization. Trump said after the summit: “China is going to buy oil from the US.” That statement appears to have shifted market thinking away from a “Hormuz reopening” scenario toward a “supply rerouting” scenario.
Markets had previously hoped Beijing would use its leverage as the largest buyer of Iranian oil to pressure Tehran toward reopening shipping routes. Instead, the summit outcome increasingly suggests that global energy trade may simply adapt around continuing disruption, leaving the geopolitical risk premium firmly embedded in oil markets.
That interpretation was reinforced further by comments from Iranian Foreign Minister Abbas Araqchi, who said Tehran has “no trust” in the U.S. and remains skeptical about Washington’s intentions. “Contradictory messages” from the Trump administration have complicated negotiations, Araqchi said, while describing Pakistan’s mediation efforts as being in “difficulty” rather than failed outright.
His comments directly highlighted the contradiction between Washington’s simultaneous military pressure campaign and diplomatic messaging. The remarks suggest any meaningful diplomatic off-ramp remains distant after the conclusion of the Trump-Xi summit.
Markets also reacted to reports that the United Arab Emirates will accelerate expansion of a major oil pipeline through Fujairah by 2027, significantly increasing export capacity that bypasses the Strait of Hormuz altogether. That development carries important symbolic significance. Regional producers themselves appear to be preparing for a world where Hormuz instability persists far longer than initially expected.
In currency markets, Dollar remained the strongest performer of the week by a clear margin, followed by Yen and Euro. Kiwi was the weakest currency, followed by Aussie and Swiss Franc. Sterling and Loonie traded in the middle.
In Europe, at the time of writing, FTSE is down -1.67%. DAX is down -1.75%. CAC is down -1.53%. UK 10-year yield is up 0.181 at 5.175. Germany 10-year yield is up 0.088 at 3.131. Earlier in Asia, Nikkei fell -1.99%. Hong Kong HSI fell -1.62%. China Shanghai SSE fell -1.02%. Singapore Strait Times fell -0.14%. Japan 10-year JGB yield rose 0.07 to 2.705.
Oil Surges Toward $110 as Trump-Xi Summit Signals Supply Rerouting, Not Hormuz Resolution
Oil markets rallied after traders concluded the Trump-Xi summit failed to resolve the Hormuz crisis and instead pointed toward a long-term rerouting of global energy flows. Read More.
USD/JPY Climbs Toward 160 as Rising US Yields Test Japan’s Intervention Resolve Again
USD/JPY climbed back toward the critical 160 level as surging US Treasury yields widened the US-Japan rate gap and intensified doubts over whether Japanese intervention can still effectively stabilize the Yen. Read More.
Japan PPI Surges 4.9% as Energy Shock Intensifies
Japan’s wholesale inflation accelerated sharply in April as higher oil prices, chemical costs, and a weak Yen intensified imported inflation pressures, reinforcing expectations for further BoJ tightening. Read More.
New Zealand PMI Falls to 50.5 as New Orders Turn Negative
New Zealand’s manufacturing sector lost significant momentum in April as new orders fell into contraction territory and firms reported rising freight, fuel, and supply-chain pressures linked to the Iran war. Read More.
Fed’s Williams Sees No Need for Rate Changes Right Now
Fed’s John Williams said policymakers see no urgent need to change interest rates despite rising inflation pressures tied to the Middle East conflict, emphasizing that longer-term inflation expectations remain stable for now. Read More.
Fed’s Barr Says Shrinking Balance Sheet Should Not Trump Financial Stability
Fed Governor Michael Barr warned that proposals to shrink the Fed’s balance sheet by weakening bank liquidity requirements could make the financial system more fragile rather than safer. His remarks highlighted growing debate inside the Fed ahead of the Kevin Warsh era. Read More.
EUR/USD Mid-Day Outlook
Daily Pivots: (S1) 1.1647; (P) 1.1684; (R1) 1.1703; More….
EUR/USD's decline continues today and the break of 1.1639 resistance turned support suggests that rebound from 1.1408 has completed as a corrective three-wave move at 1.1848. Intraday bias remains on the downside for retesting 1.1408 low. Firm break there resume the whole fall from 1.2081. On the upside, above 1.1694 resistance will turn intraday bias neutral first.
In the bigger picture, the strong support from 38.2% retracement of 1.0176 to 1.2081 at 1.1353 suggests that the pullback from 1.2081 is more likely a corrective move. Strong support was also found in 55 W EMA (now at 1.1539). Focus is back on 1.2 key cluster resistance level. Decisive break there will carry long term bullish implications. Nevertheless, break of 1.1408 support will revive the case of medium term bearish trend reversal.
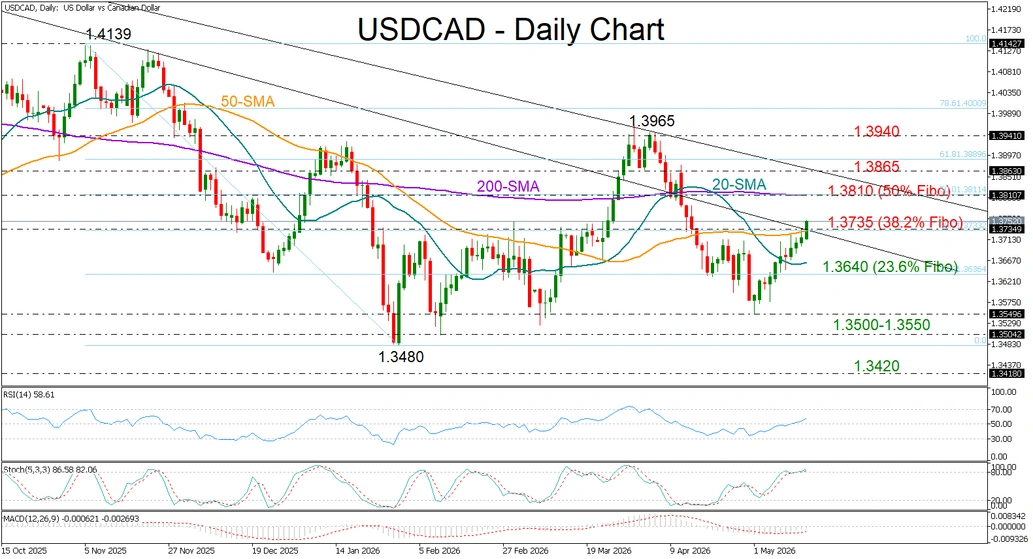
USD/CAD Turns Higher for Second Week, Tests 50-SMA
- USDCAD rises above 1.3700 as gains extend for second consecutive week.
- Technical bias remains positive, but caution emerges near 50-SMA.
USDCAD has traded mostly in positive territory since the beginning of May. After stabilizing around the 1.3500 region for the third time this year, the pair is now attempting to close above its 50-day simple moving average (SMA) near 1.3735. The move follows President Trump’s comments expressing limited patience over Iran-related tensions, while two-day talks with China conclude.
Both the RSI and the MACD suggest improving buying momentum. However, the stochastic oscillator, which is hovering in overbought territory, signals caution as the pair tests the 38.2% Fibonacci retracement of the November–February decline near 1.3735. A decisive break above this level could pave the way toward the 200-day SMA and the 50.0% Fibonacci retracement at 1.3810. Slightly higher, a critical battle could emerge around the descending trendline connecting the 2025 and 2026 highs near 1.3860.
If the pair fails to maintain momentum above the 50-day SMA, it could retreat toward the 23.6% Fibonacci level at 1.3640. A deeper pullback may then retest the 1.3500-1.3550 zone, a break of which could reinforce the broader bearish outlook and expose the 2024 support level at 1.3420.
Overall, USDCAD remains in a bullish short-term mode, with further gains likely if buyers manage to clear the 1.3735 resistance area decisively. Nevertheless, the broader outlook remains bearish as long as the pair stays below 1.3860.
Sellers are Pressing Down on Crypto
Market Overview
The crypto market is trading within a narrow range, having bounced off its upper boundary at $2.73T and retreated to $2.67T at the time of writing. New records on the US stock market have spurred crypto buyers into action, but this has proved insufficient to break through key resistance levels. We attribute this weak performance to the strengthening of the dollar, as evidenced by gold’s dynamics. Over the past 24 hours, the top performers among the most liquid coins have been Dash (+4%), Zcash (+3.8%) and Uniswap (+3.1%), while fewer coins are losing ground, with the most significant losses seen in Internet Computer (-8%), Aptos (-1.1%) and Official Trump (-0.8%).
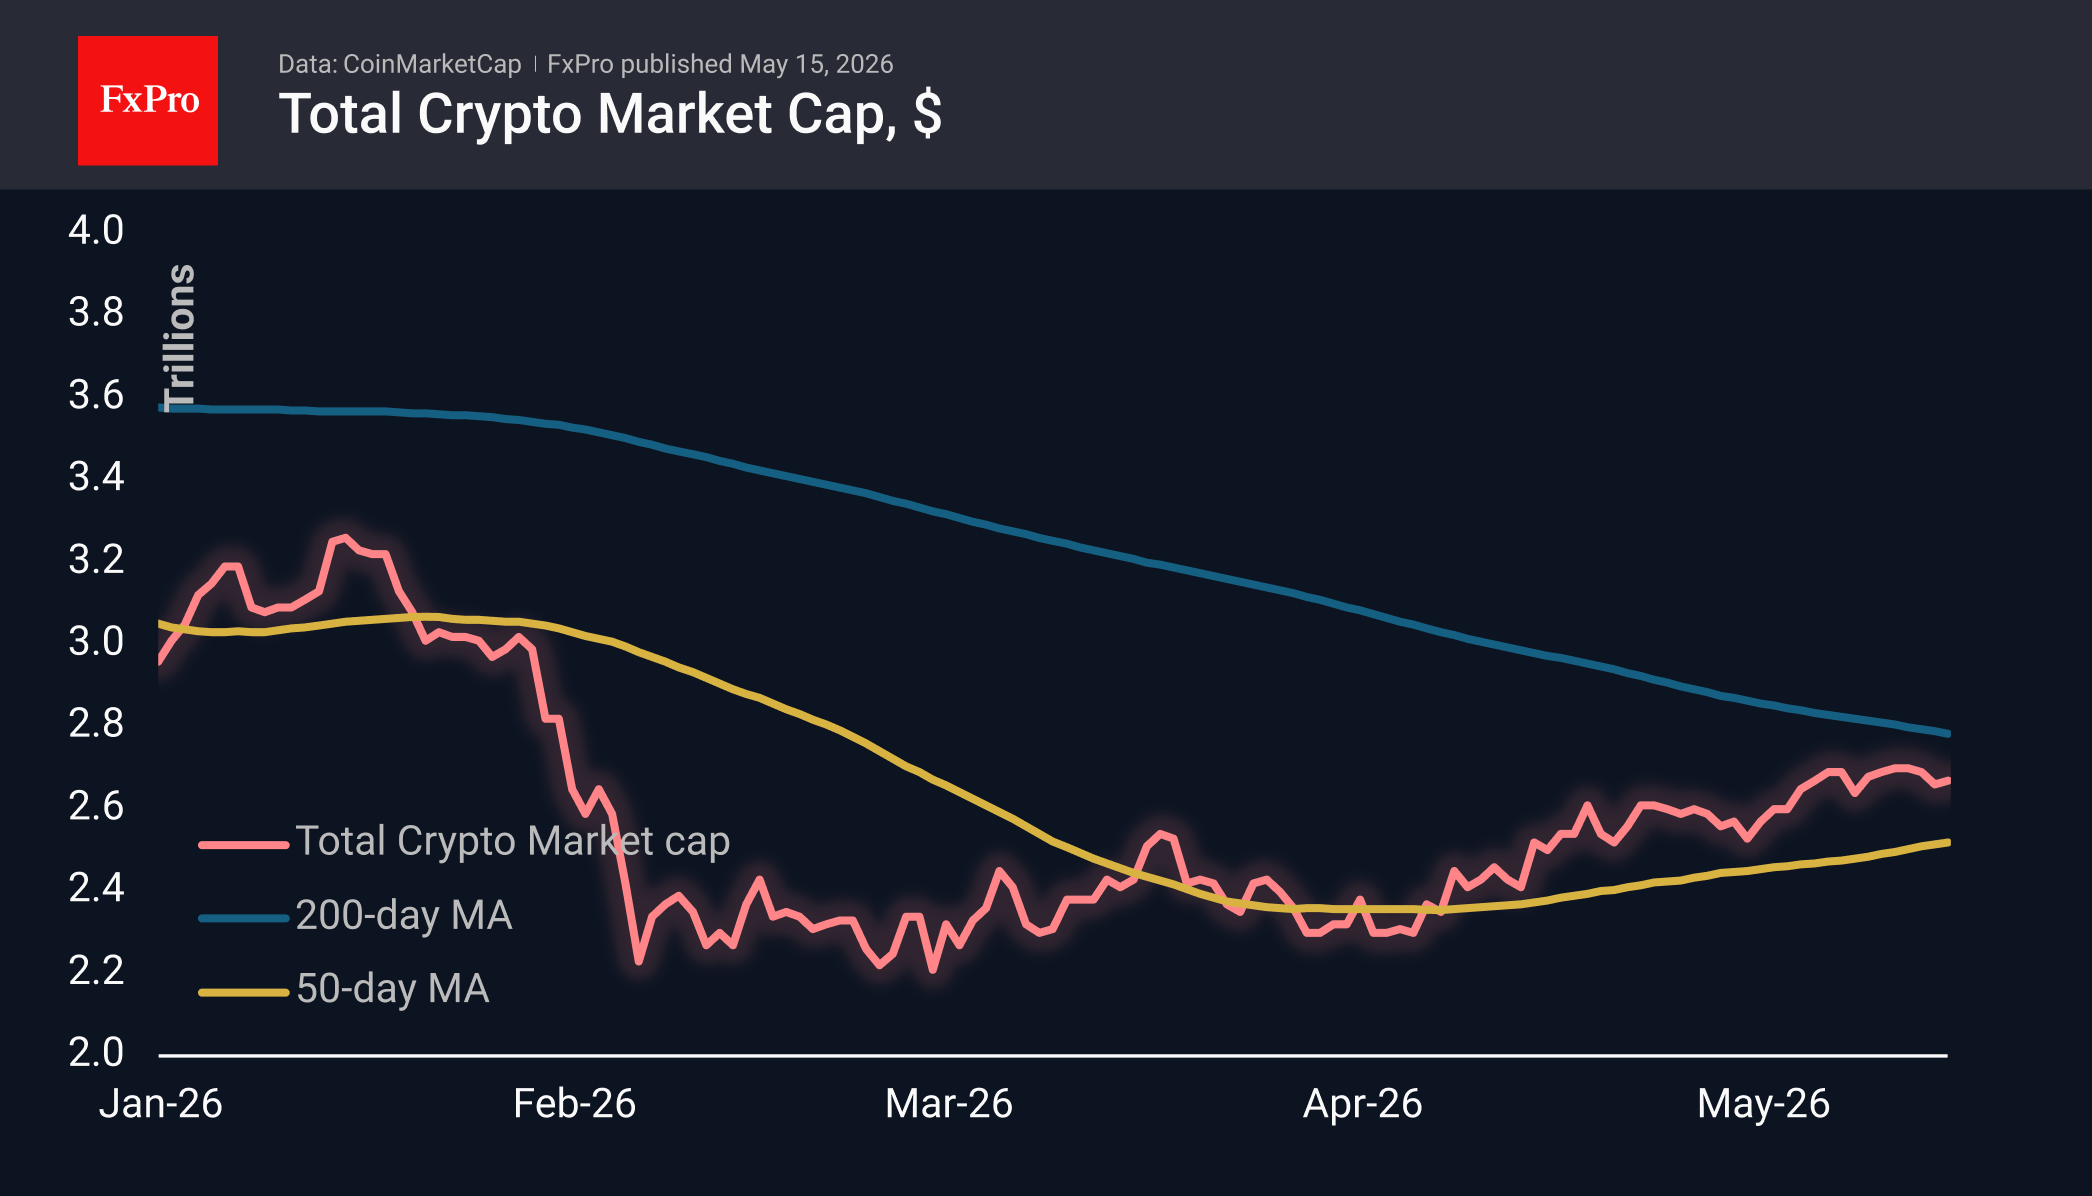
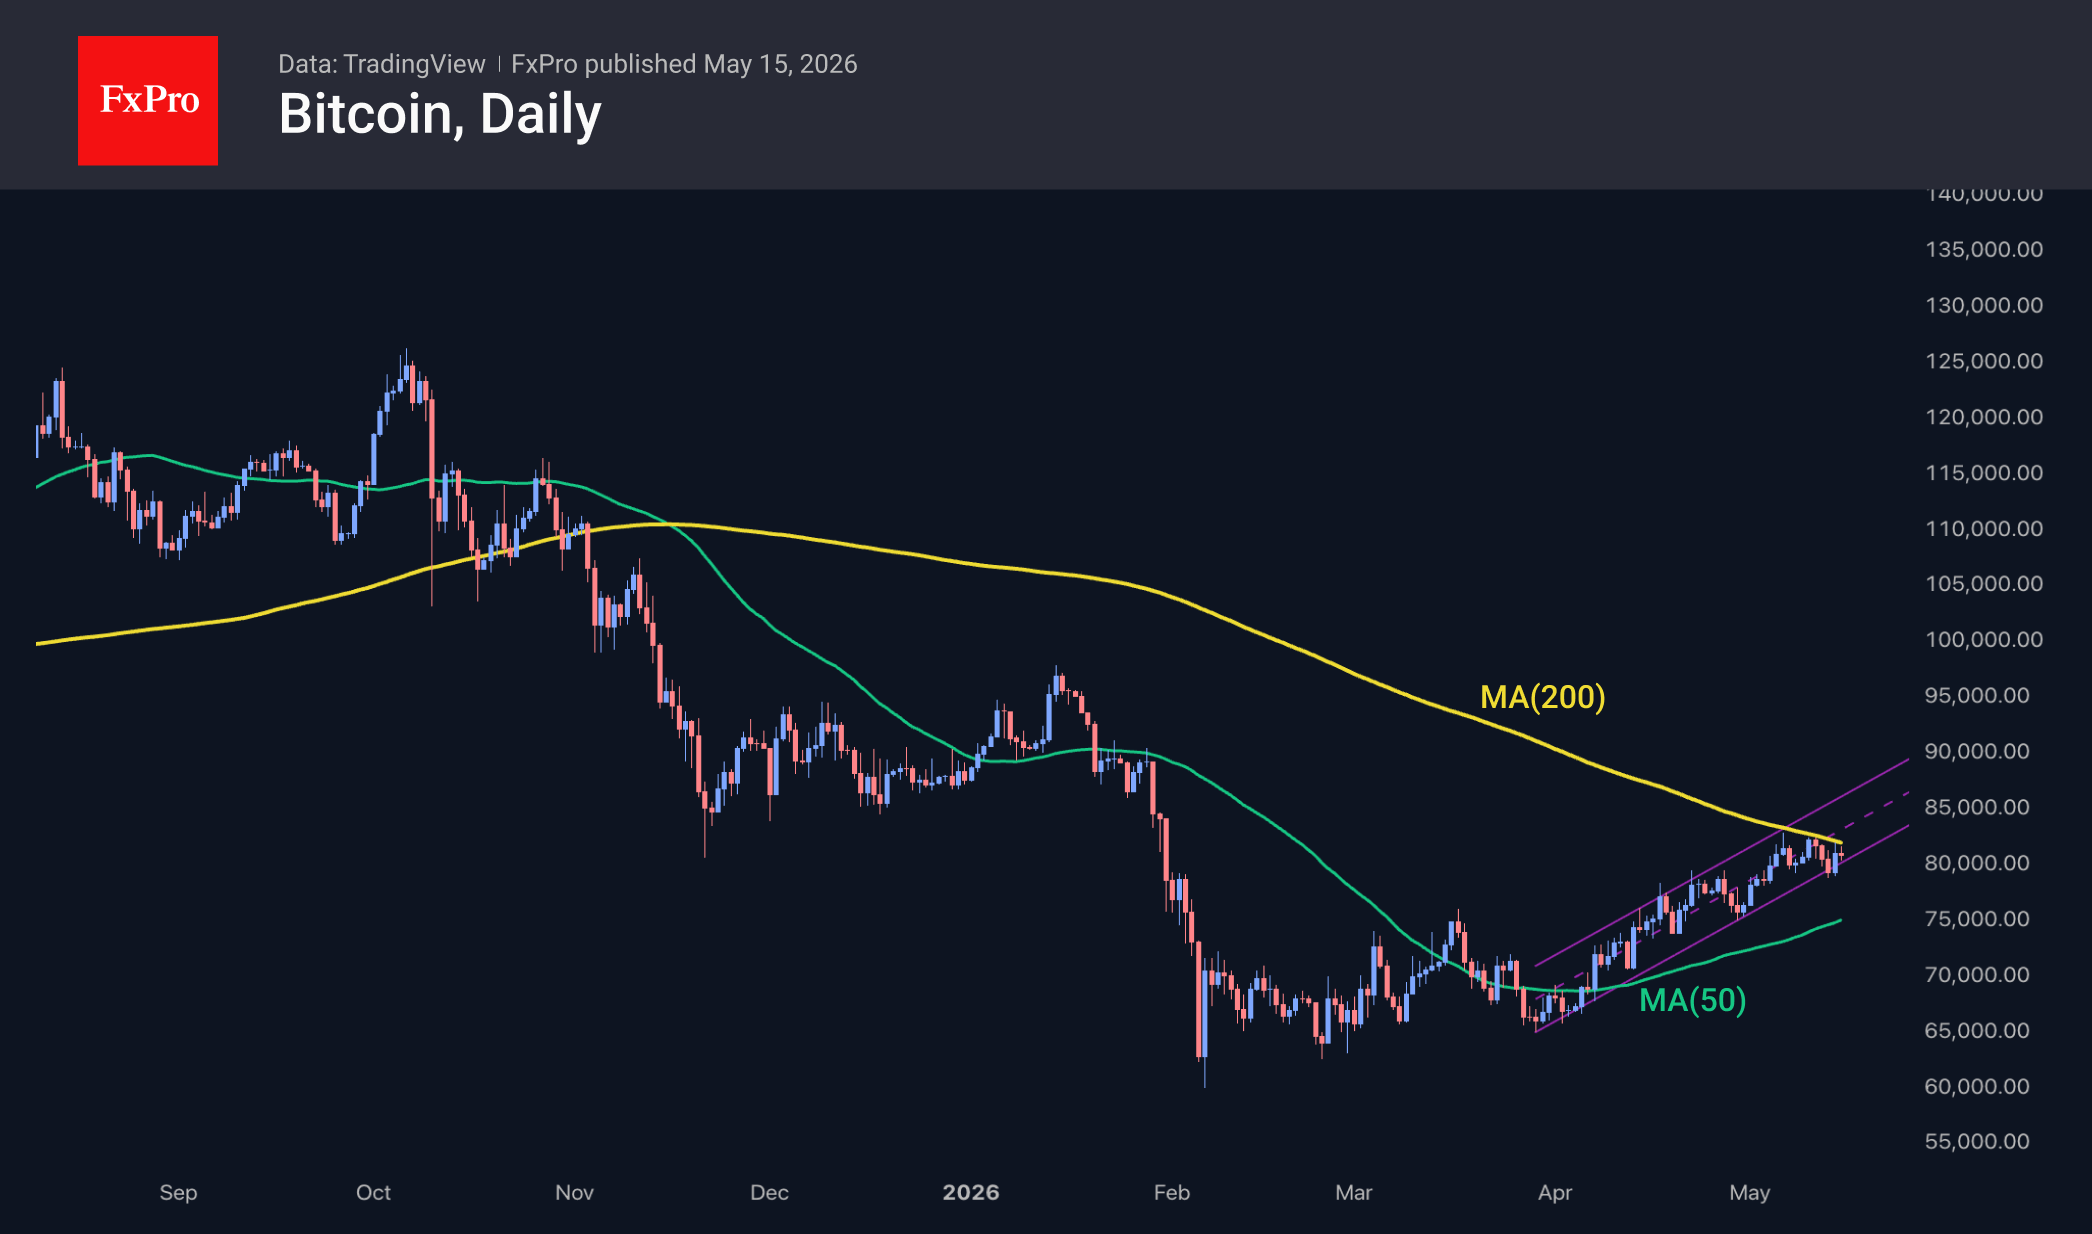
Riding a wave of optimism in equities, Bitcoin rose once again towards $82K, hitting the 200-day moving average once more. This is usually a signal line, but in May, it is acting as an impenetrable resistance level, capping the price from above. As a result, early on Friday, the price once again found itself just above $80K. The prevailing cautious sentiment in equities early on Friday is intensifying the outflow from cryptocurrencies, setting the stage for a decline towards the lower end of the range at $79K by the end of this week.
News Background
Institutional players are using the recent recovery to take profits, and this is not driven by fear or panic, according to Glassnode. CryptoQuant considers the risk of a further decline in Bitcoin to be real against this backdrop.
Activity among companies buying crypto assets for their reserves has also declined. According to Bitfinex, the volume of Bitcoin purchases by large companies has fallen by 80% over the week.
The volume of Ethereum in staking has exceeded 85 million coins — this is more than 70% of the cryptocurrency’s total supply, SharpLink has calculated. ETH reserves on exchanges also continue to decline, which may exacerbate the asset’s shortage.
The altcoin market has shown the first signs of recovery following a 50% drop from previous highs, notes analyst Darkfost. At the same time, liquidity remains limited, which is hindering the start of a sustained alt season.
Kevin Warsh, confirmed this week as the new Fed chair, has described Bitcoin as an “important asset” that helps authorities assess the state of the economy. He has invested in several crypto projects and holds Solana and Optimism tokens.
Following several months of discussions due to disagreements between banks and crypto companies, the US Senate Banking Committee on Thursday approved the CLARITY Act, a bill on the structure of the cryptocurrency market. The bill will now be put before the full Senate for consideration. Bankers fear that the yield on stablecoins stipulated in the bill will lead to an outflow of funds from bank deposits.