

Sample Category Title
EUR/JPY Daily Outlook
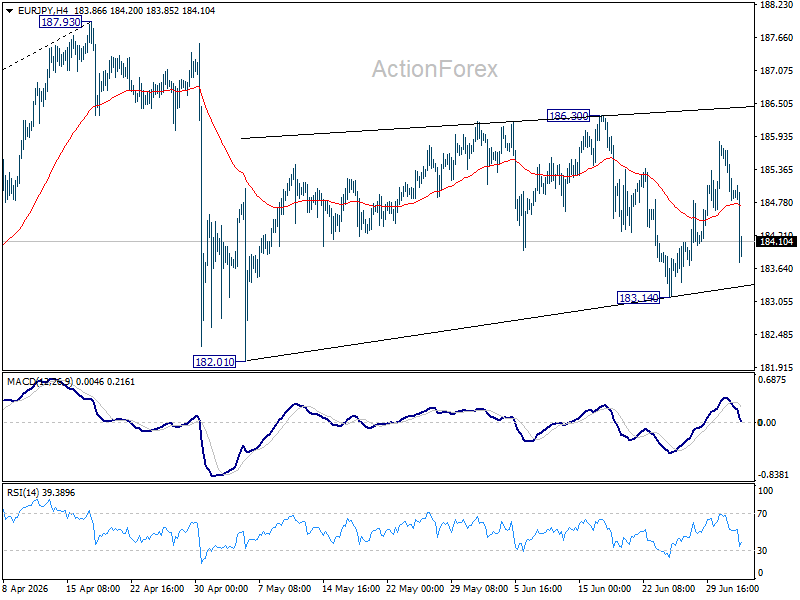
Range trading continues in EUR/JPY and intraday bias remains neutral. Risk will remain mildly on the downside as long as 186.30 resistance holds. Below 183.14 will bring retest of 182.01 support first. However, firm break of 186.30 will resume the rebound from 182.01 to retest 187.93 high.
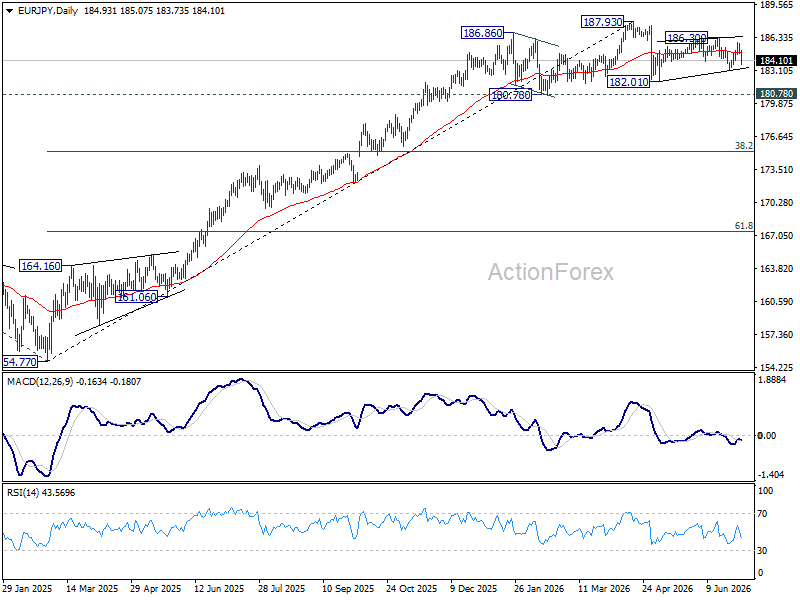
In the bigger picture, there is no sign of reversal yet. Uptrend from 114.42 (2020 low) is still expected to resume at a later stage to 78.6% projection of 124.37 (2022 low) to 175.41 (2025 high) from 154.77 at 194.88. However, sustained break of 55 W EMA (now at 179.37) will argue that it's already in a medium term down trend to 175.41 resistance turned support and below.
EUR/GBP Daily Outlook
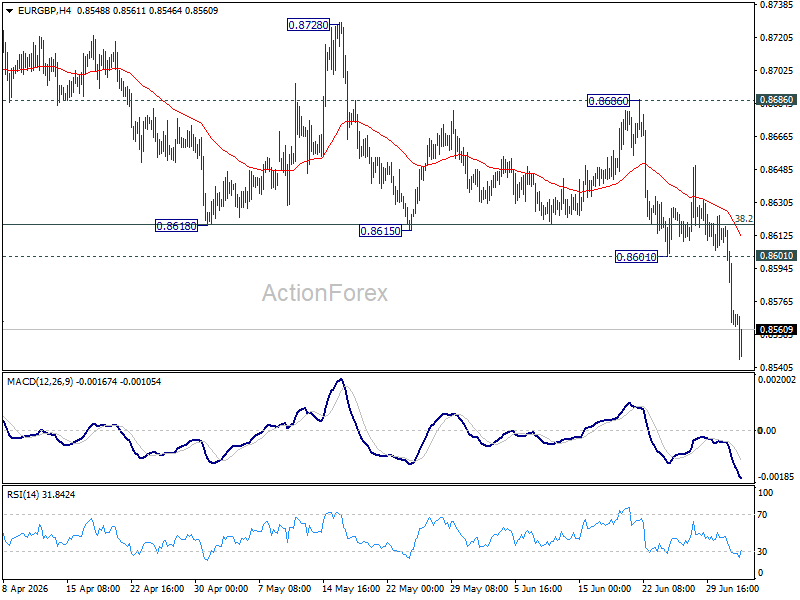
EUR/GBP's downside acceleration and strong break of 38.2% retracement of 0.8221 to 0.8863 at 0.8618 should confirm that rise form 0.8221 has completed at 0.8863. Intraday bias stays on the downside for 61.8% retracement at 0.8466 at next. On the upside, above 0.8601 minor resistance will turn bias neutral first. But risk will stay on the downside as long as 0.8686 resistance holds, in case of recovery.
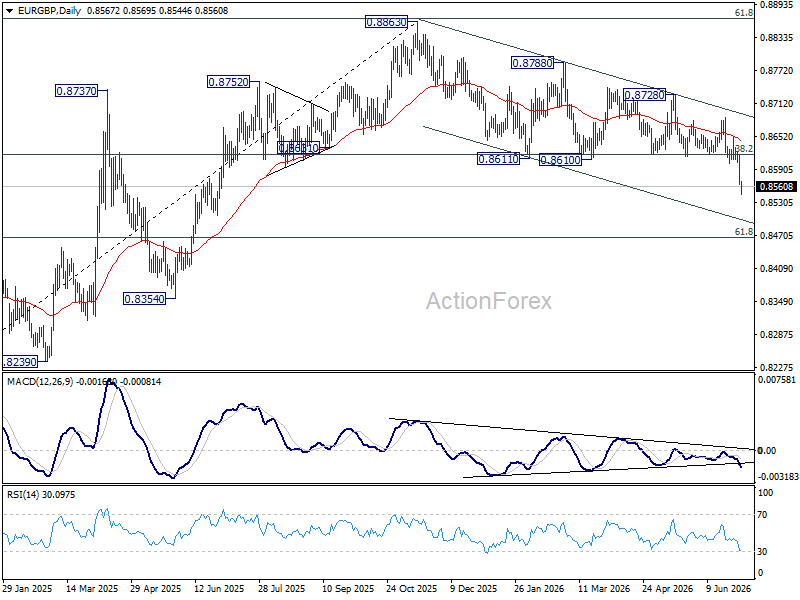
In the bigger picture, current development suggests that rise from 0.8221 (2024 low) has completed at 0.8863, just ahead of 38.2% retracement of 0.8221 (2024 low) to 0.8863 (2025 high) at 0.8618. Deeper fall would be seen back to 0.8201 (2022 low). For now, outlook will be neutral at beast as long as 0.8863 hold.
EUR/AUD Daily Outlook
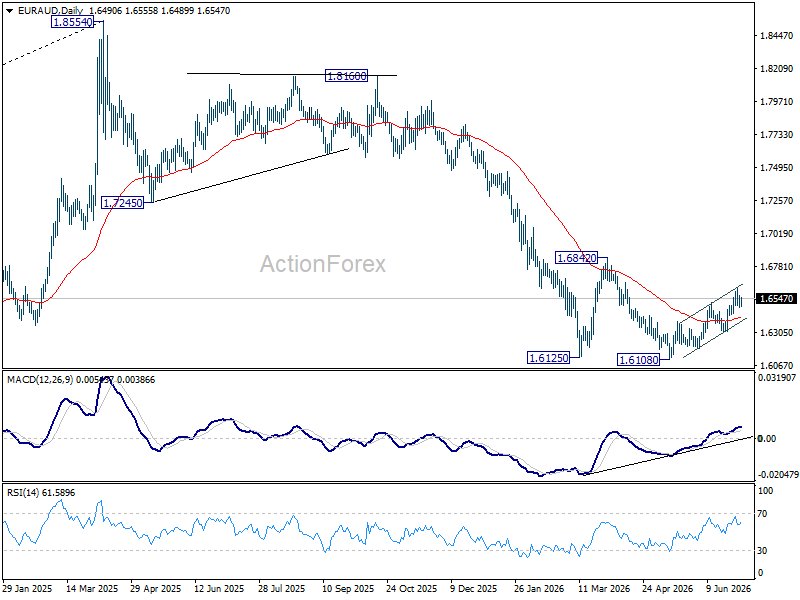
EUR/AUD is staying in consolidations below 1.6617 and intraday bias remains neutral at this point. Further rally remains in favor as long as 1.6306 support holds. Break of 1.6617 will resume the rally from 1.6108 towards 1.6842 resistance.
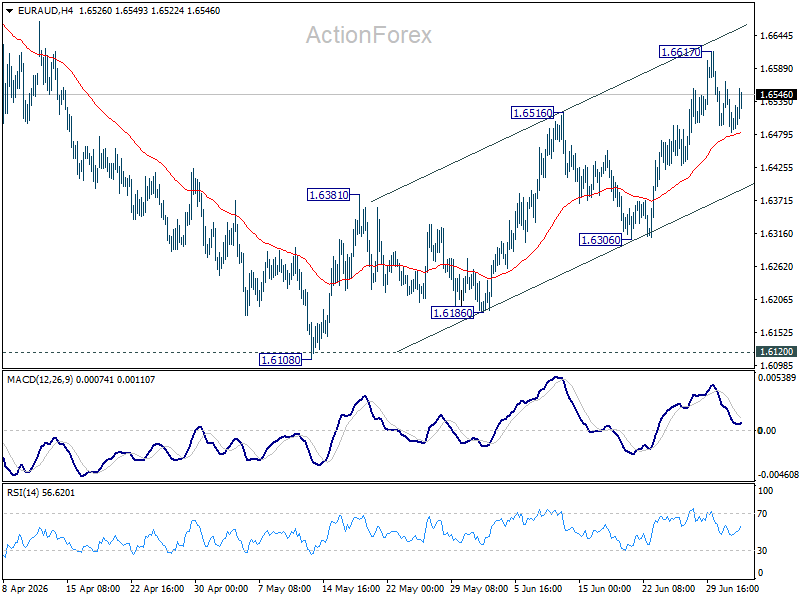
In the bigger picture, outlook will stay bearish as long as 1.6842 resistance holds. Fall from 1.8554 (2025 high) is expected to continue to 61.8% retracement of 1.4281 to 1.8554 at 1.5913. Decisive break there will pave the way back to 1.4281 (2022 low). However, firm break of 1.6842 should confirm medium term bottoming, and bring stronger rally.
EUR/CHF Daily Outlook
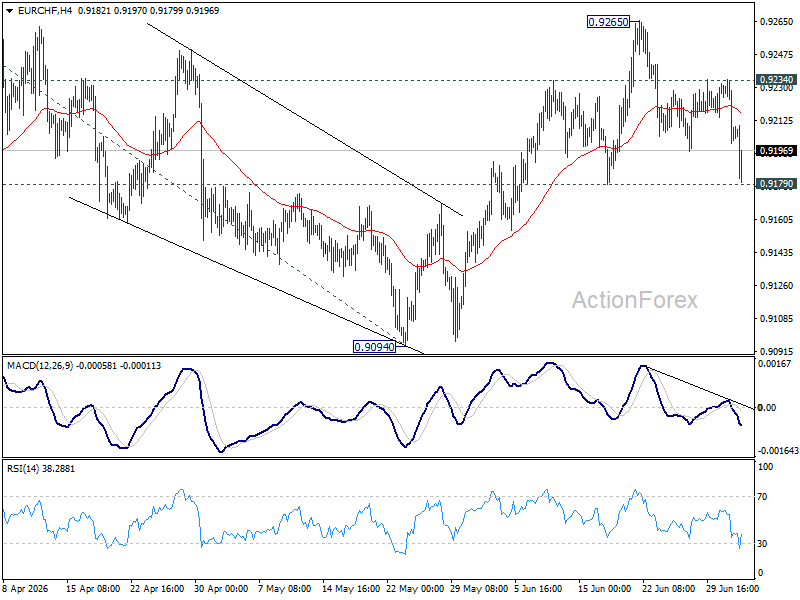
EUR/CHF's correction from 0.9265 extended lower today, but it stays above 0.9179 support. Intraday bias remains neutral first, and further rally is in still in favor. Above 0.9234 will bring stronger rebound to 0.9265. Firm break there will resume the rally from 0.8979 to 100% projection of 0.8979 to 0.9264 from 0.9094 at 0.9379. However, decisive break of 0.9179 will dampen this bullish view and bring deeper fall back to 0.9094 support instead.
In the bigger picture, the break of medium term falling trend line resistance indicates that 0.8979 is already a medium term bottom. Considering bullish convergence condition in W MACD, rise from there should at least be reversing the fall from 0.9928, with prospect of developing into a medium term up trend. Firm break of 0.9394 resistance will add more credence to this case. For now risk will remain on the upside as long as 0.9094 support holds, in case of retreat.
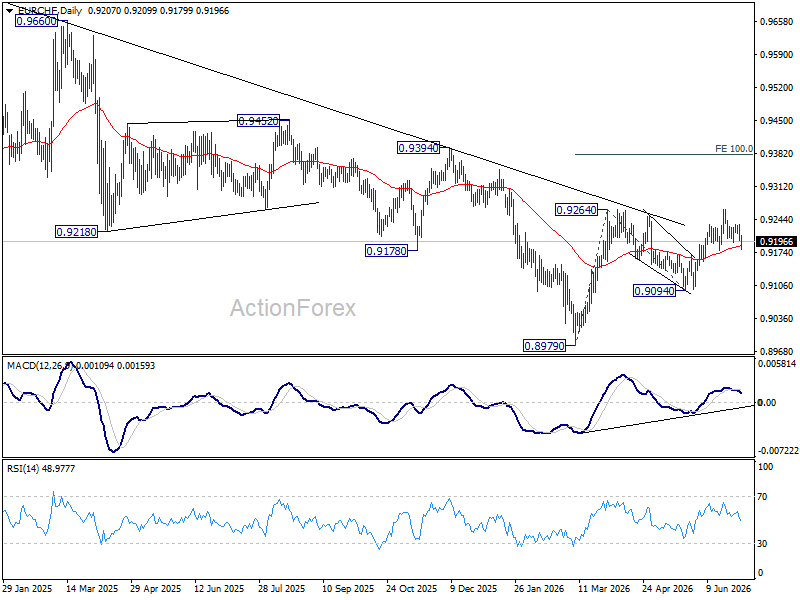
Chart Alert: USD/JPY Plummeted 0.5% on Suspected Deliberate Intervention, Key Levels to Watch Ahead of NFP
Key takeaways
- USD/JPY's sharp intraday reversal bears the hallmarks of official intervention. The sudden 0.5% decline during the Asian-London session, coupled with reports that Japanese authorities may be shifting toward less predictable intervention tactics, suggests policymakers are attempting to curb speculative yen selling without fundamentally altering the prevailing uptrend.
- Interest-rate differentials continue to favour a stronger US dollar. The widening 2-year US Treasury-JGB yield spread and expectations for a resilient US labour market remain supportive of USD/JPY. A stronger-than-expected US non-farm payrolls report could reinforce expectations of further Federal Reserve tightening and renew upward pressure on the pair.
- Crowded speculative positioning raises the risk of sharp squeezes. Net short positions in Japanese yen futures remain near two-year highs, increasing the likelihood that targeted intervention or even the threat of intervention could trigger rapid short-covering rallies without necessarily reversing the broader trend.
- The 160.90 level is the key technical line in the sand. Holding above this support keeps the medium-term bullish outlook for USD/JPY intact, while a decisive break below it would signal that intervention has evolved from a temporary squeeze into a deeper corrective phase.
Out of the blue, the Japanese yen recovered sharply by 0.5% against the US dollar on Thursday, 2 July 2029, at 2 pm SG time (the Asian-to-London handover period).
The USD/JPY staged a steep intraday decline of 0.5% to trade at 161.70 at the time of writing, back below the prior 161.95 (former major resistance from early July 2024 swing highs and prior BoJ intervention).
This type of swift movement smells like FX intervention. So far, there are no official announcements from Japanese authorities, except for a report from Reuters that stated that “Japanese officials are abandoning their habit of telegraphing intervention risks, instead signalling a more targeted campaign to squeeze speculators and raise the cost of betting against the battered yen,” according to sources.
Could it be a deliberate attempt to smooth speculative activities ahead of NFP?
Fig. 1: 2-YR US Treasuries/JGBs yield spread with USD/JPY as of 2 Jul 2026 (Source: TradingView). The information presented is historical information, and past performance is not indicative of future performance.
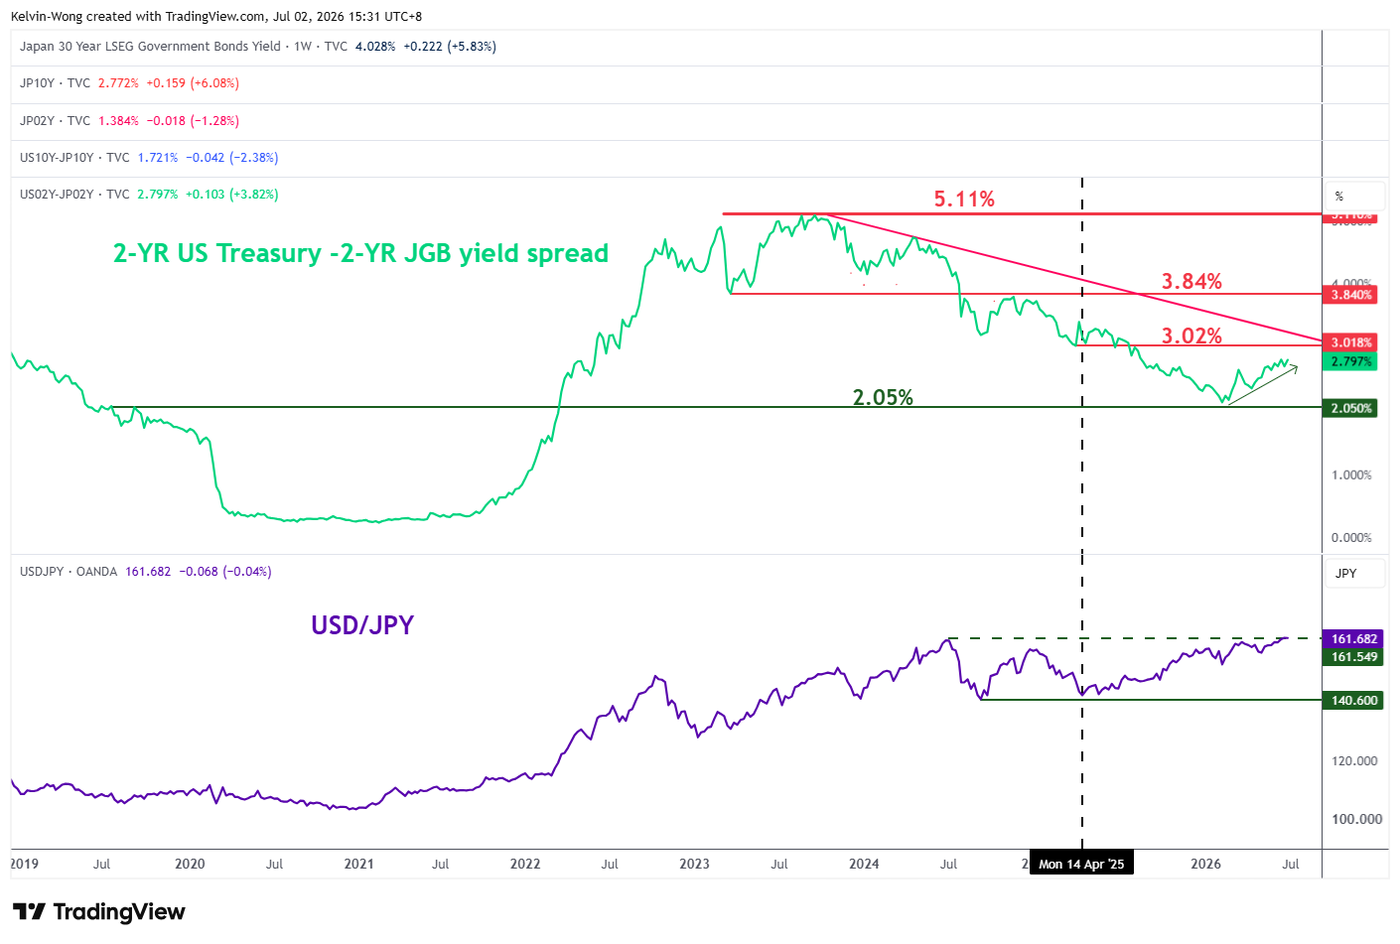
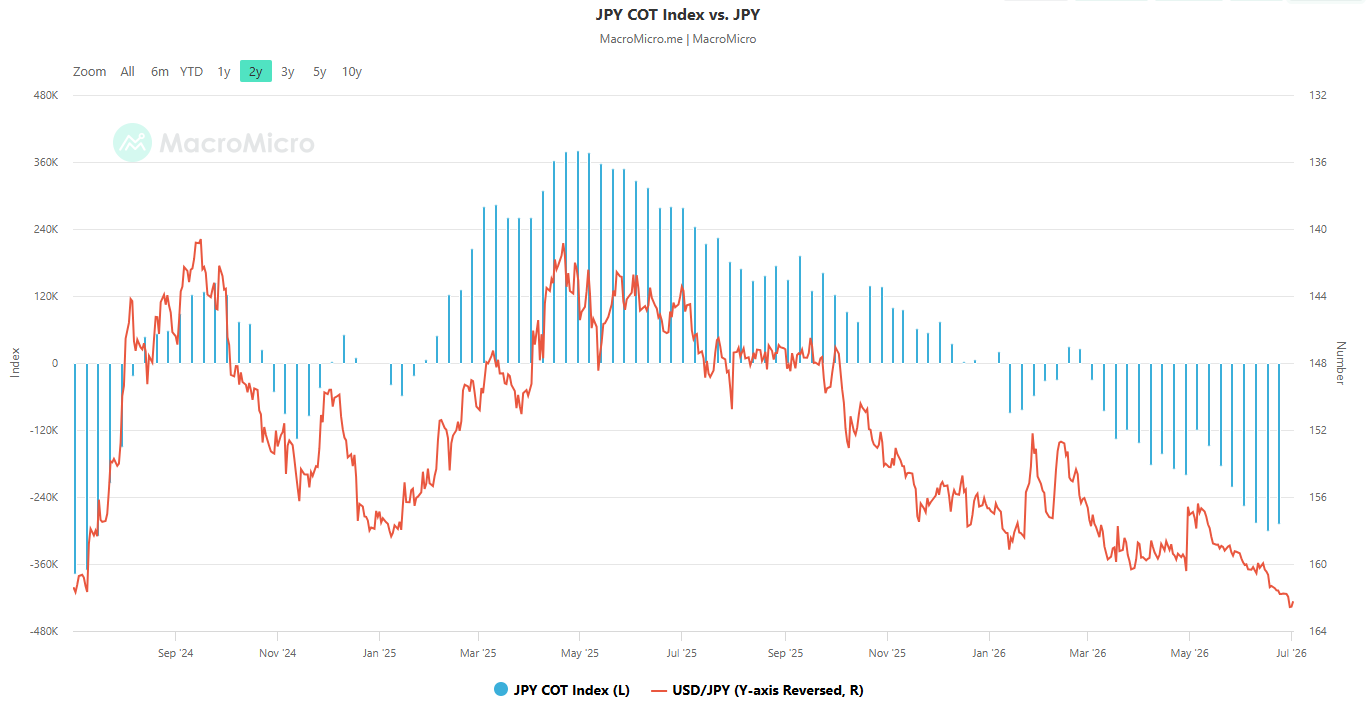
Fig. 2: Commitment of Traders’ net short positions of JPY futures as of 23 June 2026 (Source: MacroMicro). The information presented is historical information, and past performance is not indicative of future performance.
So far, fundamentals have been supportive of a weaker Japanese yen, in line with softer oil prices, where benchmark crude oil, Brent and WTI have fallen to below $75 per barrel, keeping a lid on the Japanese inflation trend, in turn, reducing the hawkish rhetoric from the Bank of Japan (BoJ).
All these factors allow the monetary policy sensitive 2-year yield spread between the US Treasury Notes and the Japanese Government Bonds (JGBs) to widen further, as the yield premium is now inching higher to 2.79% at this time of writing, making short-term US fixed income more attractive than Japanese ones, in turn, putting upside pressure on the USD/JPY (see Fig. 1).
Hence, a red-hot US non-farm payrolls data for June (above consensus of 110k, and 172K in May) later is likely to increase a more hawkish pricing of the US Federal Reserve’s future monetary policy, pushing up the 2-year US Treasury and JGB yield spread higher above 2.79%, in turn, triggering more speculators to take on short positions on the Japanese yen.
A swift weakening of the Japanese yen may create some “undesirable fundamental” impact on the Japanese economy, such as softening domestic spending and consumer confidence, offsetting the marginal benefits gained from Japanese automobile exporters.
Also, large speculator net short Japanese yen positions in the FX futures market have reached a 2-year high, making a “deliberate intervention” more effective as the exit door is narrowing due to overcrowded short positions on the yen.
According to the latest data from the Commitment of Traders report as of 23 June 2026, the net short portion of JPY futures (large speculators less large commercials) has remained steady at -288,485 contracts, more than the 02 June 2026 print of -257,335 (see Fig 2.)
Hence, the Japanese authorities may use the Reuters news report to reduce speculative positions but not alter the major uptrend phase of USD/JPY (i.e., the Japanese yen’s major downtrend).
Watch the 160.90 support on the USD/JPY
Fig. 3: USD/JPY minor trend as of 2 Jul 2026 (Source: TradingView). The information presented is historical information, and past performance is not indicative of future performance.
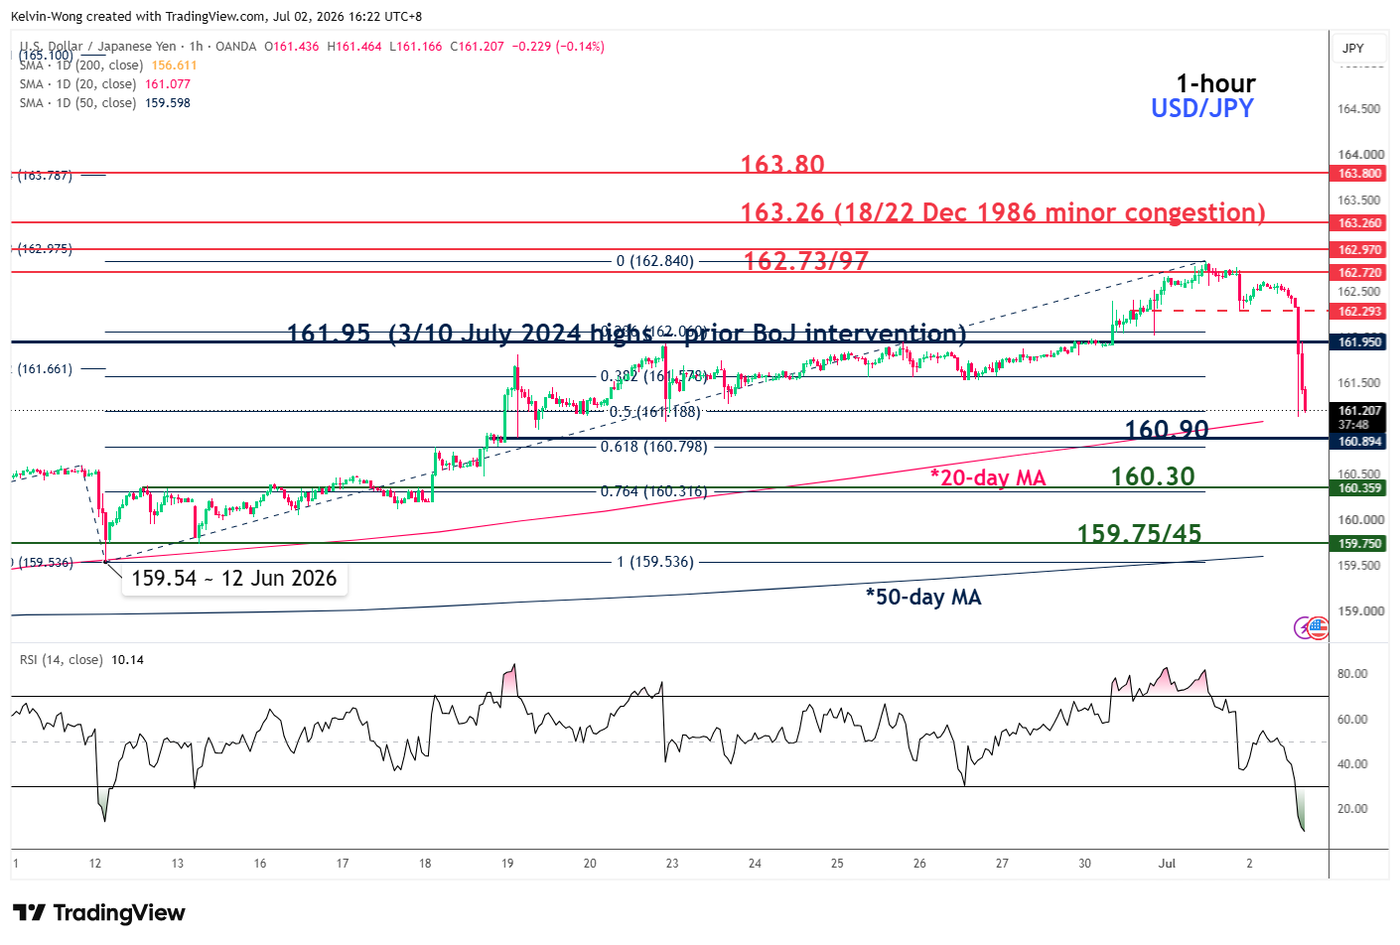
The latest bout of selling in USD/JPY (-0.7% intraday) remains above 160.90 key intermediate support (also the 20-day moving average, above it since 15 May 2026).
Only a break and an hourly close below 160.90 may trigger an intraday minor decline towards the next intermediate support at 160.30 and even a test on the 159.75/45 key medium-term support zone (also the 50-day moving average) (see Fig. 3).
On the flip side, a clearance and an hourly close above 161.95 reinstate the bullish tone on USD/JPY, targeting a retest of 162.73/97 before an assault on the next intermediate resistance at 163.26.
Will USDJPY Reach 200 Without Intervention?
- USDJPY needs interventions and rate hikes.
- Monetary policy divergence is pushing EURUSD lower.
The US dollar found no clues in Kevin Warsh’s comments, and attention shifted to the US labour market report for June. The Fed Chair noted a reduction in inflationary risks and reaffirmed the central bank’s commitment to bringing inflation back to the 2% target. He did not rule out a rate hike in July.
Investors interpreted Kevin Warsh’s comments as hawkish, pushing the probability of two rate rises in 2026 back up to 46%. The odds of a monetary policy tightening in September are estimated at two in three.
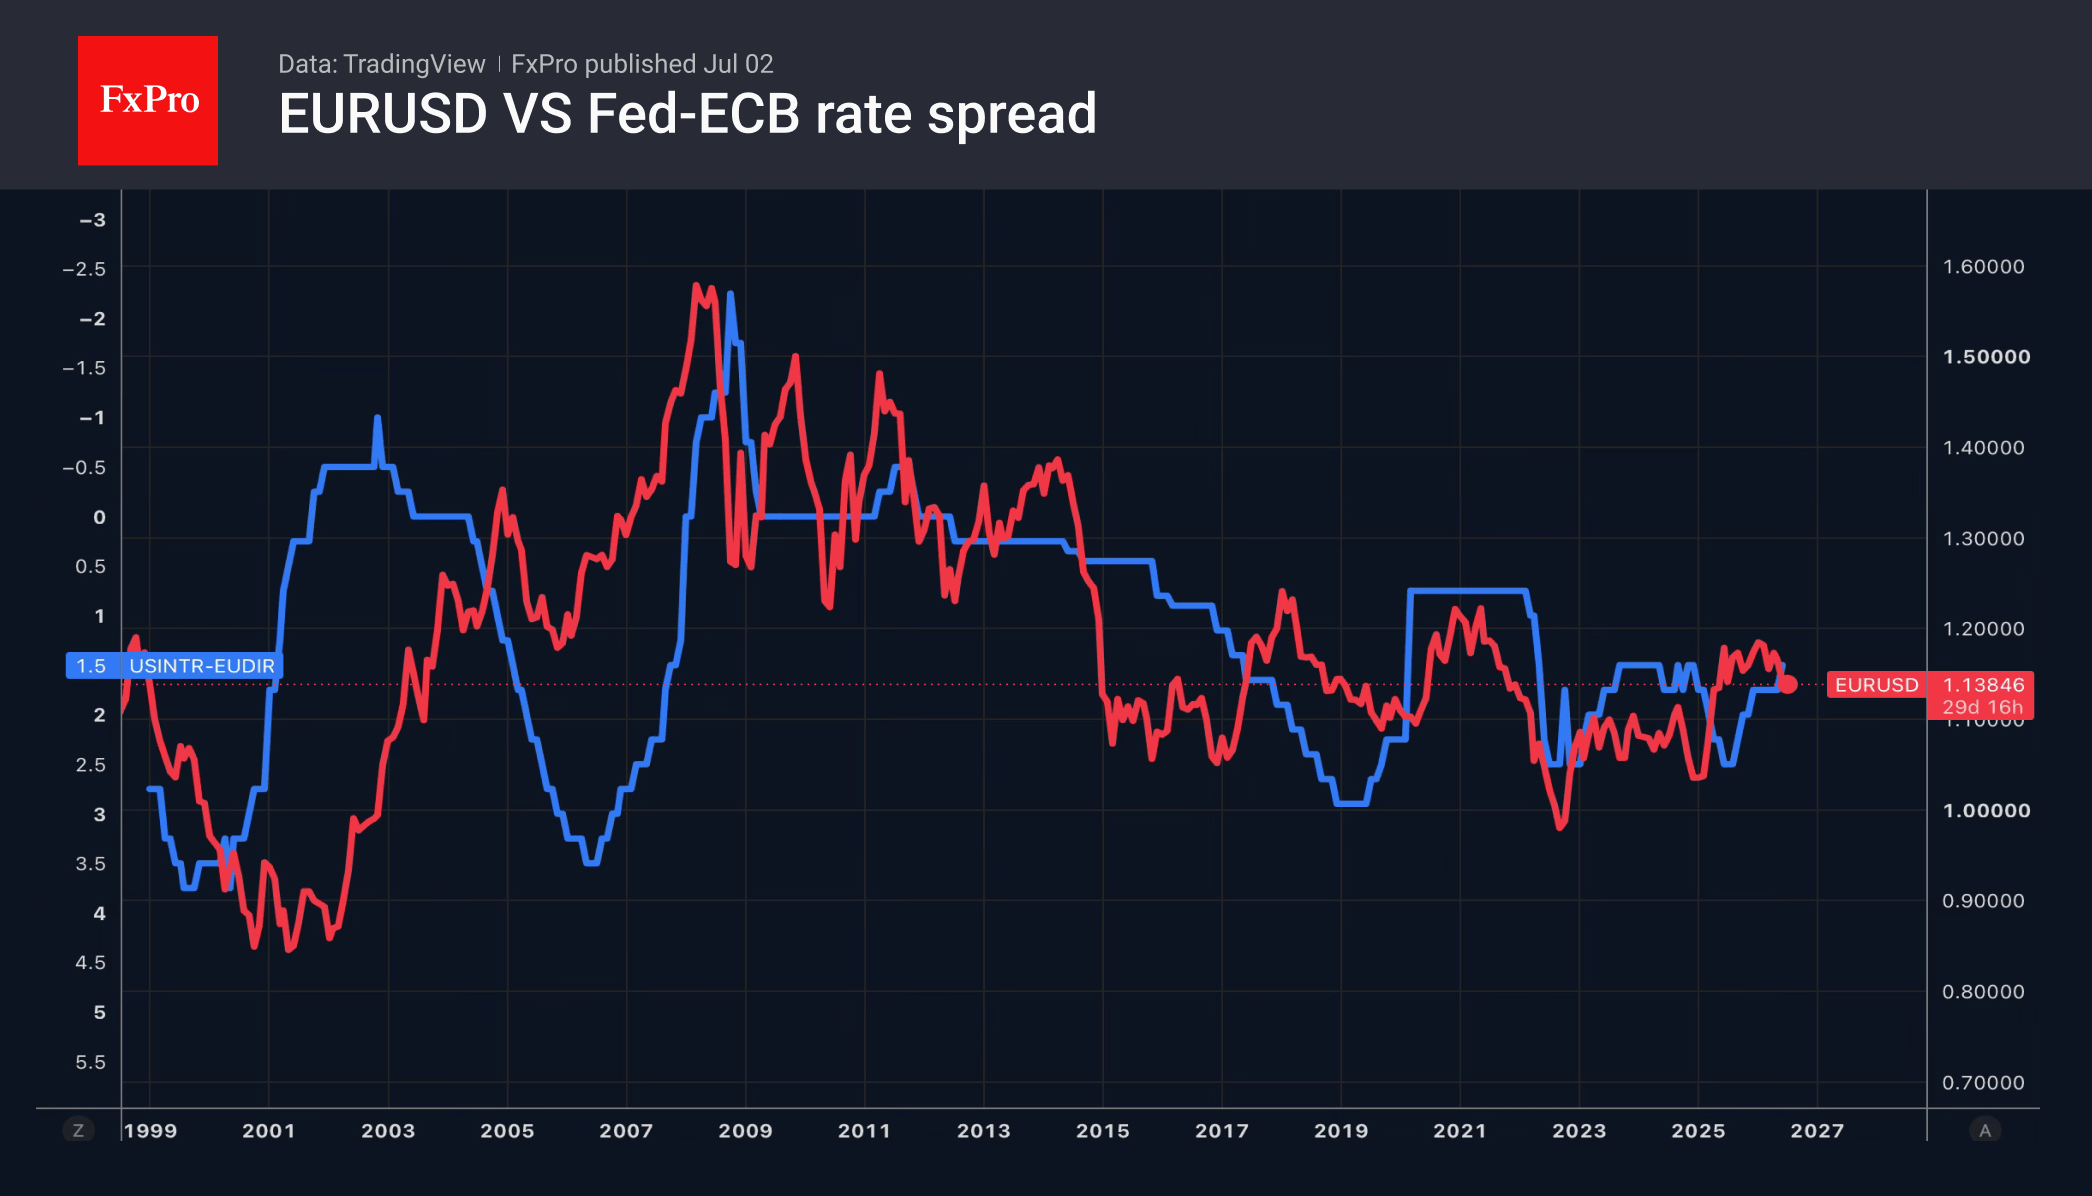
This divergence plays into the hands of the bears on EURUSD, as there is a split within the ECB. This reduces the likelihood of a deposit rate hike. The hawks believe that inflation is permeating all sectors of the eurozone economy. It will manifest as increased demand for wage rises and a delayed rise in food prices. Conversely, the doves believe that, due to the fall in oil prices, the CPI has already peaked and will decline.
This was borne out by the latest report, which noted a slowdown in inflation in June, from 3.2% to 2.8%. The futures market is pricing in the possibility of a deposit rate hike in 2026. However, investors believe that should monetary policy tightening occur, it will be the last in this cycle, which is holding back EURUSD buyers.
In Japan, rumours are intensifying that the weakening of the yen could accelerate the process of raising the overnight rate. Previously, the market expected the BoJ to tighten monetary policy every six months, but lately it has put a 60% probability on another hike in October following the June increase. The combination of a weakening national currency and strong business activity carries the risk of a significant surge in inflation. If the central bank allows inflation to spiral out of control, it will be forced to resort to aggressive monetary tightening.
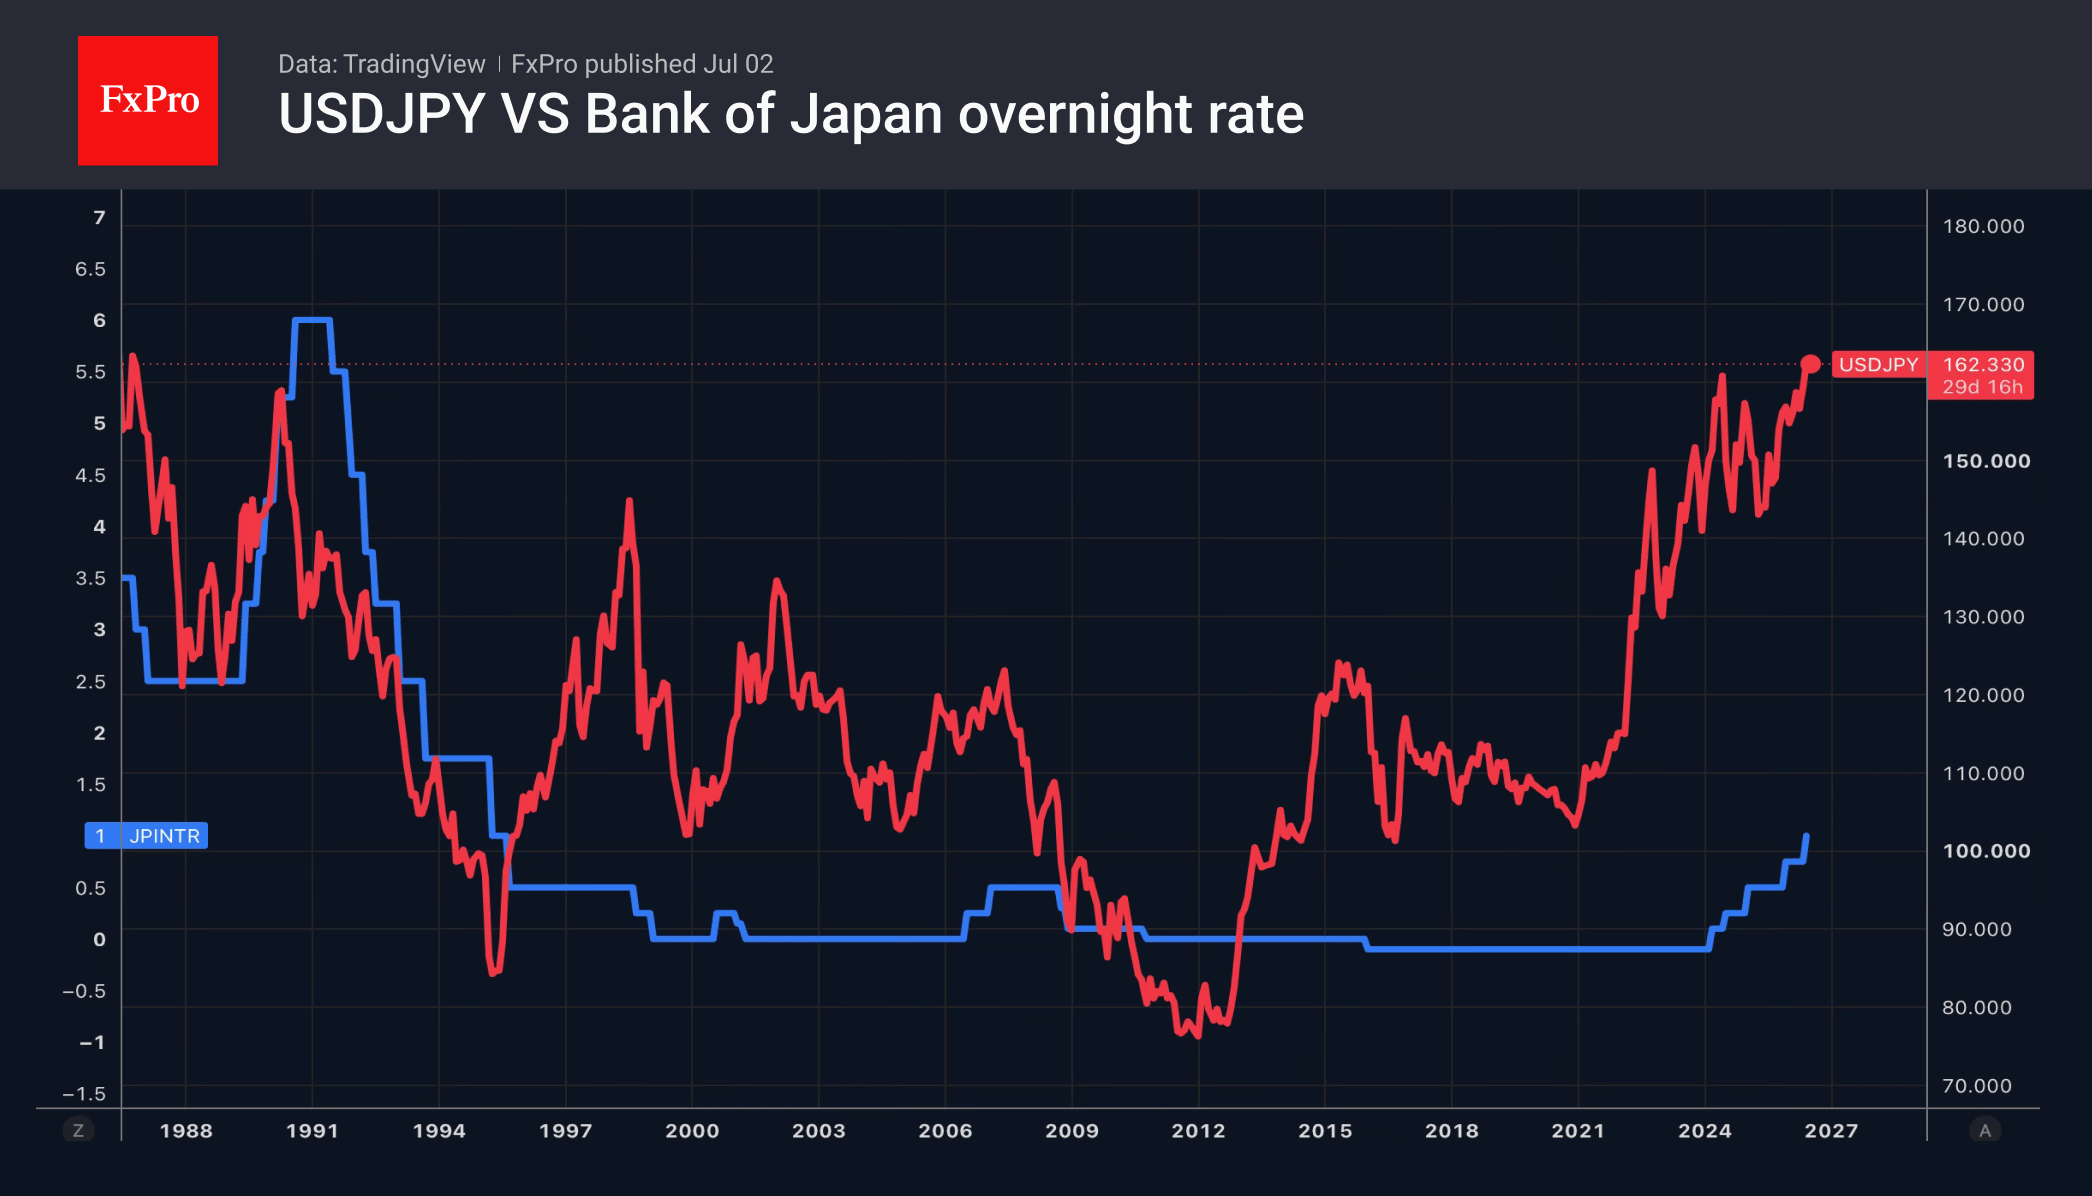
Meanwhile, Mizuho Bank expects USDJPY to reach 170, Sumitomo Mitsui Financial Group forecasts it to reach 180, while Monex Group and Blue Edge Advisors do not rule out a rally to 200.
The yen has rebounded from its 40-year lows following comments by Atsushi Mimura, Vice Finance Minister for International Affairs. He stated that the previous currency interventions in April and May were justified and that the US has no objection to further interventions in the forex market.
The FxPro Analyst Team
USD/JPY’s 150 Pips Fall: A Tactical “Intervention” Masterclass by Japan Ahead of NFP
Japan may not have spent a dollar today, but it may have achieved one of the key goals of intervention anyway. USD/JPY plunged from 162.59 to below 161.30, a move large enough to trigger immediate speculation that Tokyo had stepped into the market. There is no confirmation of actual intervention yet, but that may be beside the point. The real story is that Japanese officials appear to have found a cheaper way to defend the Yen: make traders fear intervention before it happens.
The catalyst was a Reuters report suggesting Japan is shifting toward a new "ambush intervention" strategy. Instead of warning markets repeatedly or hinting at a specific level, officials may now prefer to strike without notice when speculative yen shorts become too crowded. That changes the entire psychology of the trade. Markets had grown comfortable assuming Tokyo would jawbone before acting. Now, the Ministry of Finance appears to be using silence and uncertainty as weapons, raising the risk that yen bears wake up to a violent squeeze without warning.
The timing looks almost too precise to be accidental. With today's US Non-Farm Payrolls report looming, traders had been betting that Japan would avoid intervention before such a major event risk. The Reuters report turned that assumption against them. By forcing a 150-pip pullback before payrolls, Tokyo may have built a defensive buffer for the Yen without burning reserves. A strong NFP could still lift the Dollar, but traders may think twice before aggressively rebuilding USD/JPY longs while the threat of surprise action hangs over the market.
The broader market implications could be significant. If a strong jobs report boosts the Dollar but USD/JPY becomes a less attractive vehicle because of intervention risk, Dollar buying may be squeezed into other pairs. EUR/USD and USD/CHF reactions could be amplified, while Yen crosses could suffer sharper losses if investors cut carry exposure. Tokyo's new strategy therefore does not need to stop Dollar strength outright; it only needs to make traders choose a different battleground.
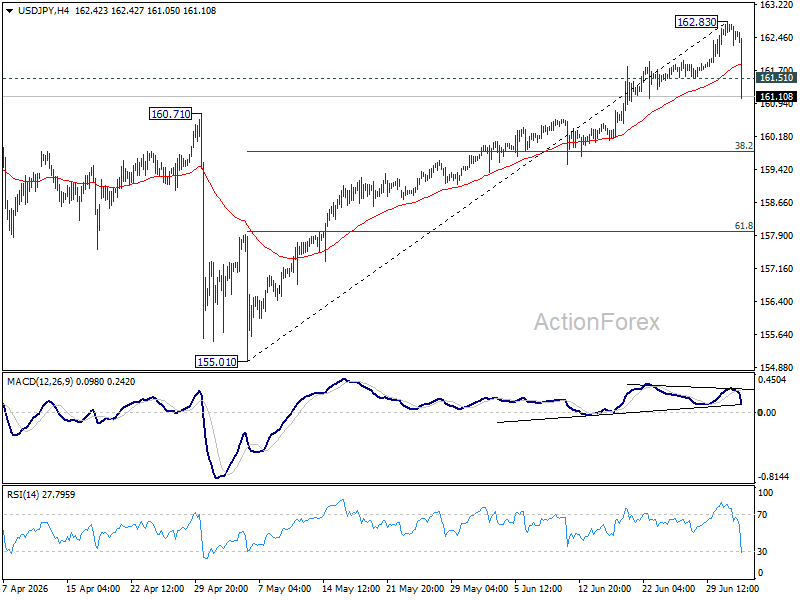
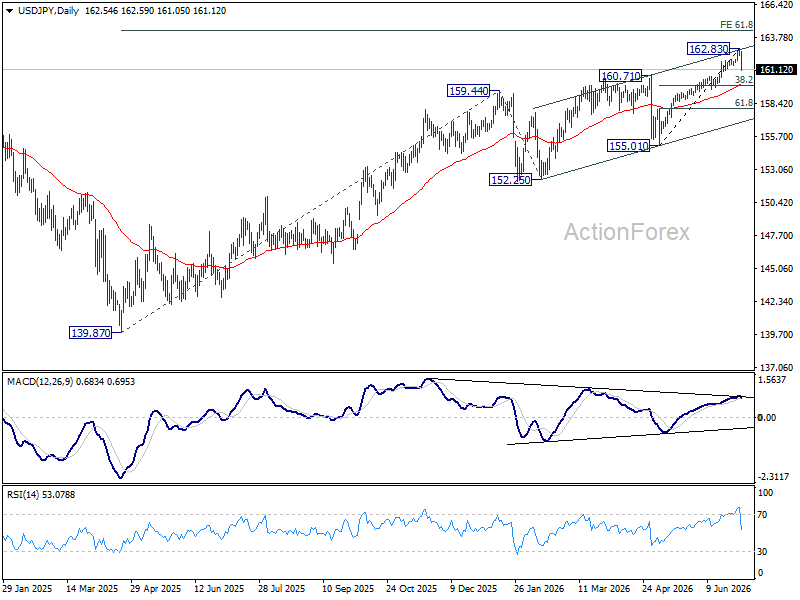
The technical picture supports at least a near-term pause in USD/JPY's rally. The break below 161.50 signals a short-term top at 162.83, with bearish divergence in the 4-hour MACD adding weight to the reversal signal. A deeper correction toward 38.2% retracement of 155.01 to 162.83 at 159.84 is now expected. That level sits close to the 55 D EMA around 159.95 and should provide strong support, potentially setting the base for sideways consolidation unless payrolls or official action trigger a more decisive break.
GBP Strength Holds Despite Dovish Bank of England Signals
GBP/USD shrugged off the impact of Bank of England Governor Andrew Bailey's speech at the ECB forum in Sintra and rose to 1.3287 on Thursday.
Earlier, Bailey confirmed that he had opposed the interest rate increase at the last meeting, citing signs of a slowdown in the British economy.
He also noted that the regulator should exercise greater caution in projecting the future rate path, as overly rigid guidance could limit the flexibility of monetary policy.
Bailey’s comments reinforced expectations of a more cautious approach to future rate decisions, which briefly weighed on the pound. However, the market absorbed the impact quickly.
Technical Analysis
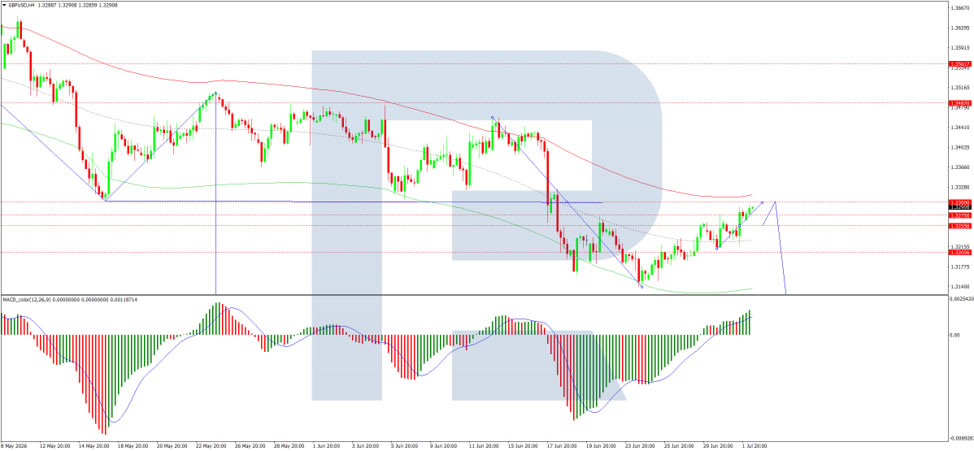
On the H4 GBP/USD chart, the pair is moving towards 1.3300 (a test from below). A broad consolidation range is forming around this level. An upside breakout from the range would open the way for a move towards 1.3350. A downside breakout would suggest a move towards 1.3200, with scope for the trend to extend to 1.2980. The MACD indicator supports this scenario, with its signal line above zero and pointing firmly upwards.
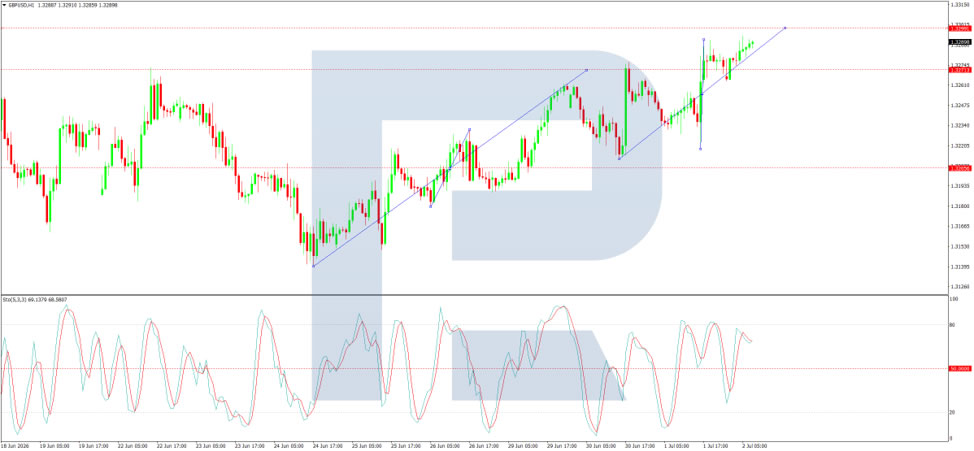
On the H1 chart, GBP/USD is trading within a compact consolidation range around 1.3255, currently extending down to 1.3220. A move higher towards 1.3300 is expected, followed by a decline towards 1.3200. The Stochastic oscillator confirms this scenario, with its signal line above 50 and pointing upwards towards 80.
Conclusion
Sterling has shown resilience, pushing higher despite Bank of England Governor Bailey's dovish remarks at the ECB forum. His confirmation that he opposed the last rate hike and his call for more cautious forward guidance initially weighed on the pound. However, the market quickly absorbed these comments, with GBP/USD recovering to trade around 1.3287. The central bank’s cautious tone may limit the pound’s longer-term upside potential, but for now, technical indicators point to further gains towards 1.3300 and potentially 1.3350. The broader direction will depend on upcoming UK economic data and any shifts in Bank of England policy.
The Dollar Awaits the Week’s Key Report: AUD/USD and NZD/USD at Crucial Technical Levels
Following mixed performance by the US dollar earlier this week, investors are now fully focused on the June Nonfarm Payrolls report, which will be released on Thursday rather than Friday. The schedule has been brought forward as US financial markets will be closed on Friday to mark the 250th anniversary of the signing of the Declaration of Independence. Today's report is expected to shape expectations for the Federal Reserve's monetary policy and set the direction for the US dollar through the remainder of the week.
Market participants will closely watch the unemployment rate, average hourly earnings and initial jobless claims, all of which will be released alongside the headline payrolls data. Following weaker-than-expected ADP employment figures, investors will be looking for confirmation that the US labour market remains resilient. Strong data could reinforce expectations that the Fed will maintain its hawkish stance, supporting the US dollar, while weaker figures may trigger profit-taking on long USD positions.
AUD/USD
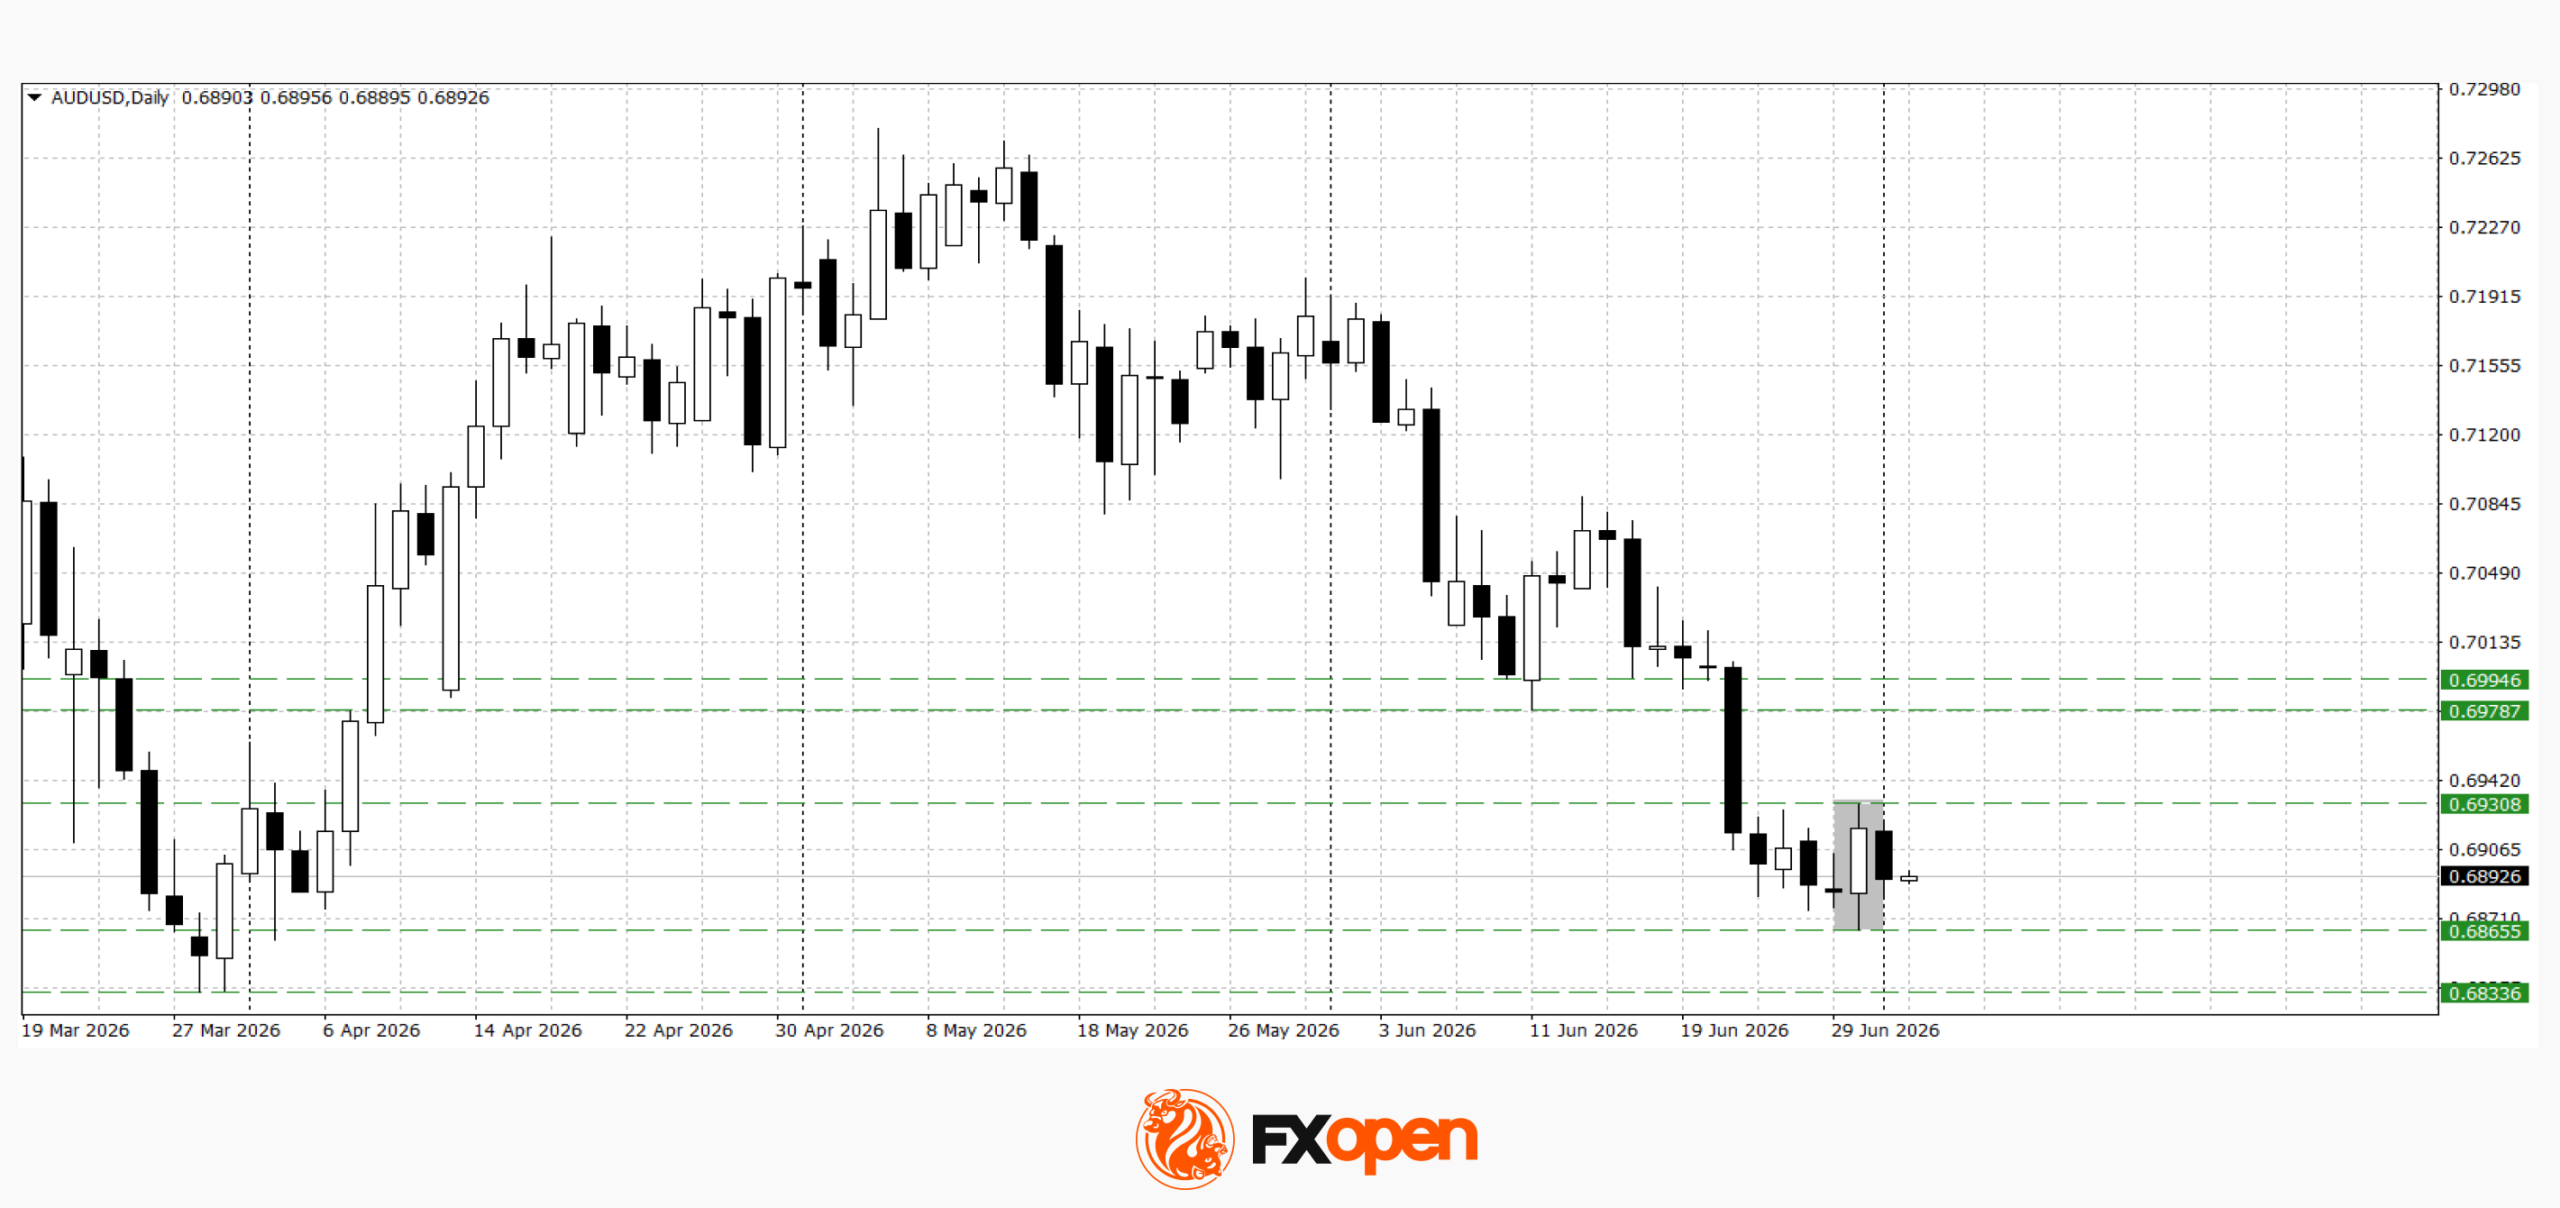
AUD/USD found support at 0.6860 at the start of the week, forming a bullish engulfing pattern after rebounding from this level. Technical analysis suggests the pair could advance towards 0.6980–0.7000 if 0.6930 turns into support. A break below 0.6860 could pave the way for a decline towards 0.6800–0.6830.
Key events for AUD/USD:
- Today at 15:30 (GMT+3): US Nonfarm Payrolls;
- Tomorrow at 02:00 (GMT+3): Australia Manufacturing and Services PMI;
- Tomorrow at 02:00 (GMT+3): Australia Services PMI.
NZD/USD
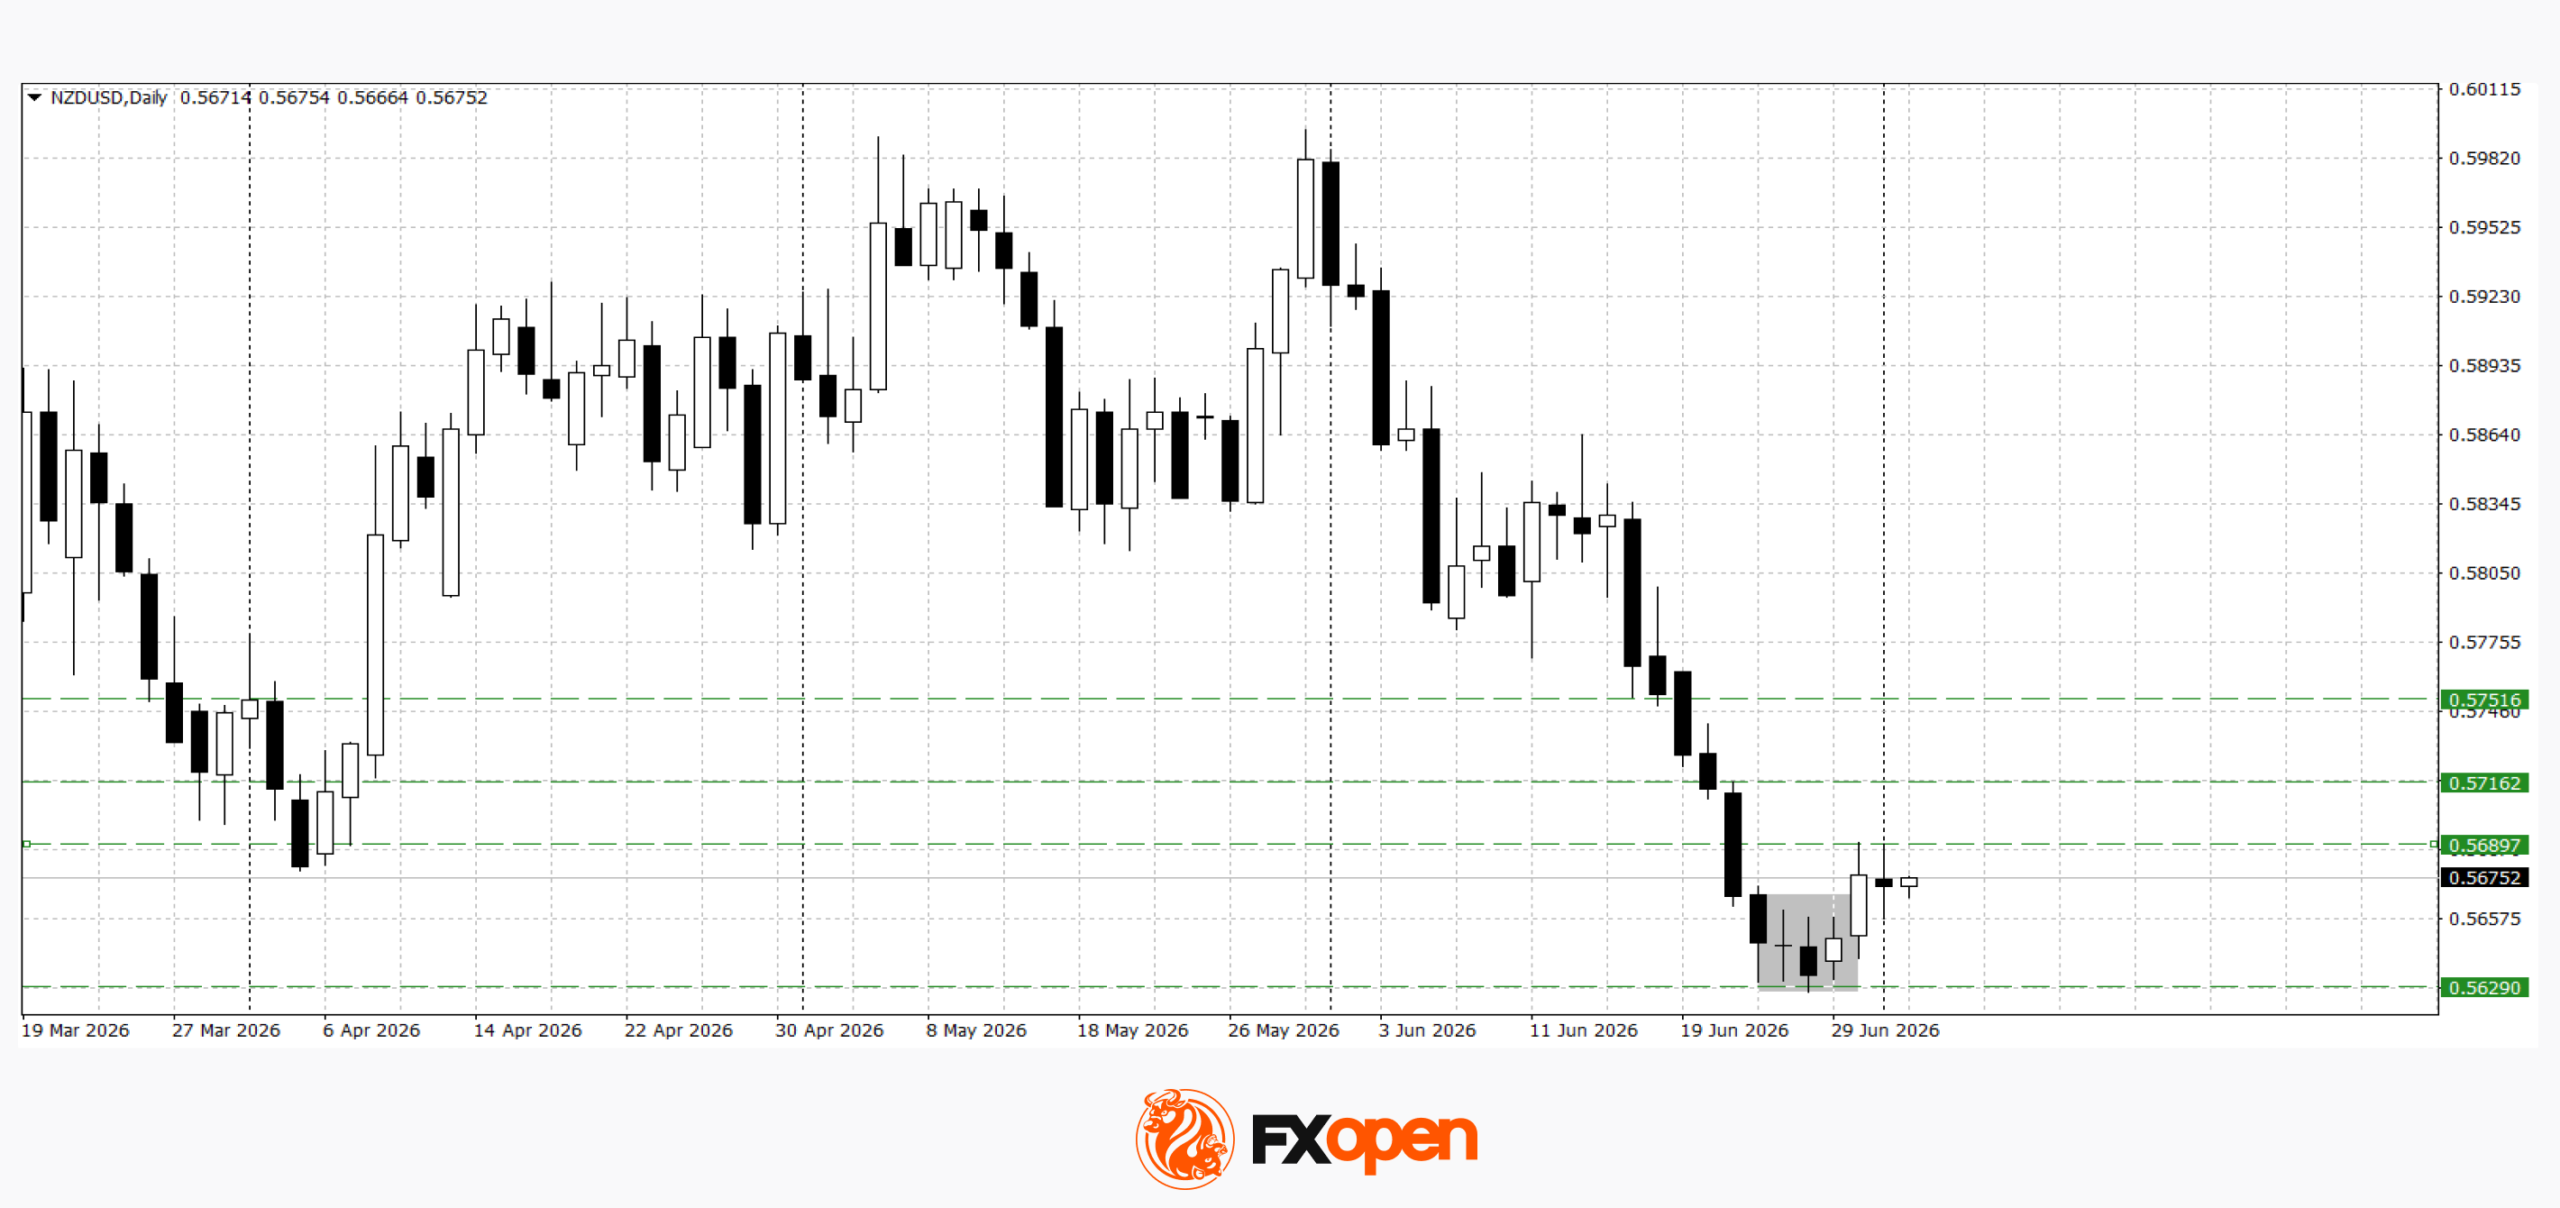
NZD/USD is showing a similar technical picture. After falling to 0.5630, buyers formed a V-shaped reversal pattern, which could support further gains. A break below the base of this formation may lead to a decline towards the 0.5570–0.5600 area.
Key events for NZD/USD:
- Today at 15:30 (GMT+3): US Average Hourly Earnings;
- Today at 15:30 (GMT+3): US Initial Jobless Claims;
- Today at 17:00 (GMT+3): US Factory Orders.
Overall, today's Nonfarm Payrolls report will be the week's key event for the currency market. Employment growth, the unemployment rate and wage data are expected to determine market expectations for future Federal Reserve policy. Until the figures are released, AUD/USD and NZD/USD are likely to remain in consolidation near key technical levels, while volatility could increase sharply once the data is published.
Trade over 50 forex markets 24 hours a day with FXOpen. Take advantage of low commissions, deep liquidity, and spreads from 0.0 pips (additional fees may apply). Open your FXOpen account now or learn more about trading forex with FXOpen.
This article represents the opinion of the Companies operating under the FXOpen brand only. It is not to be construed as an offer, solicitation, or recommendation with respect to products and services provided by the Companies operating under the FXOpen brand, nor is it to be considered financial advice.
FTSE100: Attempting a Breakout from the Triangle
On 30 June, Prime Minister Keir Starmer unveiled the Defence Investment Plan, which includes a £15 billion increase in defence spending as part of a nearly £300 billion four-year budget. The market reacted quickly: on 1 July, shares of Babcock, BAE Systems and Rolls-Royce gained between 1.1% and 5.2%, providing support for the FTSE 100 during the session. Offsetting this strength, healthcare and energy stocks came under pressure, with AstraZeneca and GSK falling 1.7% and 2.5%, while Shell and BP lost more than 2% as oil prices declined. As a result, the index closed the day 0.2% lower. Over a longer-term horizon, investors remain focused on the Bank of England's meeting on 30 July. The central bank has kept the base rate at 3.75%, while inflation risks remain elevated amid energy price dynamics and geopolitical tensions in the Middle East.
Technical Outlook
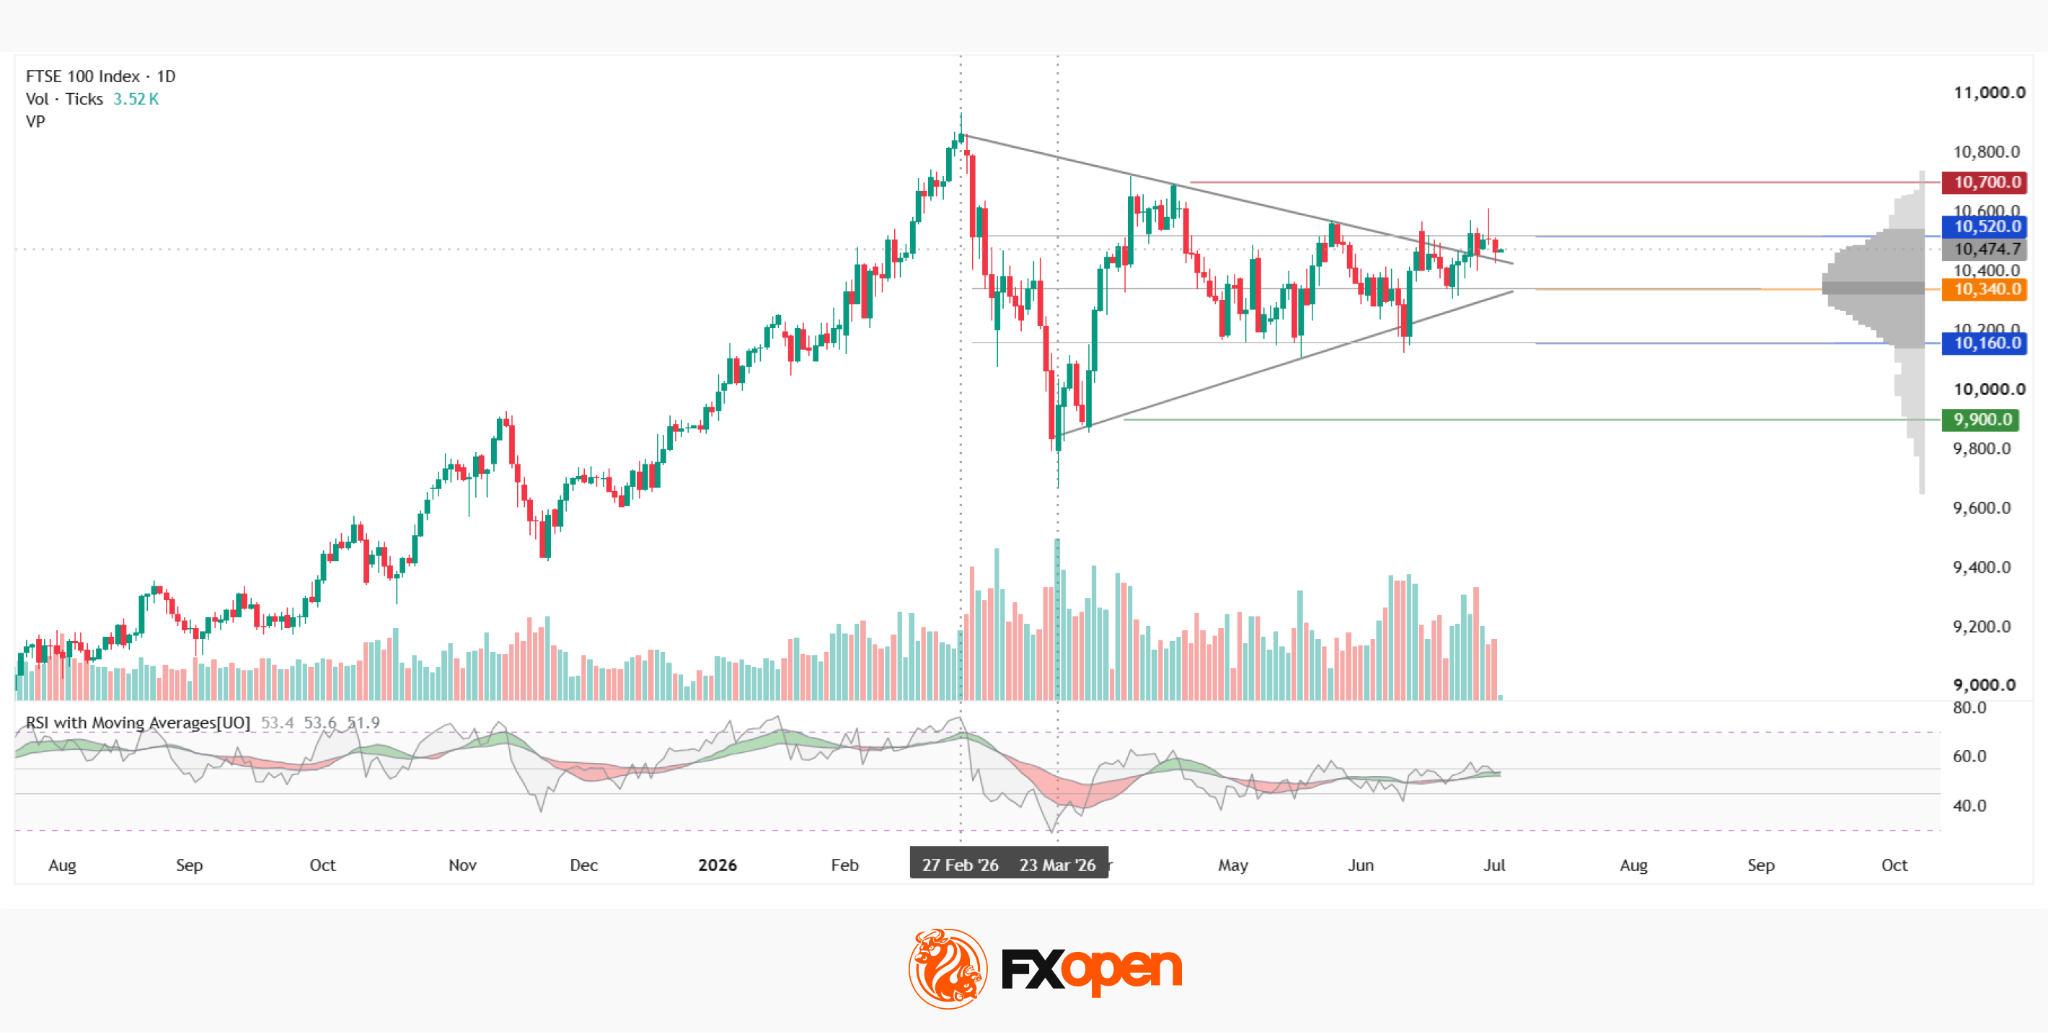
On the daily chart, the FTSE 100 (UK100 on FXOpen) has formed a symmetrical triangle, with price fluctuations narrowing between the February high and the March low. In recent sessions, the index has attempted to break above the pattern, but the move has so far been capped by the upper boundary of the current market profile at 10,520, making it too early to confirm a breakout. The key resistance level is located around 10,700, while major support lies near 9,900.
Should the index decline from current levels, the nearest support could come from the POC zone at 10,340 and the lower boundary of the market profile at 10,160. It is worth noting that trading volume remains firm, suggesting the current range may continue to develop. The RSI + MAs indicator currently reads 53, 53 and 51. All three values remain in neutral territory, confirming the current lack of directional conviction.
Summary
The narrowing price range within the symmetrical triangle points to declining volatility in the index amid a mixed fundamental backdrop. Geopolitical uncertainty surrounding US-Iran negotiations is coinciding with expectations ahead of the Bank of England's upcoming meeting. The POC zone remains a key reference point within the current market structure.
Trade global index CFDs with zero commission and tight spreads (additional fees may apply). Open your FXOpen account now or learn more about trading index CFDs with FXOpen.
This article represents the opinion of the Companies operating under the FXOpen brand only. It is not to be construed as an offer, solicitation, or recommendation with respect to products and services provided by the Companies operating under the FXOpen brand, nor is it to be considered financial advice.