Sample Category Title
USD/CAD Daily Outlook
USD/CAD is staying in consolidations below 1.4247 and intraday bias remains neutral. Another fall cannot be ruled out, but downside should be contained above 1.3965 resistance turned support. Above 1.4247 will resume the rally from 1.3480 to 61.8% retracement of 1.4791 to 1.3480 at 1.4290. Firm break there will pave the way back to 1.4791 high.
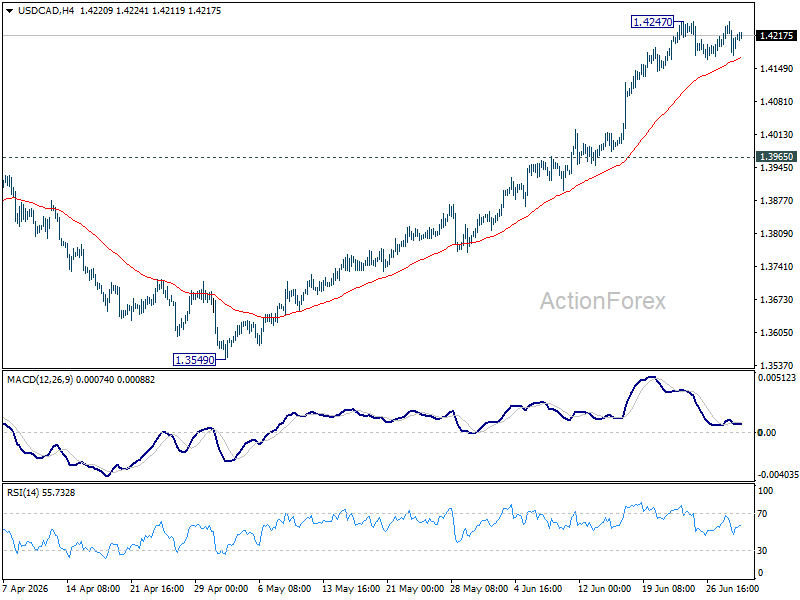
In the bigger picture, current development suggests that fall from 1.4791 has completed as a three wave correction to 1.3480. It's still early to judge if rise from there a corrective bounce, or resumption of the larger up trend from 1.2005 (2021 low). But in either case, retest of 1.4791 high should be seen next.
GBP/JPY Daily Outlook
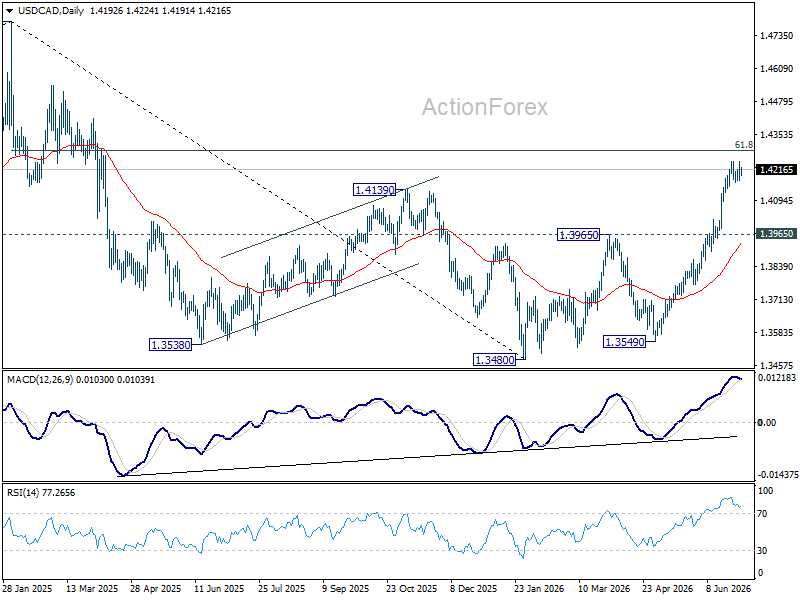
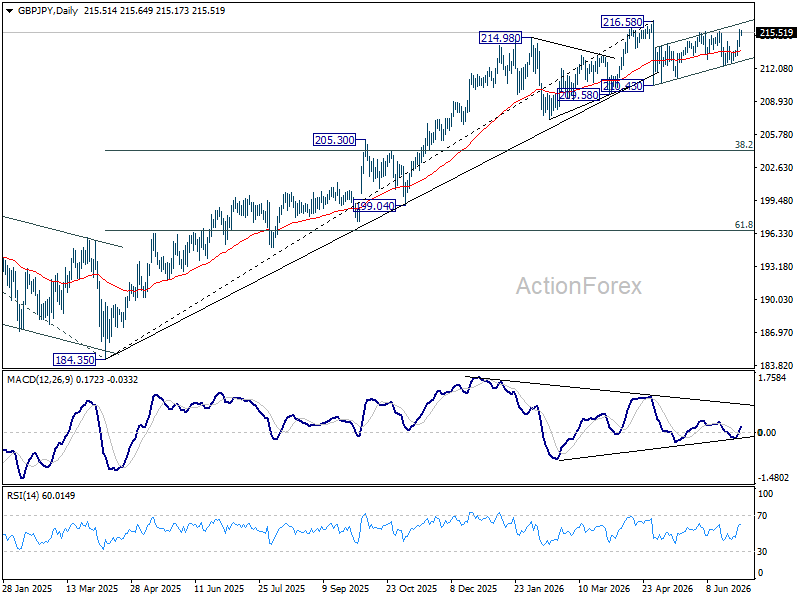
Intraday bias in GBP/JPY is back on the upside with 215.59 resistance. Rebound from 210.43 is resuming and should target 216.58 high. For now, risk will stay on the upside as long as 212.36 support holds, in case of retreat.
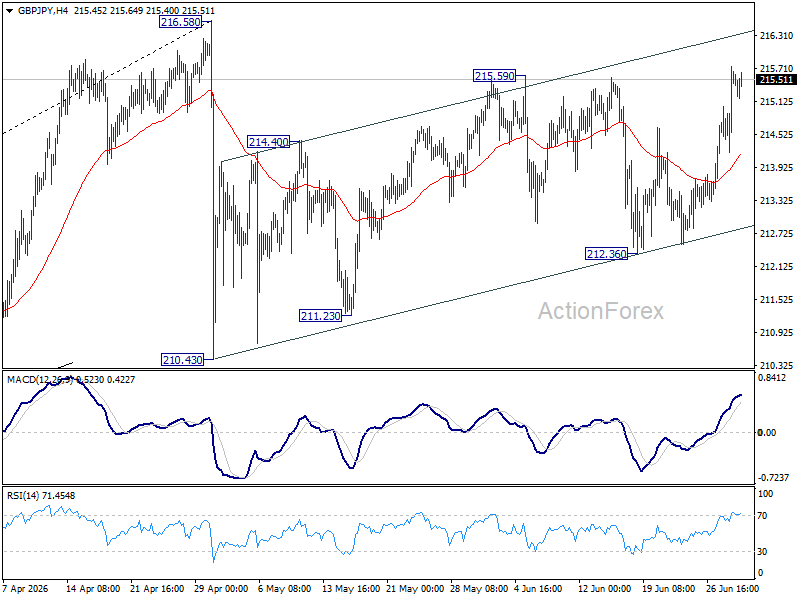
In the bigger picture, there is no clear sign of trend reversal yet. The long term up trend could still extend to 61.8% projection of 148.93 (2022 low) to 208.09 (2024 high) from 184.35 at 220.90 on resumption. However, sustained break of 55 W EMA (now at 207.52) will argue that it's already in medium term down trend for 184.35 support.
EUR/JPY Daily Outlook
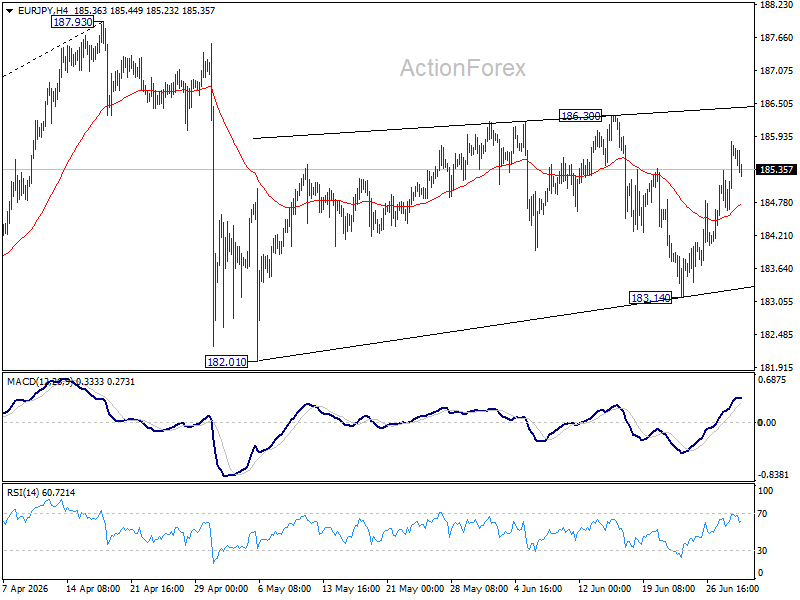
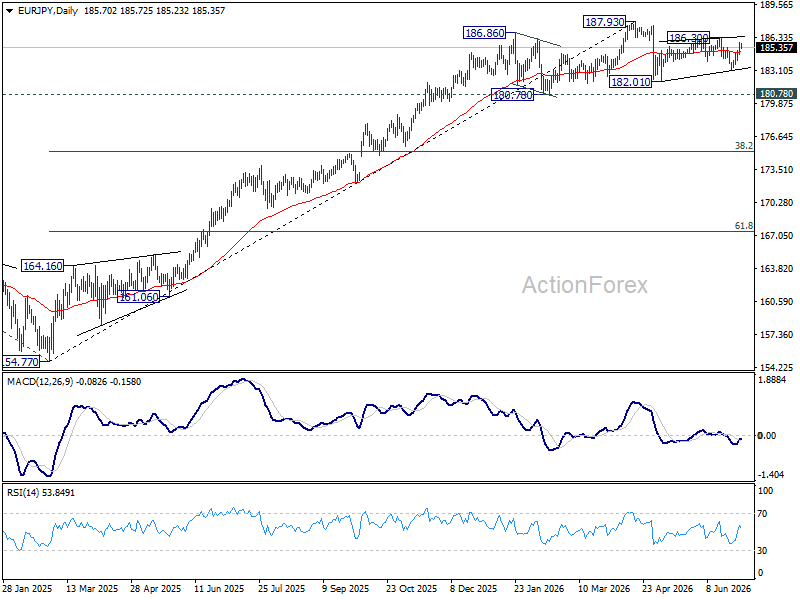
Intraday bias in EUR/JPY remains neutral for the moment. Risk will remain mildly on the downside as long as 186.30 resistance holds. Below 183.14 will bring retest of 182.01 support first. However, firm break of 186.30 will resume the rebound from 182.01 to retest 187.93 high.
In the bigger picture, there is no sign of reversal yet. Uptrend from 114.42 (2020 low) is still expected to resume at a later stage to 78.6% projection of 124.37 (2022 low) to 175.41 (2025 high) from 154.77 at 194.88. However, sustained break of 55 W EMA (now at 179.37) will argue that it's already in a medium term down trend to 175.41 resistance turned support and below.
EUR/GBP Daily Outlook
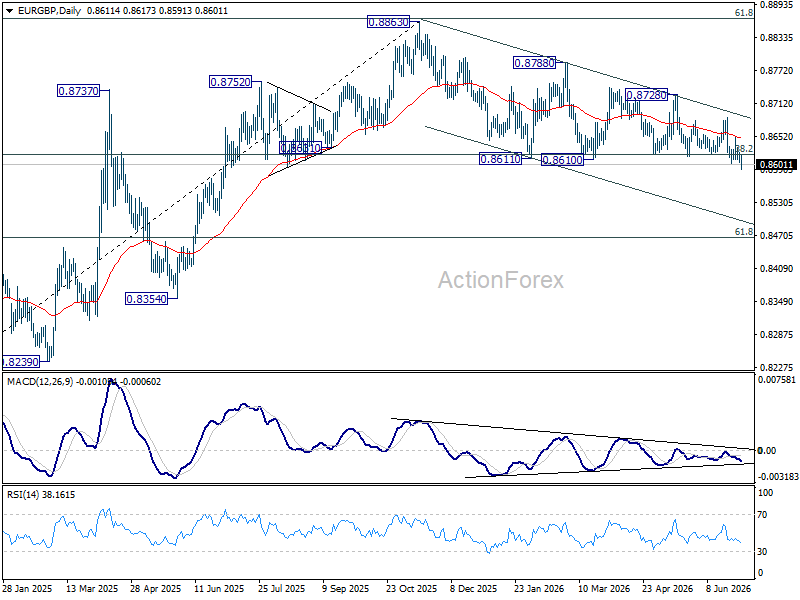
Intraday bias in EUR/GBP is back on the downside with break of 0.8601 support. Sustained trading below 0.8618 fibonacci level should confirm bearish reversal. Next target is 0.8466. For now, risk will stay on the downside as long as 0.8686 resistance holds.
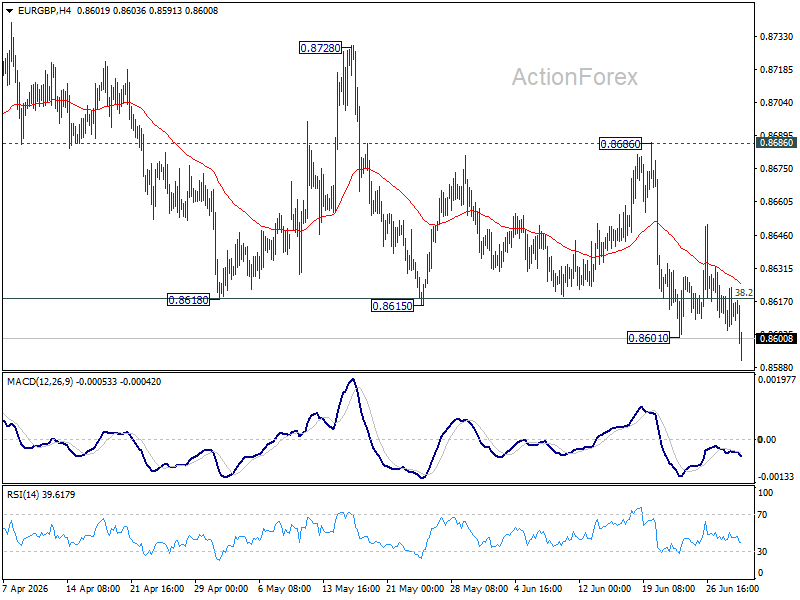
In the bigger picture, focus is staying on 38.2% retracement of 0.8221 to 0.8863 at 0.8618. Strong rebound from there will retain medium term bullishness. Rise from 0.8221 should resume through 0.8863 at a later stage. Nevertheless, sustained break of 0.8618 will confirm that whole rise from 0.8221 has completed at 0.8863. Deeper decline should then be seen to 61.8% retracement at 0.8466 at least.
EUR/AUD Daily Outlook
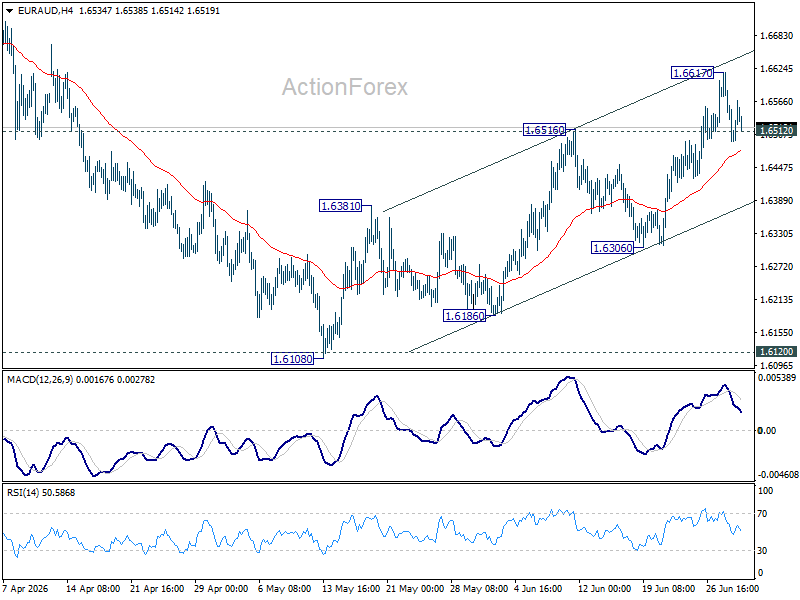
Intraday bias in EUR/AUD is turned neutral first with current retreat, and some consolidations could be seen first. Further rally remains in favor as long as 1.6306 support holds. Break of 1.6617 will resume the rally from 1.6108 towards 1.6842 resistance.
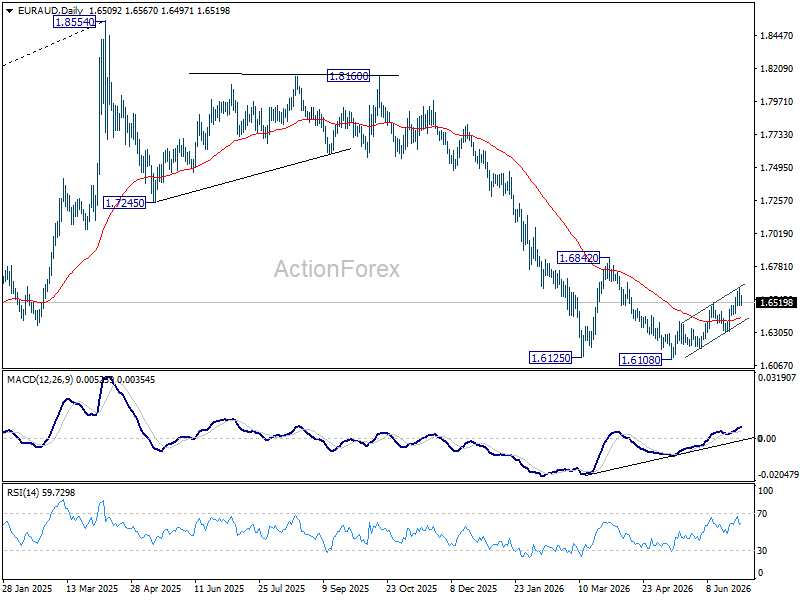
In the bigger picture, outlook will stay bearish as long as 1.6842 resistance holds. Fall from 1.8554 (2025 high) is expected to continue to 61.8% retracement of 1.4281 to 1.8554 at 1.5913. Decisive break there will pave the way back to 1.4281 (2022 low). However, firm break of 1.6842 should confirm medium term bottoming, and bring stronger rally.
EUR/CHF Daily Outlook
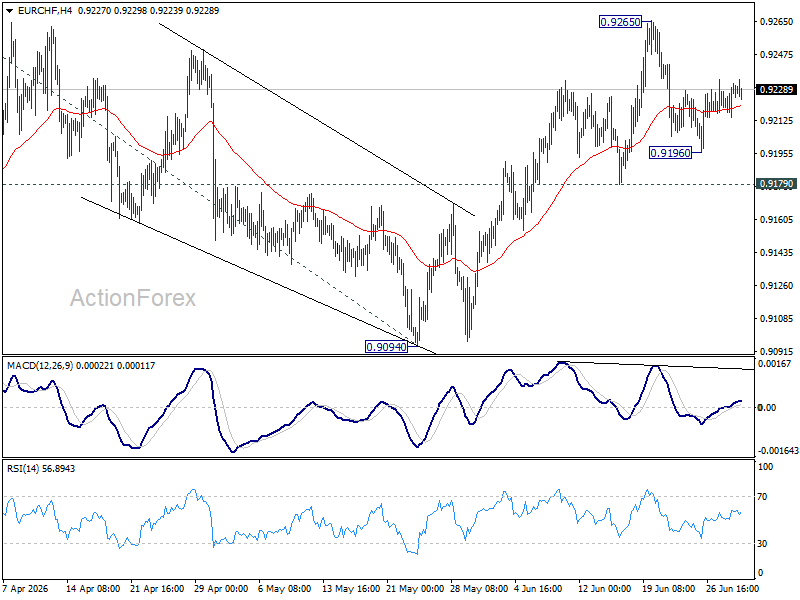
Intraday bias in EUR/CHF stays neutral as consolidation continues below 0.9265. Further rally is expected as long as 0.9179 support holds. On the upside,firm break of 0.9264/5 will resume the rally from 0.8979 to 100% projection of 0.8979 to 0.9264 from 0.9094 at 0.9379.
In the bigger picture, the break of medium term falling trend line resistance indicates that 0.8979 is already a medium term bottom. Considering bullish convergence condition in W MACD, rise from there should at least be reversing the fall from 0.9928, with prospect of developing into a medium term up trend. Firm break of 0.9394 resistance will add more credence to this case. For now risk will remain on the upside as long as 0.9094 support holds, in case of retreat.
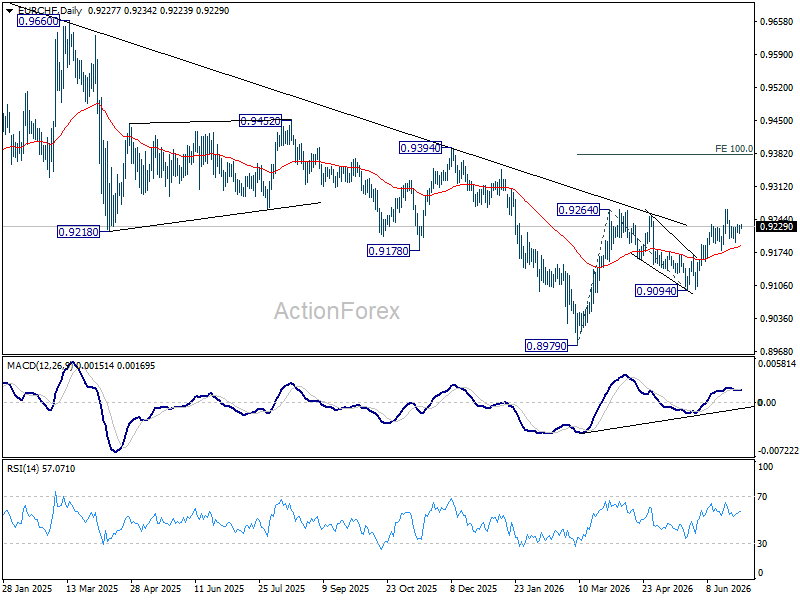
Chart Alert: S&P 500 Risks Bull Trap as Stronger US Dollar Threatens Q2 Rally
Key takeaways
- The S&P 500 ended Q2 2026 on a strong note, but technical momentum is showing signs of fatigue. A two-day rally lifted the index to its best quarterly performance since Q2 2020, although prices are now approaching a key technical resistance zone.
- Quarter-end institutional positioning and easing geopolitical tensions fuelled the rebound. Window dressing by fund managers and a further reduction in the US-Iran geopolitical risk premium drove renewed buying in AI, semiconductor, and mega-cap technology stocks.
- A stronger US dollar is emerging as the key macro headwind. The US Dollar Index has broken out to a 13-month high following the June FOMC meeting, with historical precedents showing that sustained dollar strength has coincided with meaningful corrections in US equities.
- Attention now turns to Fed Chair Kevin Warsh and US labour market data. Any hawkish policy signals from Warsh or another resilient non-farm payrolls report could reinforce expectations of higher interest rates, strengthening the dollar further and increasing the risk of a near-term pullback in the S&P 500.
The S&P 500 snapped out of a five-day losing streak to finish Q2 2026 with a robust two-day surge, climbing 1.98% over June 29 and June 30 to close at 7,499. This capped off a stellar quarterly gain of 14.9%, the index’s best single-quarter performance since Q2 2020.
Institutional window dressing effect and geopolitical relief
The late-June reversal was heavily supported by structural “window dressing” as portfolio managers reallocated capital, shedding monthly losers to add exposure to winning mega-cap tech and AI benchmarks before sending out quarterly reports.
The final 48 hours of June saw classic mechanical inflows. Institutional mandates required trimming lagging individual names from earlier in the month and aggressively reloading into core AI, semiconductor, and secular tech structural compounders (the PHLX Semiconductor index, SOX, rose 3.9% on Tuesday, 30 June, surpassing the S&P 500 +0.8% and Nasdaq 100 +1.7% by a wide margin).
This systematic flow effectively insulated a technology cohort that had been briefly bruised by mid-June data centre margin fears and personnel rotations.
In addition, weekend hostilities between the US and Iran eased, reinforcing the June 17 interim ceasefire memorandum of understanding, as both nations’ subsequent adherence to the memorandum and the scheduled diplomatic talks in Doha dramatically lowered the near-term crude oil shock premium.
Continuation of the US dollar strength may be the bearish reversal trigger
Fig. 1: Weekly MACD of US Dollar Index with US Nasdaq 100 & SPX 500 CFDs as of 1 Jul 2026 (Source: TradingView). The information presented is historical information, and past performance is not indicative of future performance.
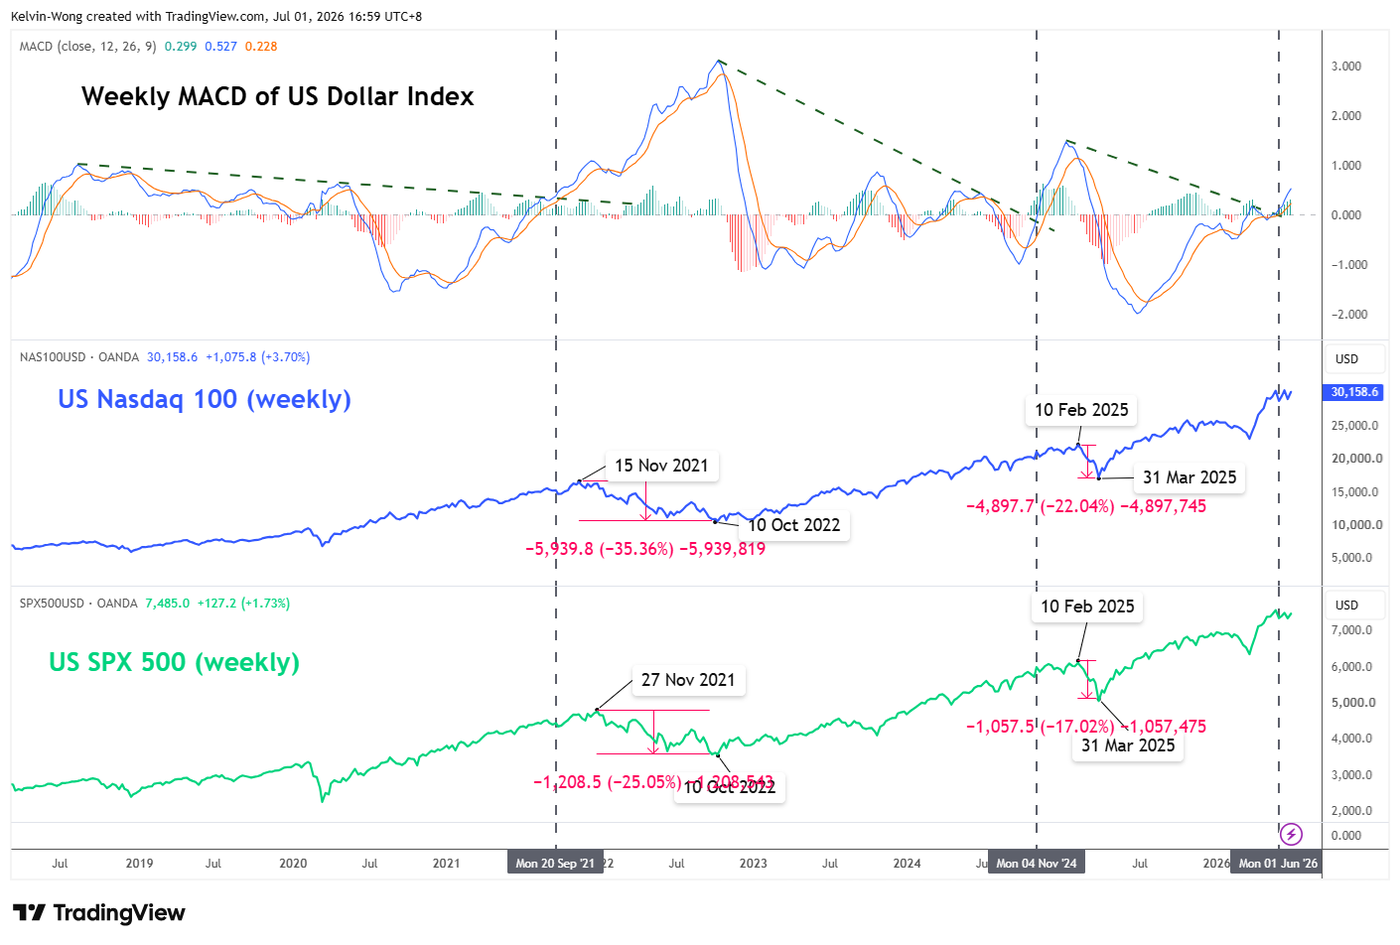
Since the conclusion of the 17 June 2026 FOMC meeting, led by new Fed Chair Kevin Warsh, the global macro landscape has undergone a significant shift. In sharp contrast to the tentative consolidation seen in the US dollar between April and May 2026, the US Dollar Index has staged a decisive bullish breakout above its long-standing range resistance at 100.54, which had capped gains since May 2025. The greenback has since advanced to a 13-month high of 101.37 at the close of Friday’s US session on 26 June 2026.
In terms of intermarket analysis, the weekly MACD trend indicator of the US Dollar Index staged a significant bullish breakout the week of 1 June 2026, moving above the zero line and continued to trend upwards at this time of writing. Two similar bullish breakouts were seen in the weeks of 4 November 2024 and 20 September 2021, which led to significant prior corrective declines of 22%- 17% and 35%- 25%, respectively, on the US Nasdaq 100 CFD and US SPX 500 (see Fig. 1).
All eyes and ears will now shift to Fed Chair Kevin Warsh’s public speech today at the Sintra policy panel of the ECB forum on central banking at 1 pm GMT, and also US non-farm payrolls and unemployment rate data for June out on Thursday, 2 July at 12.30 pm GMT
Any further hint of a hawkish Fed on rate hikes from Warsh is likely to trigger another bout of US dollar strength, which, in turn, may soften the prior bullish tone in the US stock market.
Let’s now focus on the short-term trajectory (1 to 3 days) of the US SPX 500 CFD (a proxy of the S&P 500 E-mini futures) from a technical analysis perspective.
Potential bull trap below 7,545 key short-term resistance
Fig. 2: US SPX 500 CFD minor trend as of 1 Jul 2026 (Source: TradingView). The information presented is historical information, and past performance is not indicative of future performance.
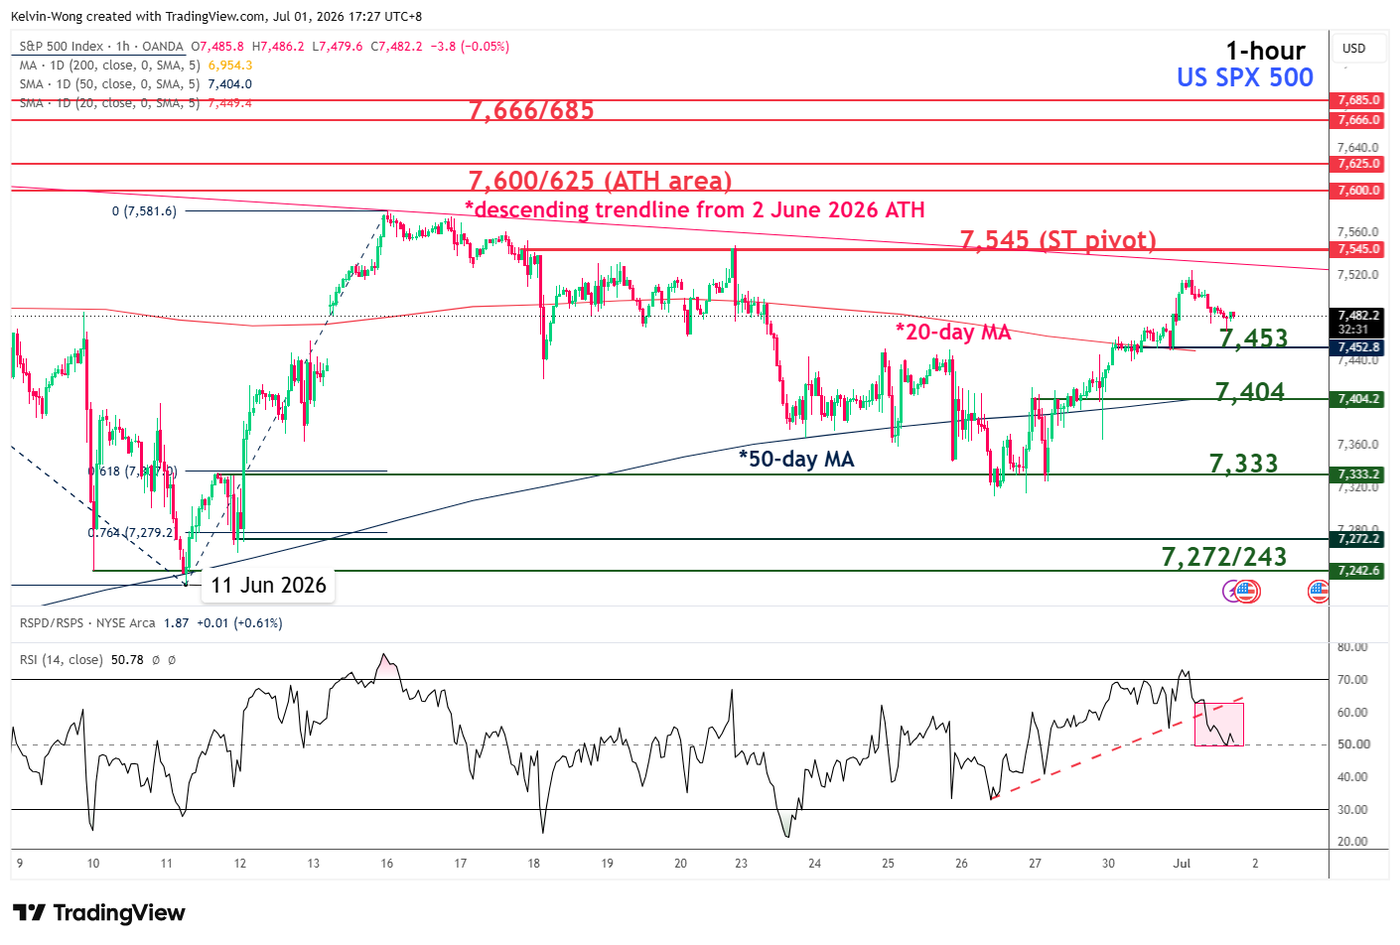
Trend bias: Minor bearish reversal below 7,545 key short-term pivotal resistance within medium-term range configuration
Supports: 7,453 (downside trigger, also the 20-day MA), 7,404 (also the 50-day MA), 7,333 (26/29 Jun 2026 minor lows) (see Fig. 1).
Next resistances: 7,600/625 (all-time high area), 7,666/685 (Fibonacci extension cluster)
Key elements to support the short-term bearish bias on the US SPX 500 CFD
- The last three sessions of bullish price actions have stalled at the descending trendline resistance in place since the 2 June 2026 all-time high.
- The hourly RSI momentum indicator has staged a bearish breakdown from its ascending support after it hit an overbought reading on Tuesday, 30 June 2026.
EUR/GBP: BoE Caution Versus ECB Determination
Against the backdrop of a weak UK economy and inflation above target, the Bank of England paused on 18 June, leaving the base rate unchanged at 3.75% for a fourth consecutive meeting, despite internal disagreements among committee members over the need for a rate hike. The contrast with the European Central Bank’s actions was notable: on 11 June, the ECB raised interest rates in response to a surge in eurozone inflation driven by higher energy prices amid the Middle East conflict. As a result, the monetary policy paths of London and Frankfurt temporarily diverged, with market attention now shifting to two upcoming meetings: the ECB on 23 July and the Bank of England on 30 July.
Technical Outlook
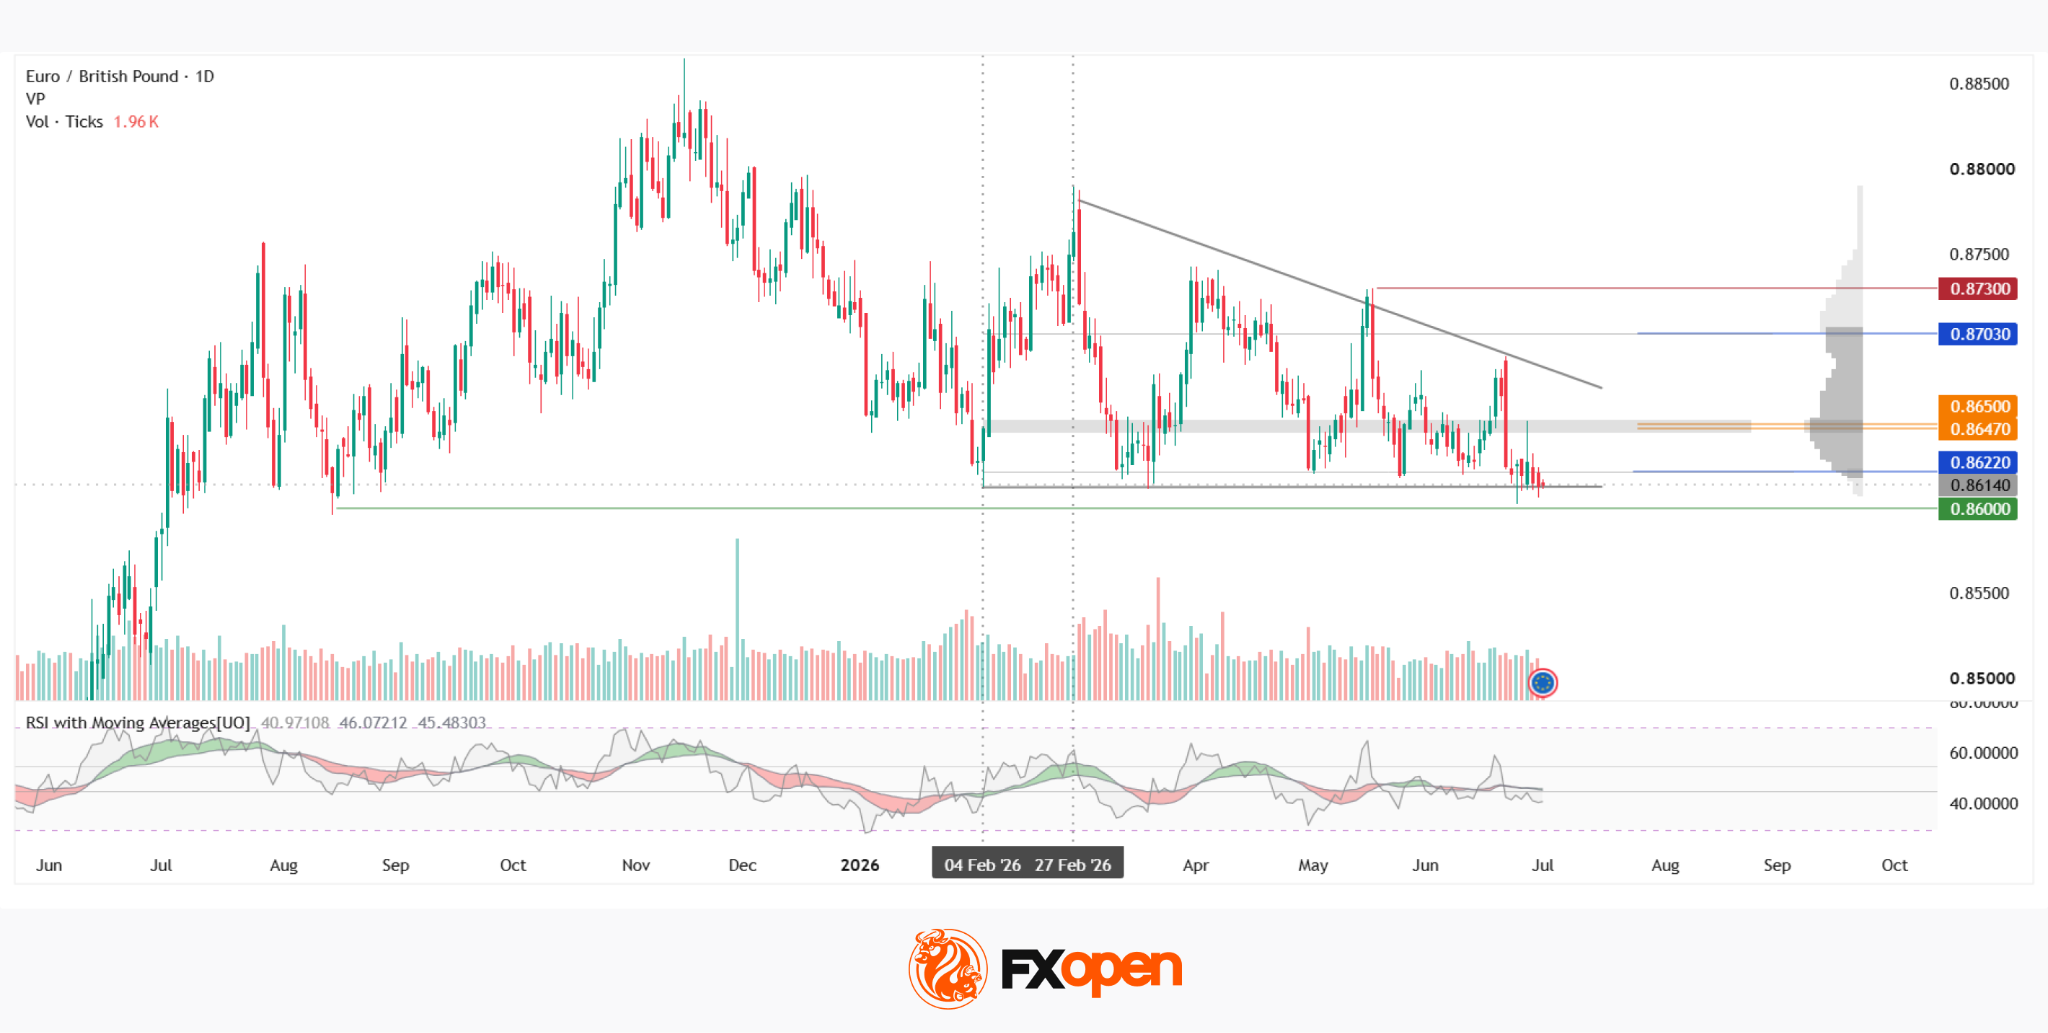
On the daily chart, EUR/GBP has been forming a bearish structure since November last year. After peaking around 0.8860, the pair moved into a broad trading range, and in February a descending triangle began to take shape. The price is currently testing the triangle's lower boundary.
Immediately below the triangle's lower boundary lies support at 0.8600, while slightly above it is the lower boundary of the current volume profile at 0.8622. This cluster of three technical levels could help keep the pair within the triangle, whereas a downside break may trigger increased market activity.
Above this area is the Point of Control (POC) zone at 0.8647–0.8650, where the bulk of trading volume for the first half of the year is concentrated. If the price breaks above this zone, it could move on to test the triangle's upper boundary. Should buying pressure overcome the descending resistance line, the upper boundary of the volume profile at 0.8703 and the resistance level at 0.8730 may act as the next barriers.
The RSI and MAs indicators currently stand at 41, 46 and 45, respectively. The RSI remains below the neutral 50 level, while the MAs, although approaching the lower boundary of the neutral zone, remain positively aligned.
Summary
The combination of the Bank of England keeping interest rates unchanged and the ECB's recent rate hike creates a backdrop in which the technical reaction around 0.8600 or the POC zone could become a key factor in determining the next directional move for EUR/GBP.
Trade over 50 forex markets 24 hours a day with FXOpen. Take advantage of low commissions, deep liquidity, and spreads from 0.0 pips (additional fees may apply). Open your FXOpen account now or learn more about trading forex with FXOpen.
This article represents the opinion of the Companies operating under the FXOpen brand only. It is not to be construed as an offer, solicitation, or recommendation with respect to products and services provided by the Companies operating under the FXOpen brand, nor is it to be considered financial advice.
EUR/CHF: Which Central Bank Is Backing Its Currency Harder?
The EUR/CHF pair is trading within a clear divergence between the two central banks. The ECB raised rates by 25 basis points on 11 June, lifting the deposit rate to 2.40% — its first hike since 2023 — after eurozone inflation climbed to 3.2% in May on the back of the Middle East-driven energy shock. More recent signals suggest easing pressure, though, as falling oil prices following the peace agreement have reduced expectations of a further hike in July.
On the Swiss side, the SNB left rates unchanged at 0.00% on 18 June, while signalling greater readiness to intervene in the currency market to contain excessive franc strength. Despite the ECB's rate advantage, the franc remains structurally firm below parity, underpinned by its so-called safe-haven status and the still-fragile geopolitical backdrop. A renewed bout of risk-off sentiment could see the franc regain ground even against a higher-yielding euro.
Technical Analysis of EUR/CHF
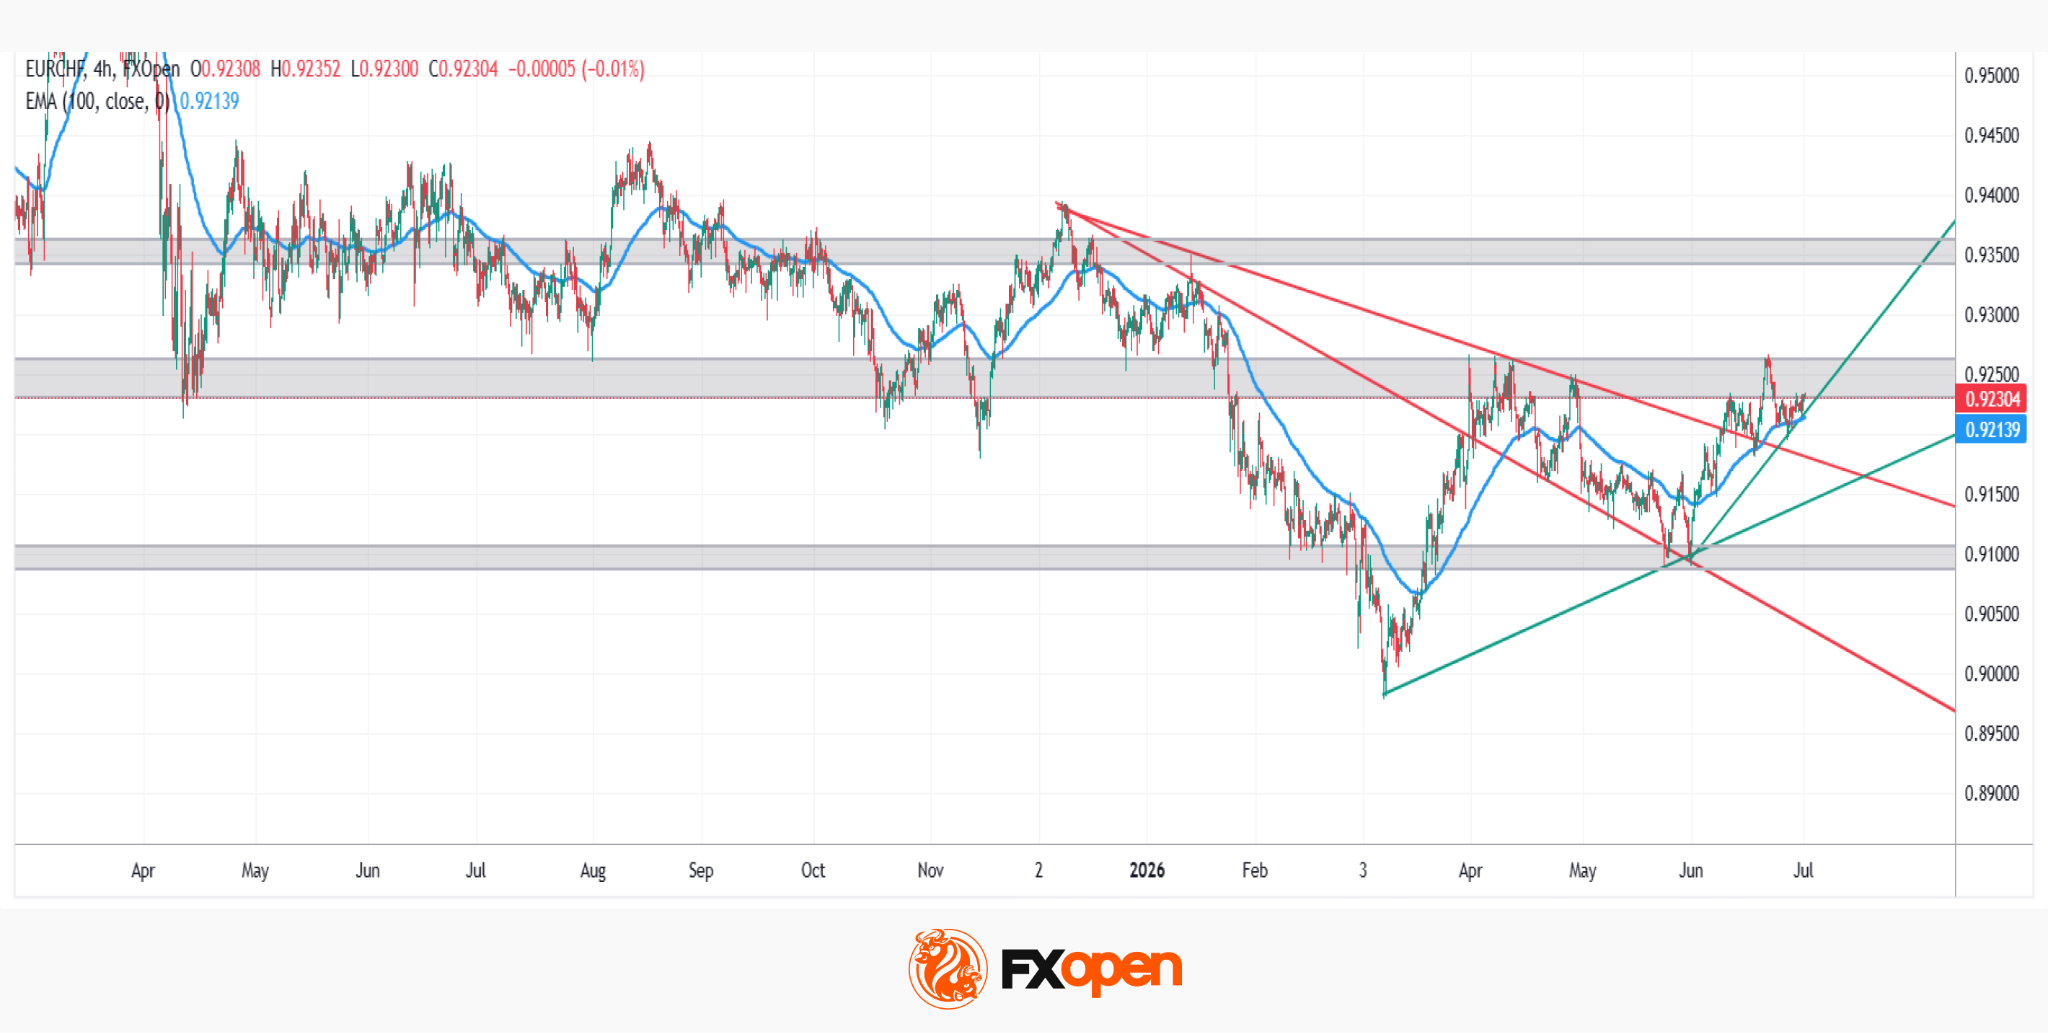
After bottoming out in March 2026, EUR/CHF has been building a medium-term bullish structure. Price is now testing a pivotal zone, the former support around 0.9240–0.9260, which has since flipped into resistance.
Bullish scenario
The 100-period EMA has been underpinning price for several sessions, while two ascending trendlines reinforce the recent breakout from the descending channel. A confirmed break above the 0.9240–0.9260 zone could open the way toward the next key level near 0.9350, validating a bullish structural shift for the pair.
Bearish scenario
A rejection from the current zone, with price slipping back inside the descending channel it recently broke out of, could reignite stronger bearish pressure and drag the pair back toward the 0.9100 support area.
With both the fundamental and technical picture converging at this decisive juncture, and the next central bank moves still uncertain, will EUR/CHF finally manage to break through this heavily contested zone?
Trade over 50 forex markets 24 hours a day with FXOpen. Take advantage of low commissions, deep liquidity, and spreads from 0.0 pips (additional fees may apply). Open your FXOpen account now or learn more about trading forex with FXOpen.
This article represents the opinion of the Companies operating under the FXOpen brand only. It is not to be construed as an offer, solicitation, or recommendation with respect to products and services provided by the Companies operating under the FXOpen brand, nor is it to be considered financial advice.
Why Fed’s Warsh Could Trigger Silver’s Next Selloff Without Saying Much
Silver traders are focused on Thursday's US Non-Farm Payrolls report, but the metal's next major move could begin a day earlier. After days of listless sideways trading, Silver has failed to generate any meaningful recovery despite stabilizing above recent lows. That lack of buying enthusiasm suggests the recent downtrend is still intact. Before payrolls even arrive, today's appearance by Federal Reserve Chair Kevin Warsh may determine whether sellers regain full control.
The reason has less to do with what Warsh is expected to announce than with how he believes a central bank should communicate. Warsh has long argued that policymakers should stop cushioning markets with constant guidance. He skipped publishing a dot plot at his first FOMC meeting and made clear the Fed should "talk less." Under that philosophy, silence itself becomes policy. Investors are no longer searching for reassuring hints about future rate cuts—they are watching to see whether Warsh refuses to challenge the market's increasingly hawkish interpretation of incoming economic data.
That is why today's appearance at the ECB Forum in Sintra carries unusual significance. Warsh does not need to promise a September rate hike to tighten financial conditions. If he repeats that inflation must be defeated regardless of short-term growth concerns, endorses letting markets respond directly to stronger data, or hints that balance sheet reduction should play a larger role alongside higher interest rates, Treasury yields could climb further and the Dollar could strengthen. Those moves would be particularly damaging for Silver, which is highly sensitive both to rising real yields and to shrinking global liquidity.
Thursday's payrolls report still has the potential to reinforce or challenge that narrative, but traders may not wait that long. A hawkish tone from Warsh could encourage investors to position for another strong labor market report before the data are even released. In that sense, his communication style may itself become part of the tightening process, allowing markets to do much of the Fed's work.
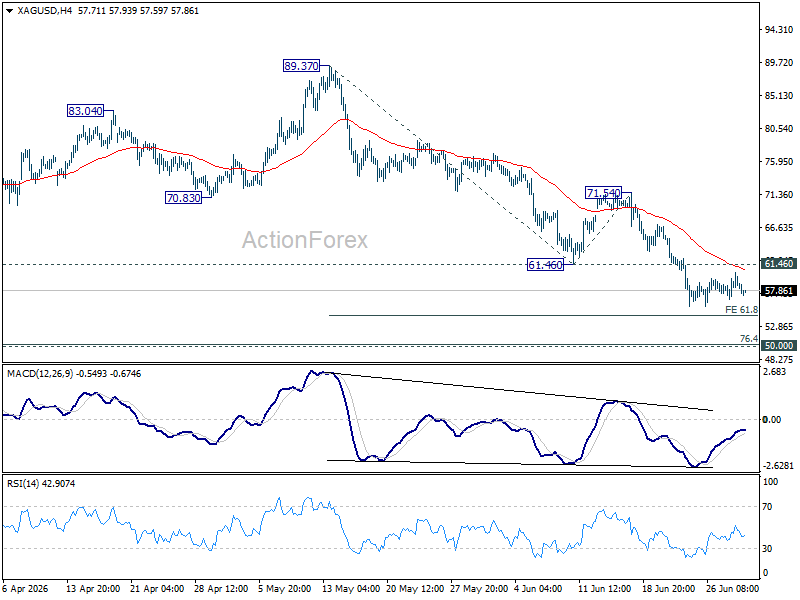
The technical picture already favors the bears. Silver continues to struggle below 61.46 support turned resistance, indicating that the recent recovery lacks conviction. The next downside objective remains the key psychological level at 50, which sits close to 76.4% retracement of 28.28 to 121.83 at 50.35.
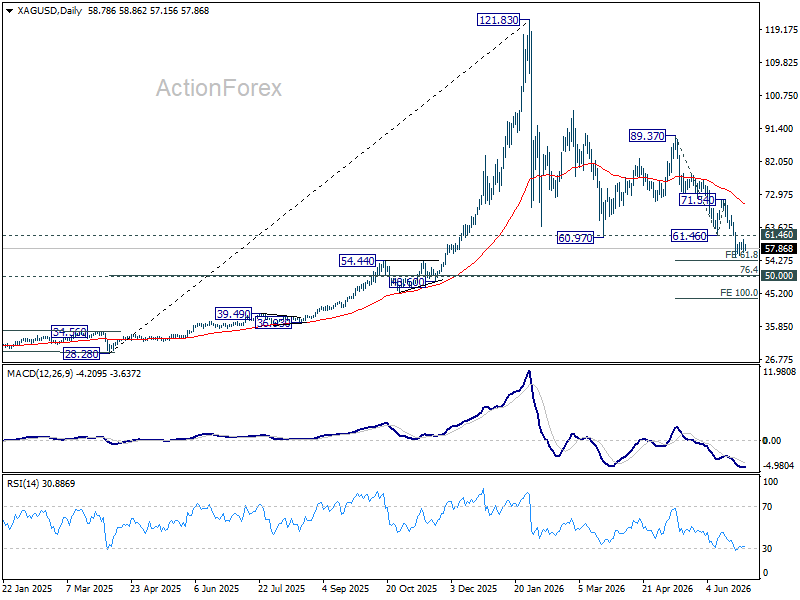
A sustained break beneath that area would signal a much deeper decline toward 100% projection of 89.37 to 61.46 from 71.54 at 43.63, or even further to 40 before finding a bottom.