Sample Category Title
US Consumer Confidence Slips to 91.2 as Jobs Become Harder to Find
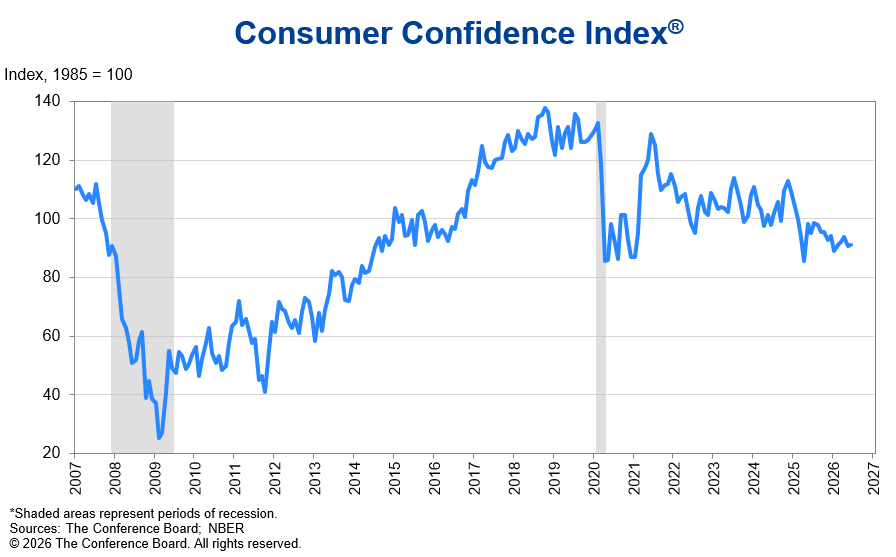
US consumer confidence softened in June, with the Conference Board's headline index falling from 93.1 to 91.2, missing expectations of 94.2. The decline reflected weaker assessments of current economic conditions, even as consumers became slightly more optimistic about the outlook for business conditions and personal incomes.
The Present Situation Index dropped from 119.4 to 116.4, while the Expectations Index improved from 71.4 to 74.4, though it remained well below the 80 threshold that has historically been associated with recession risks.
Dana M. Peterson, Chief Economist at The Conference Board, said falling oil prices had "provided some relief to consumer inflation fears," but noted that perceptions of the labor market "softened measurably." The share of respondents saying jobs were "hard to get" rose to 22.5%, the highest level since January 2021, suggesting households are becoming more cautious about current employment conditions.
Inflation expectations eased further over the month, reflecting lower energy prices following the extension of the US-Iran ceasefire. However, expectations for interest rates remained elevated, with 61.5% of respondents still anticipating higher rates over the next 12 months.
| Indicator | Previous | Latest | Consensus | Comments |
|---|---|---|---|---|
| Conference Board Consumer Confidence | 93.1 | 91.2 | 94.2 | Missed expectations |
| Present Situation Index | 119.4 | 116.4 | — | Current conditions weakened |
| Expectations Index | 71.4 | 74.4 | — | Improved, but remained below the recession-warning threshold of 80 |
| Jobs 'Hard to Get' | — | 22.5% | — | Highest since January 2021 (22.8%) |
| 12-Month Inflation Expectations | Higher | Eased | — | Lower oil prices reduced inflation concerns |
Sunset Market Commentary
Markets
The ECB's annual symposium in Sintra provides plenty of comments and views on the economy and monetary policy. ECB president Lagarde went a long way in her opening remarks explaining the difference between forward guidance and framework guidance. Lagarde believes that markets well understand the ECB's reaction function. Therefore, they don't wait for the central bank to act. They adjust financial conditions in response to new data on their own. That buys the ECB some time to assess how the shock develops. If it does as expected, the ECB validates market pricing, like for example earlier this month (NOT an insurance rate hike). If it differs from what was expected (e.g. last year's tariff shock and markets discounting 1.5% policy rate because of feared hit to growth), it avoids rushing into any wrong policy decision. It is against this framework that markets continue anticipating another ECB rate hike as the energy price shock is expected to start showing through direct and indirect channels. ECB chief economist Lane for example stressed the need to look at how four months of energy-cost increases percolate into food inflation and into services inflation. ECB Sleijpen welcomed the current decline in oil prices, but warned that it remains to be seen what is still in the pipeline. ECB Wunsch added that it took some urgency off the need of another rate hike – "We might not need it as much as we thought in June." If another hike is required, Wunsch still prefers not to wait for too long. Turning to the data, national June inflation numbers published in France (-0.3% M/M & 2% Y/Y), Italy (0.1% M/M & 3.1% Y/Y) and Germany (-0.2% M/M & 2.4% Y/Y) surprised on the downside of expectations contrary to yesterday's Spanish numbers (0.6% M/M & 3.6% Y/Y). If any, they suggest that the headline EMU gauge could drop slightly more than hoped in tomorrow's release (energy-related). Consensus estimate currently stands at 3% Y/Y from 3.2% Y/Y. Core CPI is forecast to hold close to last month's number (2.5% Y/Y from 2.6%). Services inflation is seen even more sticky at 3.3% Y/Y. European bonds treaded water on today's news as it doesn't really alter their view/positioning. Daily changes on the German yield curve currently range between -1 bp and +1 bp. EUR/USD hovers around the 1.14 big figure with the dollar overall failing to profit from highest USD/JPY rates since 1986. It doesn't really have to surprise as the move occurs orderly for now (162.40 from 161.90). European stock markets add up to 1%, catching up with Monday's WS gains whereas key US gauges open mixed today. Brent crude moves slightly away from the sell-off low and headline that Iran is not willing to let go plans of controlling the Hormuz.
News & Views
The economic barometer of the Swiss KOF economic Institute showed that the outlook for the Swiss economy improved notably. After remaining below its medium-term average in the previous months, it in June rose slightly above it. The barometer increased by 2.6 pts to 101.2 (from 98.6). On the production side, positive developments are particularly apparent among the indicators within manufacturing. On the demand side, both the indicator bundles for foreign demand as well as for private consumption showed a favourable outlook. Today, the Swiss National Bank also revealed that it had bought the countervalue of CHF 3.9 bn foreign currency in the January March period. These interventions are in line with the SNB warning that it had an increased willingness to intervene in the currency market in case of a rapid and excessive appreciation of the Swiss franc. As global tensions eased and the market took into account the SNB willingness to intervene if necessary, the Swiss Franc during the month of June eased from the EUR/CHF 0.91 area to currently trade slightly above 0.922.
Polish inflation declined by 0.5% M/M in June, easing the Y/Y measure to 2.5% (from 3.1% in May), exactly at the NBP policy target. The release only provided few details. Food prices declined by 0.7% M/M and were also 0.7% lower compared to the same month last year. Prices for electricity, gas and other fuels declined by 0.4% M/M to still be up 4.8% Y/Y. Fuel prices declined by 7.4% M/M to be up 5.3% Y/Y (from 12.3%) in May. The slowdown in (headline) inflation was more than expected. The data support the mild rhetoric from the National Bank of Poland (NBP), which indicates that rates can stay at the current level for some time to come. Polish money markets almost fully priced out any NBP rate hike. The zloty recently lost some ground. EUR/PLN is nearing the 4.30 area that marked the top of EUR/PLN price action since the start of the conflict in the Middle East.
Canada’s Economic Growth Pops in April
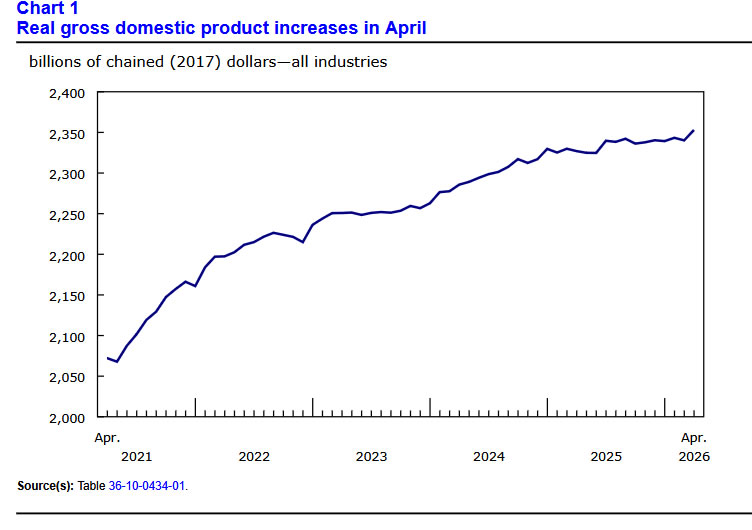
- Canadian GDP jumped by 0.5% month-on-month (m/m) in April, a tick higher than Statistics Canada's advanced guidance and market expectations.
- Growth was broad-based with 14 of 20 industries registering an increase on the month. Goods industries (+1.2% m/m) reversed last months decline, while the services sector grew for a third consecutive month by 0.3% m/m.
- On the goods side, oil & gas extraction (+3.7% m/m) contributed most to growth while modest gains in construction and manufacturing also pitched in on the headline gain.
- On the services side, the public sector aggregate expanded 0.4% m/m, led by gains in public administration. Transportation and warehousing also jumped by a decent 0.9% m/m while the real estate sector ticked higher for a third consecutive month.
- Advanced guidance for May points to a small 0.1% m/m gain. A lift in the finance/insurance/real estate sector is expected to be counterbalanced by a drag in wholesale trade.
Key Implications
- April’s stronger-than-expected print points to a better handoff into the second quarter with Q2 growth now tracking above 2.0% annualized. Zooming out, that leaves the first-quarter stumble looking more like a temporary soft patch than the start of a deeper downturn, broadly in line with the Bank of Canada’s view that growth should resume in Q2 even if the economy remains in excess supply.
- The bigger message here is that this reading should take some air out of the recent “technical recession” narrative. The economy is grinding through a soft patch, but household demand is still providing support to activity, while trade exposed industries are pointing to a tentative recovery. For the Bank of Canada, this argues for patience rather than a pivot. Firmer near-term growth lowers the urgency to ease, while inflation pressures that remain contained for now give the Bank cover to stay on the sidelines.
Yen Breaks Away From Quiet Markets as Traders Race the Payroll Clock
The Japanese Yen remained the clear underperformer in otherwise subdued markets, with USD/JPY climbing to a fresh 40-year high as traders continued to exploit what they see as a narrowing intervention window ahead of Thursday's US Non-Farm Payrolls report. While most major currency pairs remained confined within last week's ranges, the Yen's broad-based decline stood out as investors judged Tokyo unlikely to intervene before one of the year's most important US economic releases.
Japanese officials offered little beyond familiar verbal warnings. Finance Minister Katsunobu Katayama reiterated that authorities stood "ready to take appropriate action," while Chief Cabinet Secretary Yoshimasa Kihara repeated that "bold actions" remained an option in coordination with the United States. However, the restrained tone and lack of any escalation did little to deter speculative buying of USD/JPY. With the Ministry of Finance widely expected to avoid risking a costly intervention immediately before payrolls, market participants appear willing to test higher levels.
Elsewhere, the Dollar traded with a modestly firmer tone but lacked broad follow-through buying. US equity futures were little changed, while the benchmark 10-year Treasury yield hovered slightly below 4.4% as investors waited for fresh catalysts. Thursday's payrolls report remains pivotal for determining whether the Federal Reserve is likely to begin a renewed tightening phase in September. Before then, Wednesday's ADP employment report and ISM Manufacturing survey could influence expectations if they point to continued strength in the US economy.
The Australian Dollar underperformed Dollar, with the Reserve Bank of Australia's meeting minutes failing to generate broader support. While the minutes maintained a clear tightening bias and left the possibility of an August rate hike open, markets increasingly view the RBA as adopting a wait-and-see approach rather than preparing to move imminently. Cooling domestic data and the sharp decline in oil prices have strengthened expectations that second-quarter inflation could moderate enough to justify another pause.
So far this week, the Yen has been the weakest major currency, followed by the Canadian Dollar and the Australian Dollar. The New Zealand Dollar has led gains, largely reflecting a rebound after last week's heavy losses, with Sterling and the Euro also outperforming. The Dollar and Swiss Franc have traded closer to the middle of the performance table as broader markets remain in a holding pattern ahead of the week's key macro events.
USD/JPY Daily Outlook
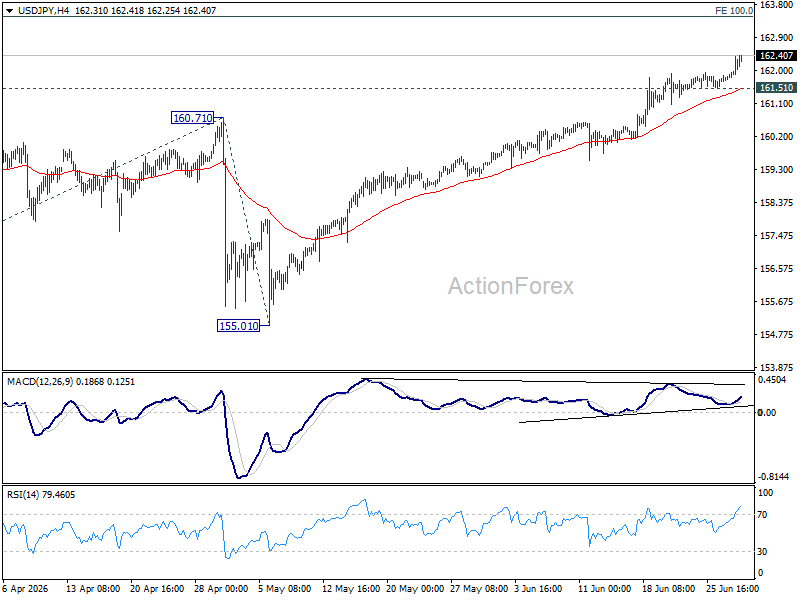
USD/JPY's up trend resumed by breaking through 161.94 and intraday bias is back on the upside. Further rally should be seen to 100% projection of 152.25 to 160.71 from 155.01 at 163.47 next. On the downside, below 161.51 minor support will turn intraday bias neutral again first.
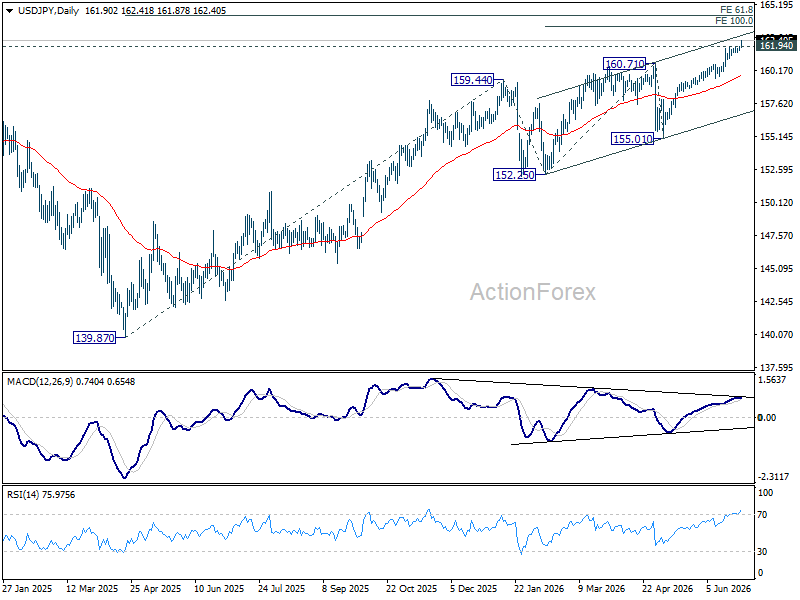
In the bigger picture, rise from 139.87 (2025 low) is seen as another rising leg of the long term up trend. Next target is 61.8% projection of 139.87 to 159.44 from 152.25 at 164.34. For now, outlook will remain bullish as long as 155.01 support holds, even in case of deep pullback.
Canada GDP Rebounds by 0.5% mom in April, May Growth Continues
Canada's economy rebounded more strongly than expected in April, with real GDP rising from March's -0.1% mom to 0.5% mom, surpassing market expectations of 0.4% mom. The recovery was broad-based, with growth recorded in 14 of the 20 industrial sectors, while preliminary estimates pointed to a further 0.1% mom increase in May.
Goods-producing industries led the rebound, expanding 1.2% mom, driven by mining, quarrying, and oil and gas extraction. Services-producing industries also continued to strengthen, rising 0.3% mom for a third consecutive monthly increase, supported by gains in the public sector as well as transportation and warehousing. The breadth of the expansion suggests economic activity regained momentum after March's modest contraction.
Statistics Canada's advance estimate for May indicates growth continued, albeit at a slower pace of 0.1% mom. Strength in finance and insurance together with real estate and rental and leasing was partly offset by declines in wholesale trade and agriculture, forestry, fishing and hunting.
| Indicator | Previous | Latest | Consensus |
|---|---|---|---|
| GDP (MoM, April) | -0.1% | 0.5% | 0.4% |
| Advance GDP Estimate (May) | — | 0.1% | — |
| Goods-Producing Industries (April) | — | +1.2% | — |
| Services-Producing Industries (April) | — | +0.3% | — |
| Industrial Sectors Growing | — | 14 of 20 | — |
Oil Finds No Silver Lining
Oil has returned to the levels seen before the armed conflict in the Middle East much sooner than expected. Brent’s fall of almost 40% from its March highs is not solely due to more barrels coming from the Persian Gulf. The market has adapted to the most far-reaching crisis in the history of the oil market. As a result, traffic through the Strait of Hormuz need not return to previous levels to restore balance. A return to 65%, or 11-12M BPD, will be sufficient.
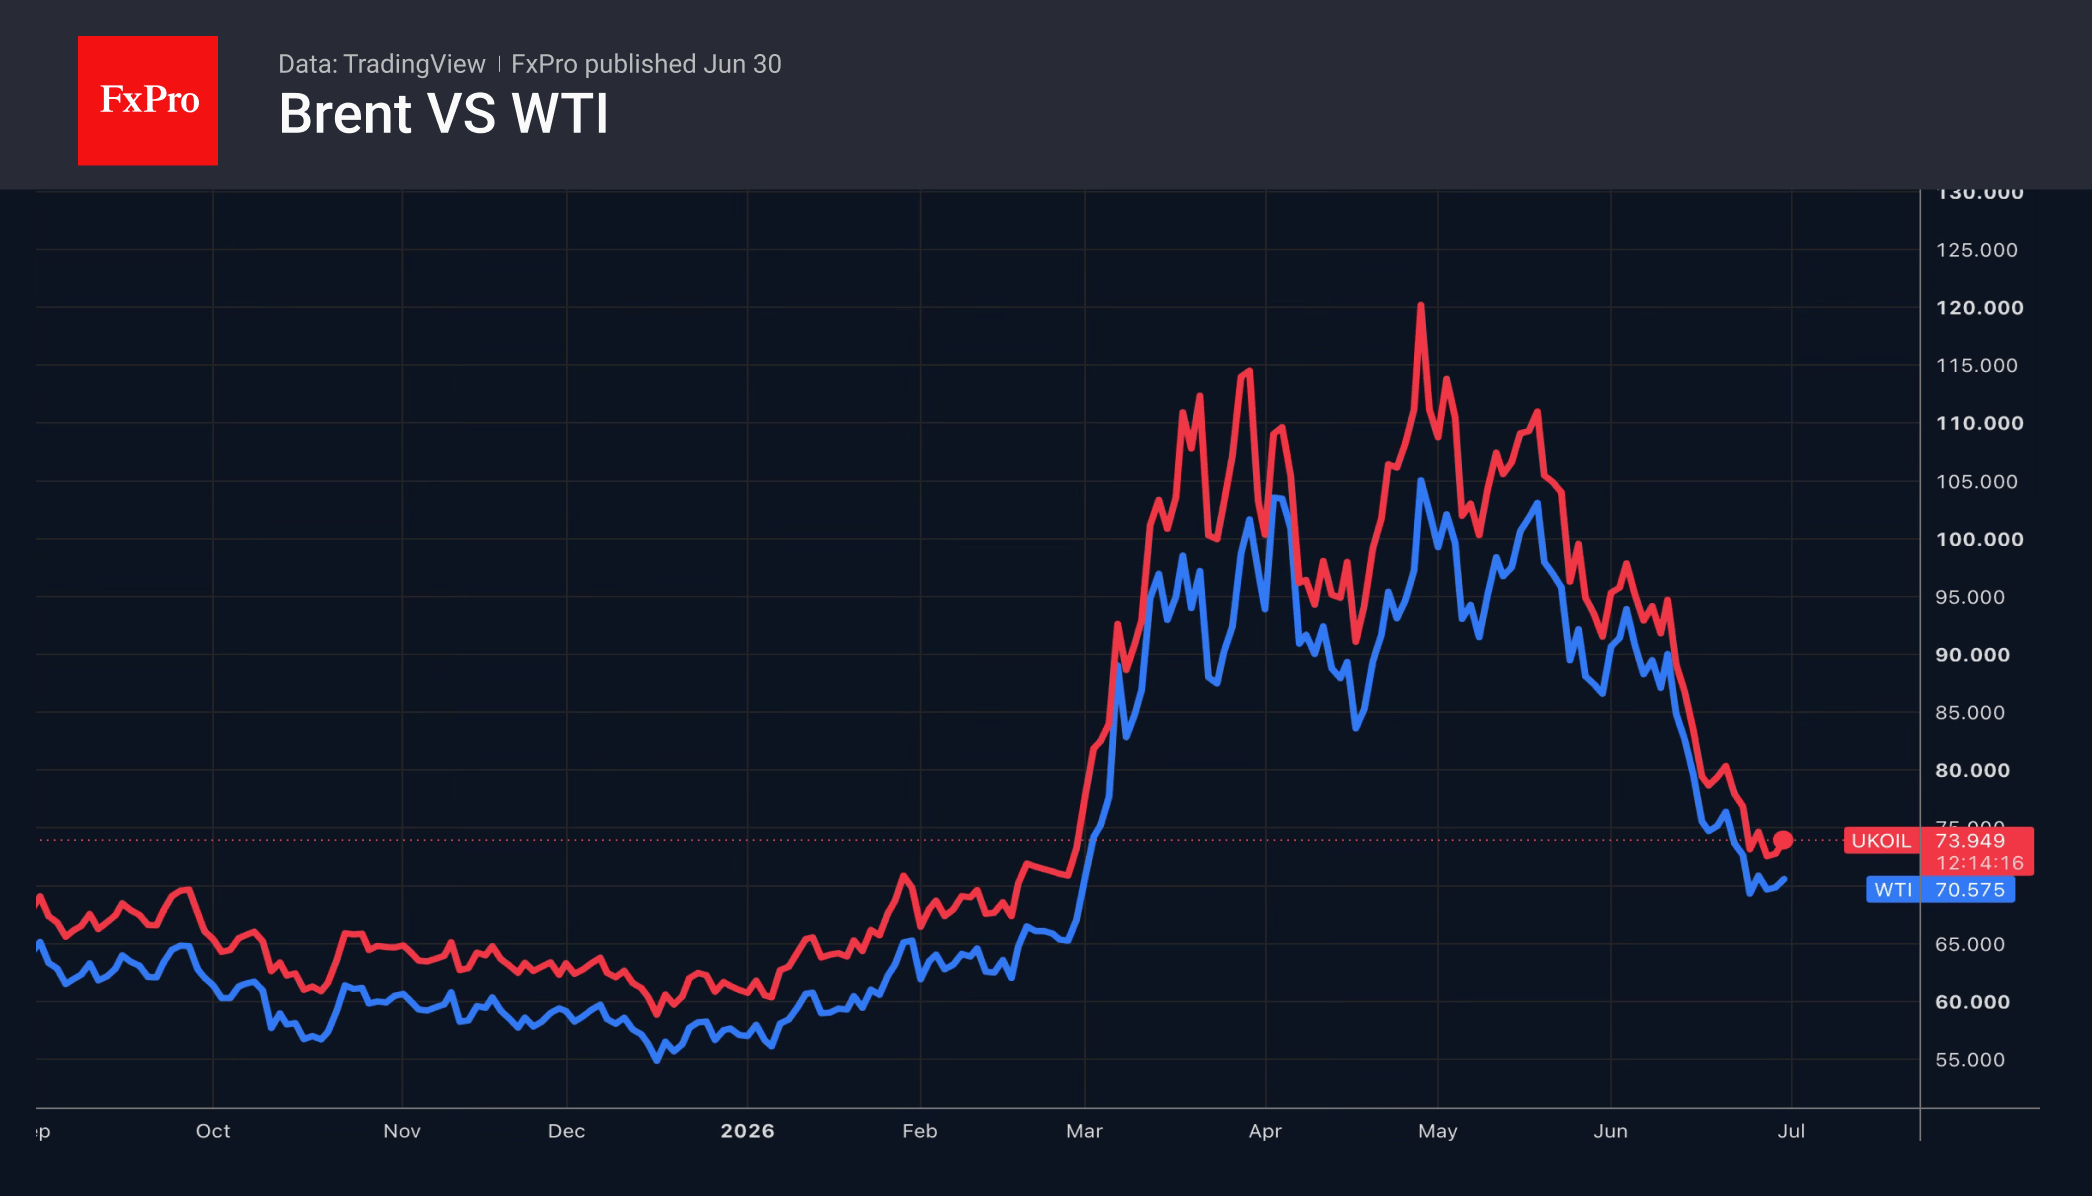
Morgan Stanley put forward this assumption and lowered its forecast for the average Brent price to $75 per barrel in the third and fourth quarters, a $15 and $5 lower than its previous estimate, respectively. According to the bank, while more barrels are flowing through the main oil artery, the bears’ previous trump cards remain in play. These include record growth in US exports and a decline in Chinese energy imports.
The Gulf states’ search for alternative routes has made it possible to partially meet demand from Europe and Asia for the next couple of months. These continents do not require any more oil. The Iranian output could also surge to 3.3M BPD by the end of the year, following the lifting of sanctions. Combined with the gradual recovery in regional production, this creates a distinctly bearish backdrop for Brent.
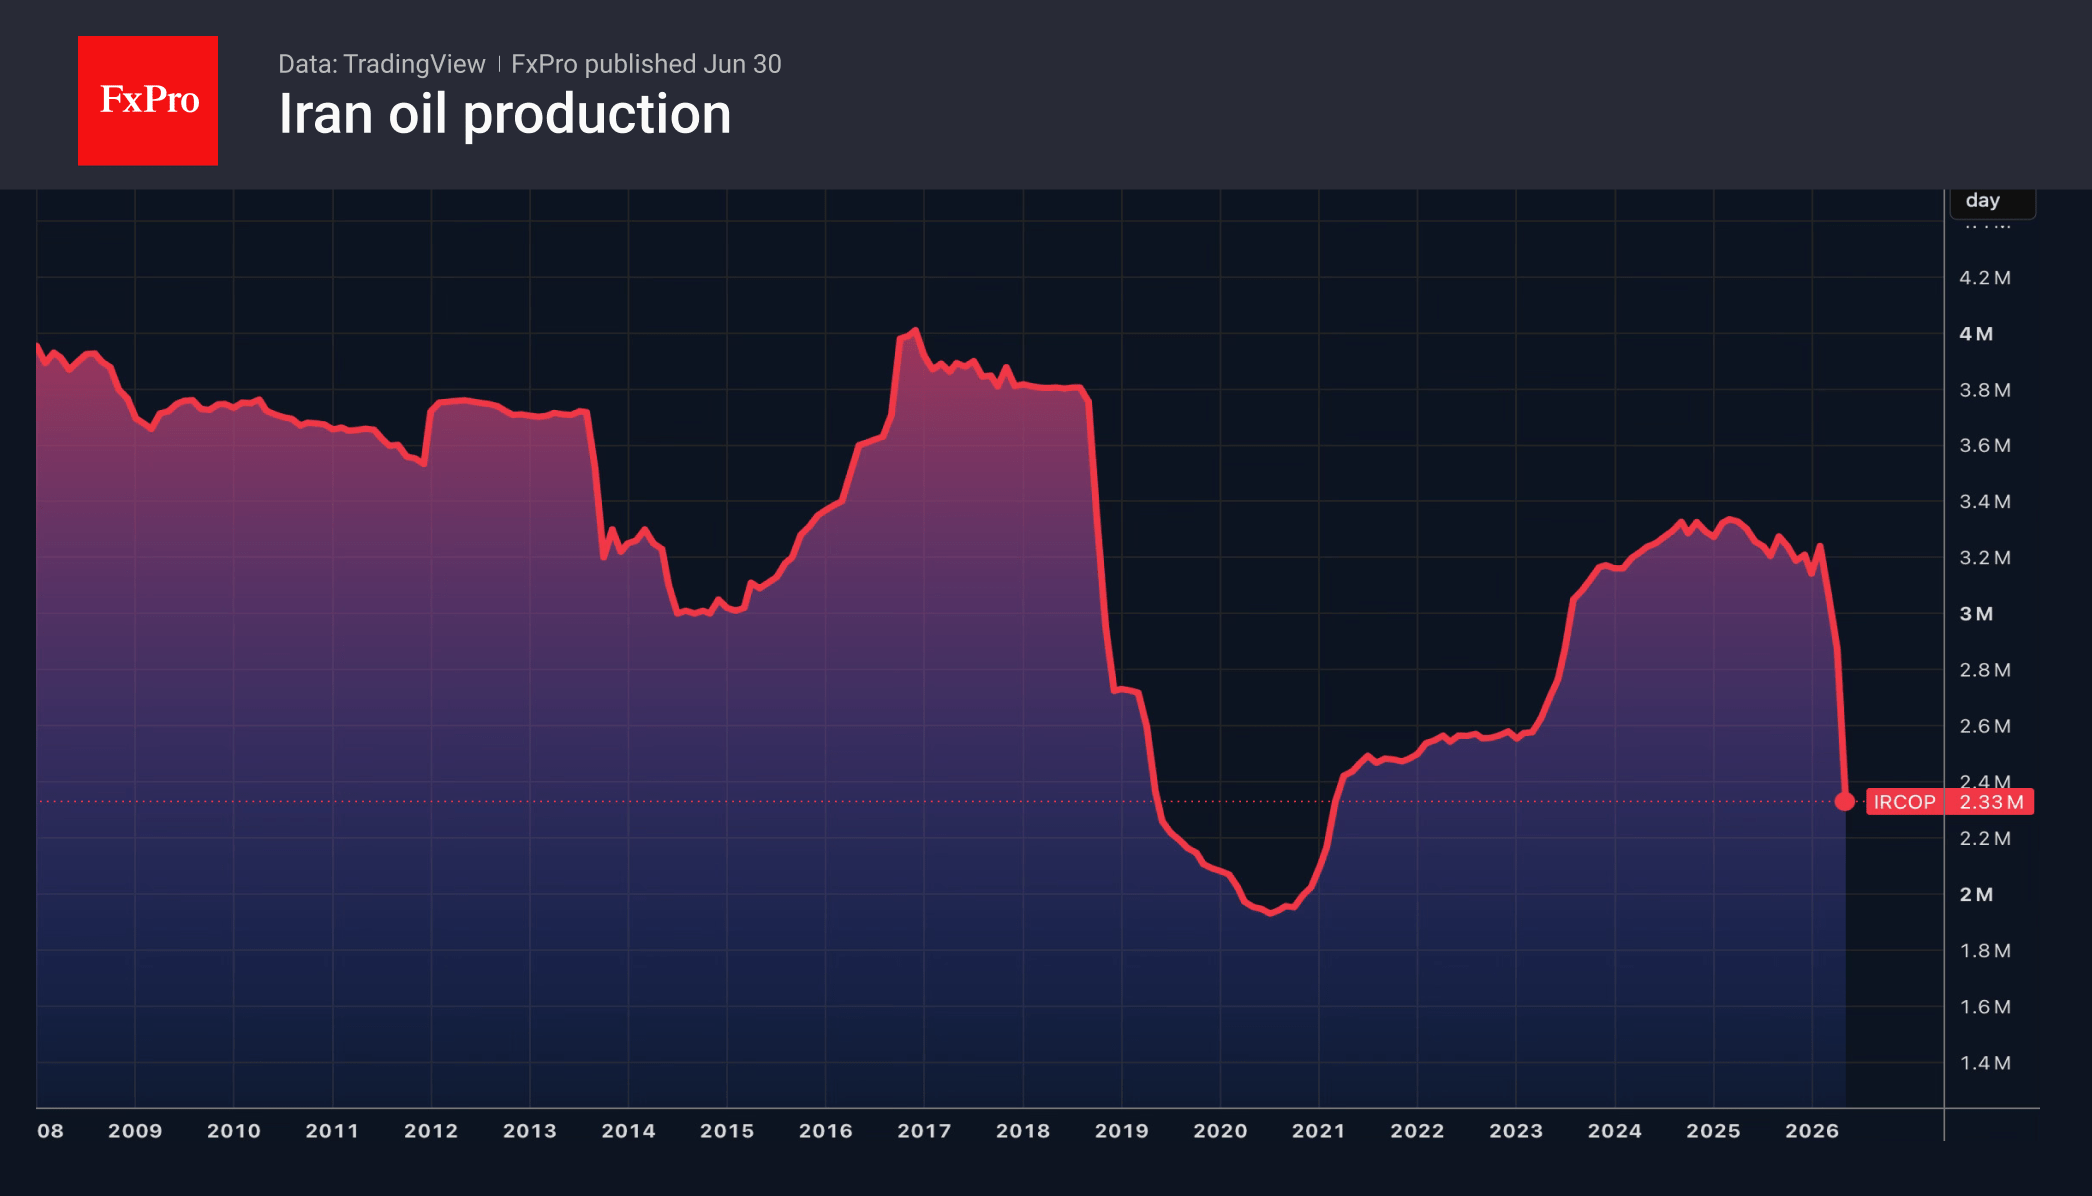
There is no doubt that the market will stabilise over the coming weeks. It will need to replenish global stocks, which have been considerably depleted, and meet growing demand from Europe and Asia. Oil prices could even rise if the conflict in the Middle East escalates. If the conflict does not escalate further, the long-term outlook for Brent looks rather bleak.
According to estimates from the International Energy Agency, global crude oil supply in 2026 will fall by 3.9M BPD in 2026. Supply is expected to increase by 8M to 110.3M BPD in 2027. Demand will recover at a much more modest pace, and next year the oil market risks facing a surplus of 5M BPD.
Thus, barring an escalation of the geopolitical conflict in the Middle East, the downward trend in Brent is likely to persist.
The FxPro Analyst Team
EUR/USD Daily Outlook
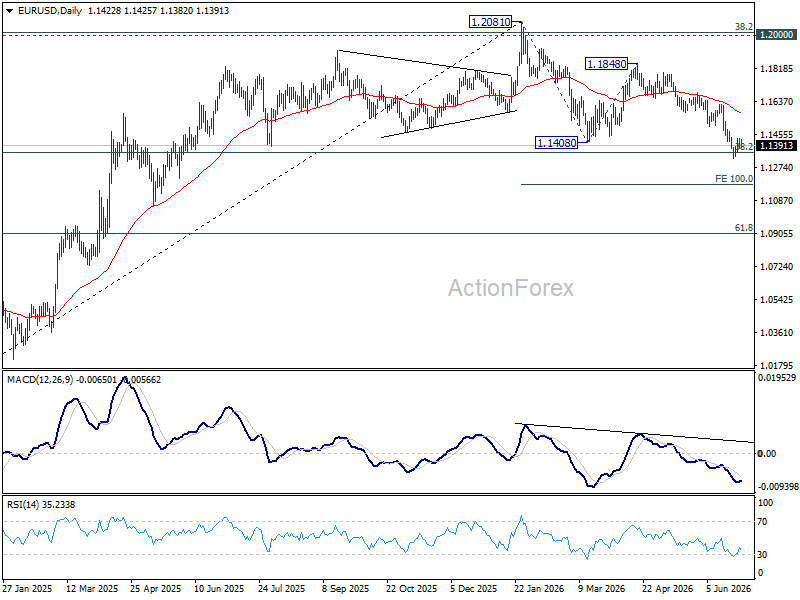
EUR/USD is extending consolidations from 1.1323 and intraday bias remains neutral. Further fall is expected as long as 1.1499 support turned resistance holds. Break of 1.1323 will resume the fall from 1.2081 to 100% projection of 1.2081 to 1.1408 from 1.1848 at 1.1175.
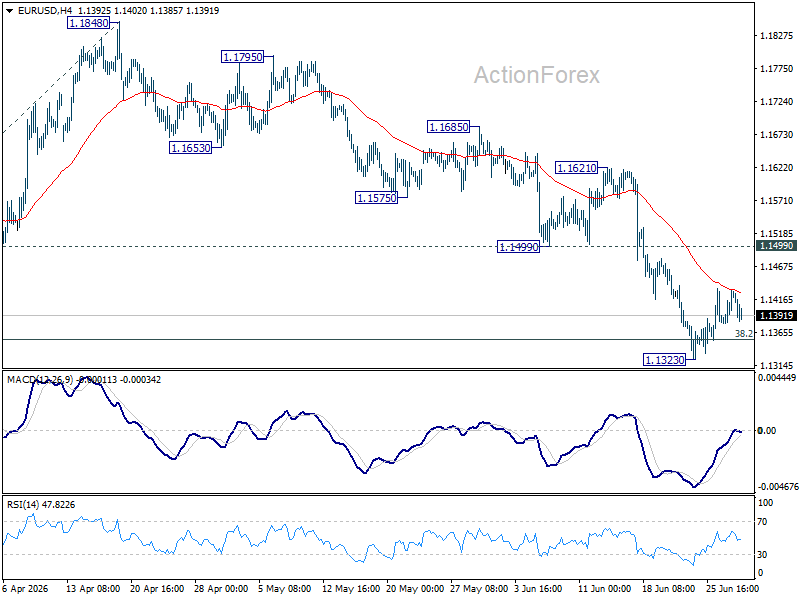
In the bigger picture, focus is back on 38.2% retracement of 1.0176 to 1.2081 at 1.1353. Decisive break there will revive the case of medium term bearish trend reversal after rejection by 1.2 key cluster resistance level. Further fall should be seen to 61.8% retracement at 1.0904. Nevertheless, strong rebound from 1.1353, followed by break of 1.1621 resistance, will retain medium term bullishness.
USD/JPY Daily Outlook
USD/JPY's up trend resumed by breaking through 161.94 and intraday bias is back on the upside. Further rally should be seen to 100% projection of 152.25 to 160.71 from 155.01 at 163.47 next. On the downside, below 161.51 minor support will turn intraday bias neutral again first.
In the bigger picture, rise from 139.87 (2025 low) is seen as another rising leg of the long term up trend. Next target is 61.8% projection of 139.87 to 159.44 from 152.25 at 164.34. For now, outlook will remain bullish as long as 155.01 support holds, even in case of deep pullback.
GBP/USD Daily Outlook
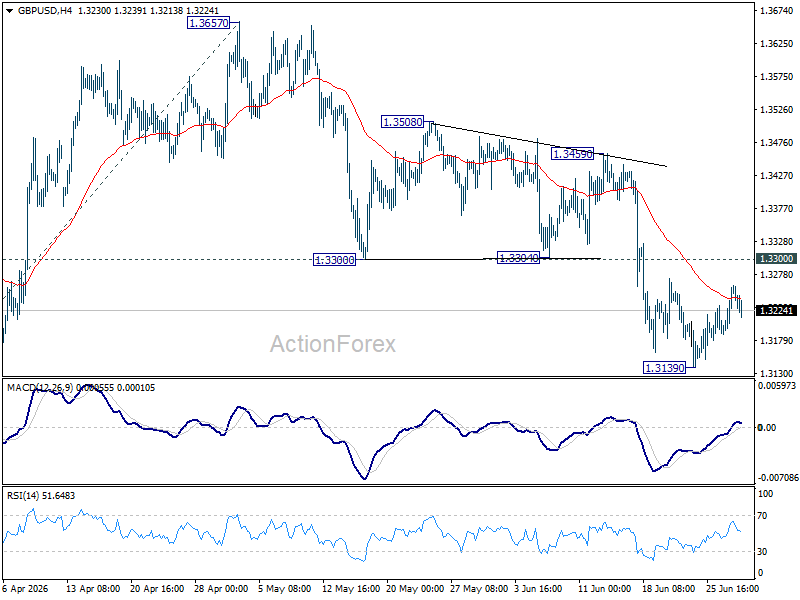
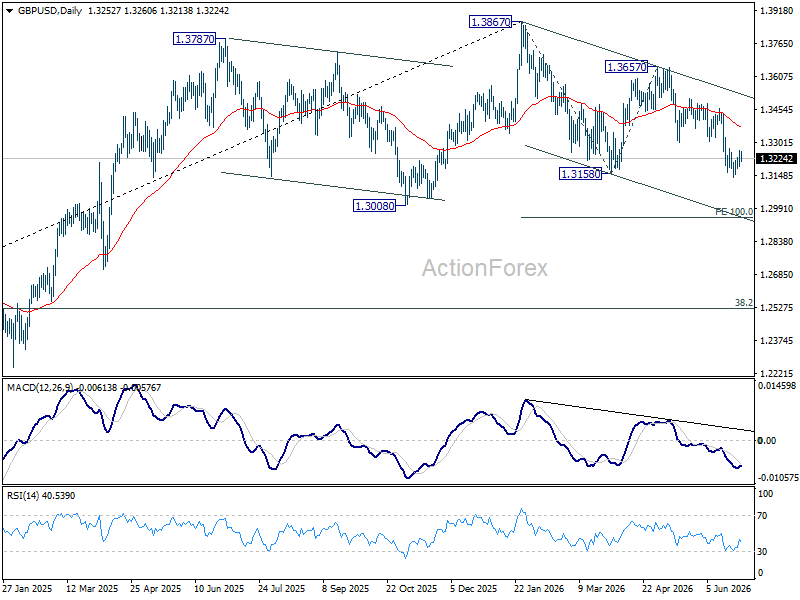
GBP/USD is still extending consolidations from 1.3139 and intraday bias remains neutral. Upside should be limited by 1.3300 support turned resistance. Below 1.3139 will target 100% projection of 1.3867 to 1.3158 from 1.3657 at 1.2948.
In the bigger picture, price actions from 1.3867 are a corrective pattern within the broader up trend from 1.0351 (2022 low). With 1.3008 support intact, medium term bullishness is maintained and break of 1.3867 is in favor for a later stage, towards 1.4248 key resistance (2021 high). However, firm break of 1.3008 will at least bring deeper fall to 38.2% retracement of 1.0351 to 1.3867 at 1.2524, with increased risk of bearish reversal.
USD/CHF Daily Outlook
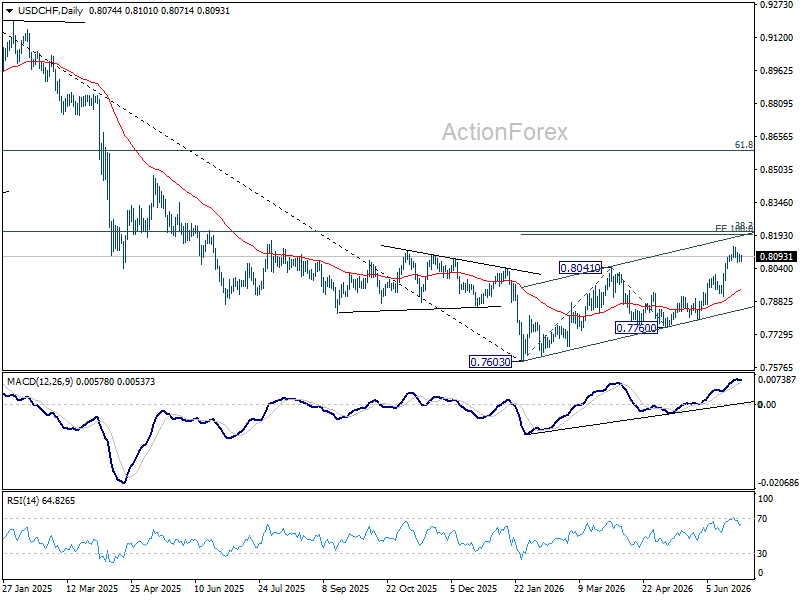
USD/CHF is extending consolidations below 0.8139 and intraday bias remains neutral. Downside should be contained by 0.8012 resistance turned support to bring another rally. Above 0.8139 will target 100% projection 0.7603 to 0.8041 from 0.7600 at 0.8198 next.
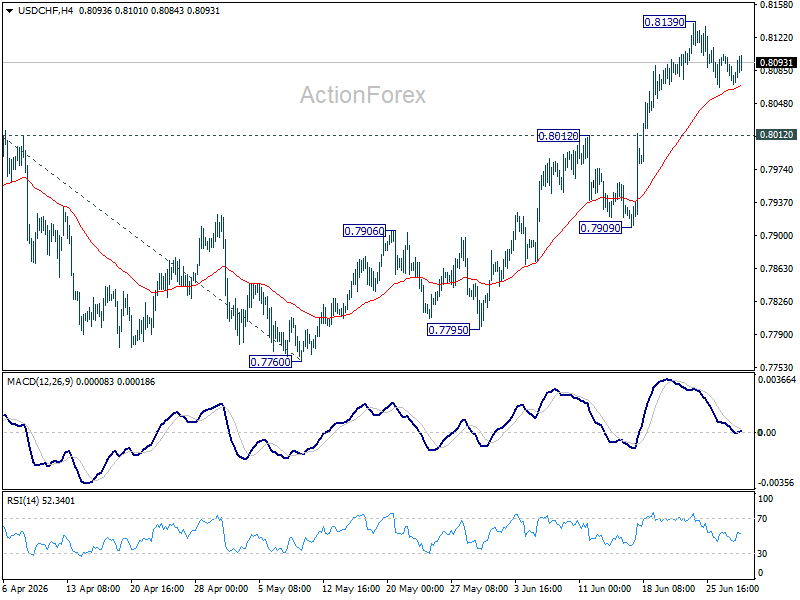
In the bigger picture, while a medium term bottom was formed at 0.7603, it's still early to call for bullish trend reversal. As long as 38.2% retracement of 0.9200 (2025 high) to 0.7603 at 0.8213 holds, the larger down trend could still continue through 0.7603 at a later stage. However, firm break of 0.7603 will argue that the trend has reversed and turn focus to 0.8332 support turned resistance (2023 low) for confirmation.