

Sample Category Title
NASDAQ Has Finished Consolidating. Now It Needs Permission from Goldilocks NFP
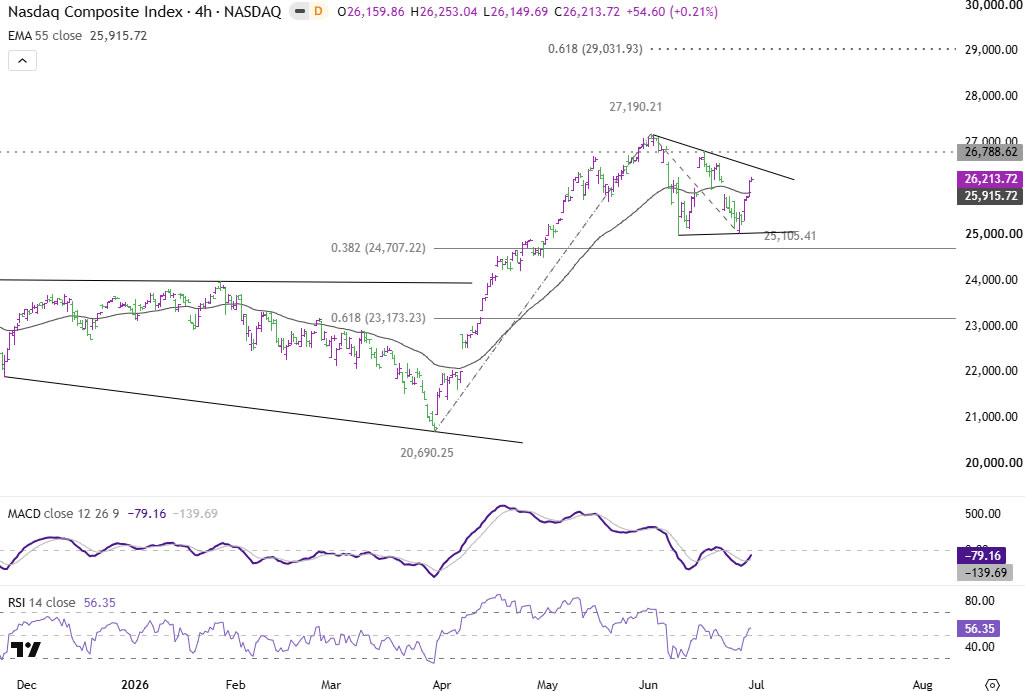
The NASDAQ Composite ended the second quarter with its strongest performance in six years, but the bigger story may be what comes next. After surging 21.41% during the quarter to close at 26,213.72, the tech-heavy index appears to have completed a healthy consolidation following its record intraday high of 27,190.21 on June 1. The market's attention has now shifted almost entirely to Thursday's US Non-Farm Payrolls report, which could determine whether the next leg higher begins immediately or is delayed a little longer.
The quarter itself unfolded in two distinct phases. April and May were dominated by a powerful rally in semiconductor stocks, easing oil prices and optimism surrounding the historic SpaceX IPO, which briefly propelled the company to an almost USD 3 trillion valuation. By contrast, June brought a period of consolidation as investors questioned how quickly massive AI infrastructure spending by large technology companies would translate into earnings growth. Capital rotated from the Magnificent Seven into smaller-cap and defensive shares, leaving the NASDAQ down -2.8% for the month before a strong 1.5% rally on the final trading day of the quarter reaffirmed broader bullish momentum.
Technically, June's price action resembles a textbook bull flag rather than the beginning of a broader correction. The high-volume rebound into quarter-end suggests the consolidation from the June peak may already have run its course, leaving the index well positioned for another attempt at record highs.
Whether that breakout materializes immediately now depends largely on the US labor market. The ideal outcome for equities is a "Goldilocks" payrolls report—job growth close to expectations of around 110k together with 0.3% monthly wage growth. Such a result would reinforce confidence that economic activity remains resilient without reigniting inflation concerns. With one additional Federal Reserve rate hike under Chair Kevin Warsh already largely reflected in market pricing, a balanced employment report would remove a key source of uncertainty for growth stocks.
A materially stronger or weaker report could still trigger a short-term pullback. A hot report would revive speculation of a more aggressive tightening path, while a weak report could fuel concerns about slowing corporate earnings. Even so, unless the data fundamentally alters the macro outlook, either reaction would likely be viewed as an extension of the recent consolidation rather than a reversal of the broader uptrend.
Technically, the immediate focus is on 26,788.62. A decisive break above that resistance would confirm completion of the three-wave correction from 27,190.21 to 25,105.41 and open the way for a retest of the record high. Beyond that, the next upside objective comes at the 61.8% projection of 20,690.25 to 27,190.21 from 25,105.41 at 29,031.93. If consolidation extends instead, downside should be contained around the 38.2% retracement at 24,707.22, where buying interest is expected to re-emerge.
BoJ Tankan: Manufacturing Sentiment Climbs to Highest Since 2018, Outlook Turns More Cautious
Japan's business confidence improved more than expected in the second quarter, with the Bank of Japan's Tankan survey showing sentiment among large manufacturers rising from 17 to 22 in June, well above the market consensus of 16. The index increased for a fifth consecutive quarter and reached its highest level since March 2018, underscoring the resilience of Japan's industrial sector despite heightened geopolitical uncertainty. Confidence among large non-manufacturers also edged up from 36 to 37, marking the first improvement in five quarters.
The BOJ attributed the strength largely to robust demand for semiconductors and artificial intelligence-related products, which continued to support a broad range of technology industries. Officials also noted that more companies were successfully passing higher raw material costs on to customers, helping to support profitability. At the same time, some manufacturers benefited from front-loaded orders as customers sought to secure supplies during the Middle East conflict, even as businesses remained concerned that supply chains could face further disruptions.
Despite the stronger current assessment, firms became more cautious about the months ahead. Large manufacturers expect the business conditions index to ease back to 17 by September, while large non-manufacturers project a sharper decline to 28. Notably, most survey responses were collected before the preliminary US-Iran peace agreement, meaning respondents were still evaluating conditions when geopolitical tensions and energy prices were elevated. The results suggest Japan's corporate sector entered the second half of the year from a position of strength, but remains mindful that some of the recent boost from AI demand and precautionary stockpiling may prove temporary.
| Indicator | Previous | Latest | Consensus |
|---|---|---|---|
| Large Manufacturers Business Conditions | 17 | 22 | 16 |
| Large Non-Manufacturers Business Conditions | 36 | 37 | 35 |
| Large Manufacturers Outlook (September) | — | 17 | — |
| Large Non-Manufacturers Outlook (September) | — | 28 | — |
Japan Manufacturing PMI Hits 12-Year Quarterly High as AI Demand Drives Growth
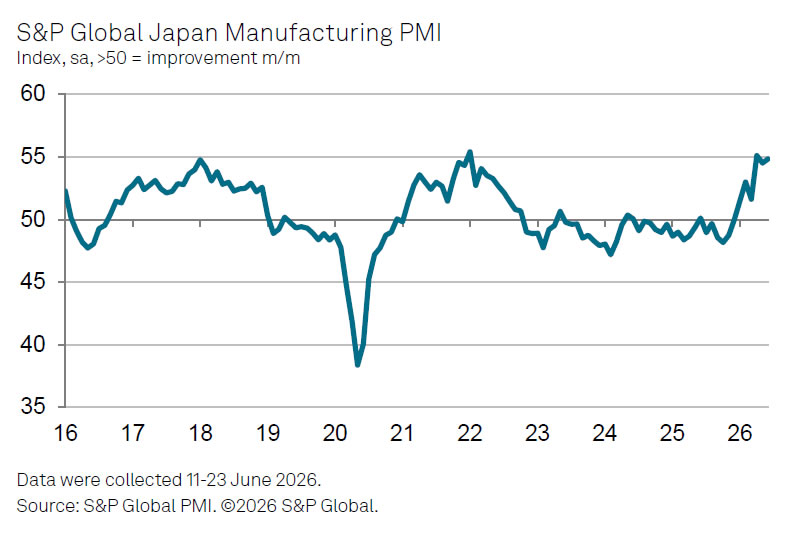
Japan's manufacturing sector strengthened further in June, with the S&P Global Manufacturing PMI rising from 54.5 to 54.8, marking a sixth consecutive month of expansion. The latest reading capped the sector's strongest quarterly performance since the first quarter of 2014, supported by robust production growth and the fastest increase in new orders in nearly four-and-a-half years.
According to S&P Global, the expansion was driven by strong demand for AI-related technology and semiconductors, alongside continued gains in customer demand. However, the survey also highlighted that part of the strength reflected precautionary stockpiling by businesses amid the Middle East conflict. Shipping delays and supplier shortages continued to weigh on supply chains, contributing to some of the strongest inflationary pressures recorded since the survey began in 2001, with both input costs and selling prices rising rapidly again in June.
Looking ahead, S&P Global cautioned that the current pace of growth may prove difficult to sustain into the second half of the year. As geopolitical tensions ease and stockpiling activity fades, demand could normalize while elevated costs continue to pressure client spending. The latest survey therefore points to a manufacturing sector that is benefiting from strong technology demand and temporary inventory building, but whose resilience will increasingly depend on whether underlying domestic and global demand can continue to offset fading supply-driven support.
| Indicator | Previous | Latest |
|---|---|---|
| Manufacturing PMI | 54.5 | 54.8 |
| Quarterly Performance | — | Strongest since Q1 2014 |
| New Orders | Strong | Fastest growth in nearly 4½ years |
| Production | Expanding | Solid expansion |
| Supplier Delivery Times | Deteriorated | Deteriorated further |
| Input Cost Inflation | Elevated | Among highest since 2001 |
| Output Price Inflation | Elevated | Remained rapid |
Australia Manufacturing PMI Finalized at Five-Month High Despite Middle East Disruptions
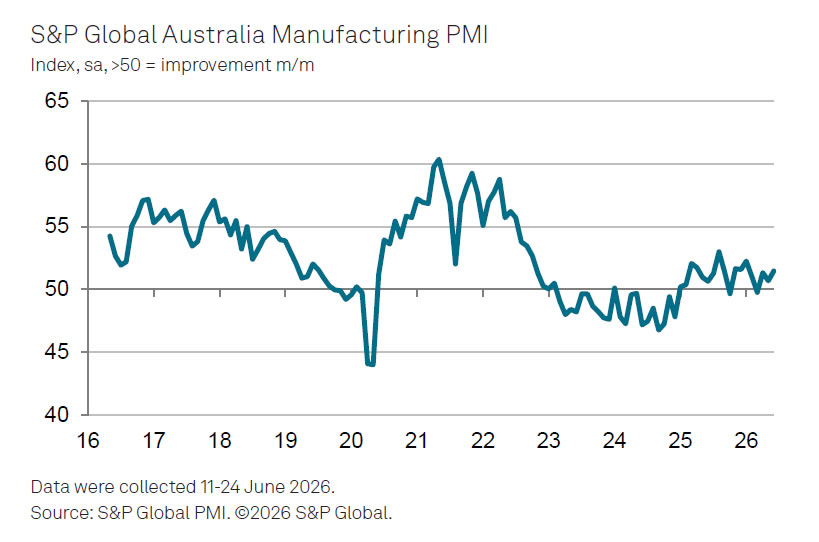
Australia's manufacturing sector strengthened further in June, with the S&P Global Manufacturing PMI rising from 50.7 to 51.5, marking its third consecutive month above the 50.0 expansion threshold and its highest reading since January. The data suggest factory activity continued to improve despite ongoing geopolitical disruptions affecting global supply chains.
According to S&P Global, the conflict in the Middle East continued to weigh heavily on manufacturers during the month, even after the US and Iran signed a memorandum of understanding aimed at ending hostilities. Economics Director Andrew Harker noted that suppliers' delivery times "lengthened substantially" and input costs "rose rapidly again." However, he also pointed out that the increase in selling prices slowed markedly, suggesting inflationary pressures may begin to ease if geopolitical tensions continue to stabilize.
Australian manufacturers also appeared increasingly optimistic about future demand. Firms expanded hiring and increased inventories of purchased inputs to prepare for upcoming projects and to guard against further supply disruptions. Harker said businesses were "well positioned to ramp up production once new orders return to growth," indicating confidence that activity could strengthen further once supply conditions normalize and demand improves.
| Indicator | Previous | Latest |
|---|---|---|
| Manufacturing PMI | 50.7 | 51.5 |
| Manufacturing Activity | Expansion | Expansion strengthened |
| Supplier Delivery Times | Lengthened | Lengthened substantially |
| Input Costs | Rising | Rose rapidly again |
| Output Price Inflation | Rising | Increase slowed |
| Employment | — | Increased |
| Inventories of Purchases | — | Increased |
| New Orders | Weak | Not yet expanding |
RBA Minutes and Other Commentary: Still on Edge About Inflation
- RBA Minutes reprise the 'hawkish hold' message from June's decision statement.
- Some notable observations on housing and data centre build but central narrative unchanged.
- Deputy Governor Hauser's recent speech and accompanying RBA research underscore risks around tight capacity and possible shift in price-setting behaviour.
- Q2 CPI remains critical, with a lot riding on how this and the balance of risks to the outlook are judged.
RBA Minutes released today and other commentary over the last week suggest the Monetary Policy Board is still on edge about inflation risks in Australia.
The advent of post-meeting media conferences means the minutes to RBA meetings are of less importance than they once were. However, they still serve to remind us of the key considerations for policy. Read alongside last week's speech by the Deputy Governor and a series of RBA insight notes, the latest Minutes suggest the Bank is still on heightened inflation alert.
The central narrative through the meeting Minutes is, unsurprisingly, the same as that set out in the decision statement and in the Governor's post-meeting press conference. The economy is still seen as tight, i.e. "operating with excess demand and widespread inflationary pressures". However, the Board opted to use the 'space' provided by previous rate rises, pausing in June to get a better sense of how the situation was unfolding in the Middle East and how previous rate rises were impacting locally.
There were some interesting tidbits in the detail though, including:
- Financial conditions are now seen as restrictive. While the conviction here is not high ("probably somewhat restrictive"; "remained uncertain") it is a little more forthright than the decision statement which simply stated that conditions were now tighter. That uncertainty may also be partly due to staff updates on the RBA's modelled estimates which pointed to a slightly higher real neutral rate compared to when the cash rate was last at 4.35% (at the start of last year).
- Housing market developments were largely absent in the decision statement but featured a few times in the Minutes, including in the 'Considerations for Monetary Policy section' ("Housing demand had eased, which also reflected the broader economic environment and recently proposed tax changes"; and "Members also noted the risks associated with a potentially material weakening in housing markets, including if this were to inhibit growth in consumption"). Likewise, the data centre investment surge rated a mention in the main assessment section as well ("[Members] discussed the potential for continued strength in such activity to exacerbate capacity pressures and skills shortages in other parts of the economy").
While neither topic is a central concern for the Board right now, they are on the radar.
Also of some note were the areas where views within the Board differed. In particular, there were "somewhat differing views about the extent of current capacity pressures". As we have discussed in the past, this likely centres on assessments of slack in the labour market. That would seem to be the case given that members still assessed that persistently weaker-than-expected productivity growth was a problem for bringing inflation back to target.
The other notable point of difference was on the extent to which the Fair Work Commission's moderately higher than expected 4.75% increase in all modern award wages might indirectly influence other wage negotiations. Again, views on the impact differed but Members agreed that it would "depend in part on the tightness of the labour market and expectations for inflation".
Coming back to the central narrative of tight capacity and persistent inflation, the RBA deliberations here have been given some additional framing by the Deputy Governor and a series of RBA 'insight' notes. Titled "The Straight Line Belongs to Man, the Curved Line Belongs to God", Deputy Governor Hauser's Sir Douglas Copland Memorial Lecture, delivered to the Economic Society of Australia last week, was a little more technical than the 'fireside chats' and speeches that have been used to shape mainstream and financial market expectations. However, it focussed on two areas that are extremely pertinent to the Board's current deliberations, namely: 1) the sensitivity of inflation to shocks when capacity is tight; and 2) potential changes in price-setting behaviour. The 'straight lines' and 'curves' being discussed were those showing the relationship between unemployment and wage growth or price inflation, and between cost and price changes. And the question is to what degree do these relationships become 'curvier' as unemployment falls/capacity tightens.
The Deputy Governor spelled out the clear takeaway for monetary policy: that inflationary pressures are likely to be higher for a given change in activity if; 1) domestic capacity pressures and inflation are already elevated; and/or 2) cost shocks are large or persistent; and/or 3) inflation expectations are elevated. From here the Deputy Governor concluded that "non-linearities in the Phillips curve suggest that policy should respond proactively to an inflationary shock when we are already on the steep part of the curve – and that is what the Monetary Policy Board has done in recent months."
The insights notes expand on this a little, in an even more technical manner. Some notable points are that:
- the RBA's models currently incorporate some non-linearity (i.e. curviness) in the relationship between unemployment and wage costs/inflation but not in price-setting behaviour which means the latter will be a key area of judgement for policy making (informed by liaison);
- there is clear evidence that price-setting behaviour did change during and after the pandemic, adjusting more frequently from 2022;
- this increased price flexibility is estimated to account for 0.4-1.3ppts of the gap between modelled estimates and the actual peak in inflation 2022-23; and
- that the way the policy trade-off between inflation and unemployment shifts when prices are more flexible means policy can focus more closely on the inflation part of the mandate (the idea here being that inflation declines will also be associated with more muted rises in unemployment).
All up, the RBA minutes and other communications again point to heightened concerns about persistently above-target inflation. We already knew the June quarter CPI release on July 29 would be the critical piece of domestic information heading into the RBA Monetary Policy Board's August 10-11 meeting. However, the latest RBA communications make it clear that aside from this, the key judgements will be around the scale and persistence of shocks emanating from the Middle East, and whether price setting behaviour has shifted.
On balance, we continue to see high inflation and an unacceptably slow return to target as drawing additional interest rate rises from the RBA – but depending on how the inflation data, geopolitics and key judgements land, that balance could be a close-run thing.
EURUSD – Recovery Faces Headwinds from 10Dma / Fading ECB Hike Prospects
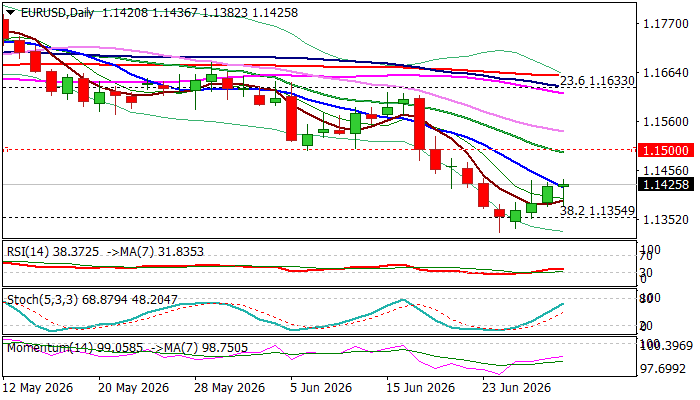
Recovery leg from 1.1324 (2026 low, posted last week) started to lose traction, as better than expected inflation numbers from some EU member countries (Germany, France, Italy) cooled expectations for ECB rate hike.
Markets wait for the EU June CPI data (due tomorrow), as well this week’s release of US labor sector report for June.
Renewed attempt through falling 10DMA (1.1419) may open way for further recovery (on clear break higher) though upticks are likely to be limited, as daily studies are predominantly negative.
Significant barriers at 1.1500 zone (psychological / 20DMA / former higher base) should cap extended upticks to keep larger bears in play.
Conversely, sustained break above 1.1500 pivot would sideline bears and allow for stronger recovery.
Res: 1.1473; 1.1500; 1.1540; 1.1600
Sup: 1.1382; 1.1354; 1.1324; 1.1290
Nikkei 225 Wave Analysis
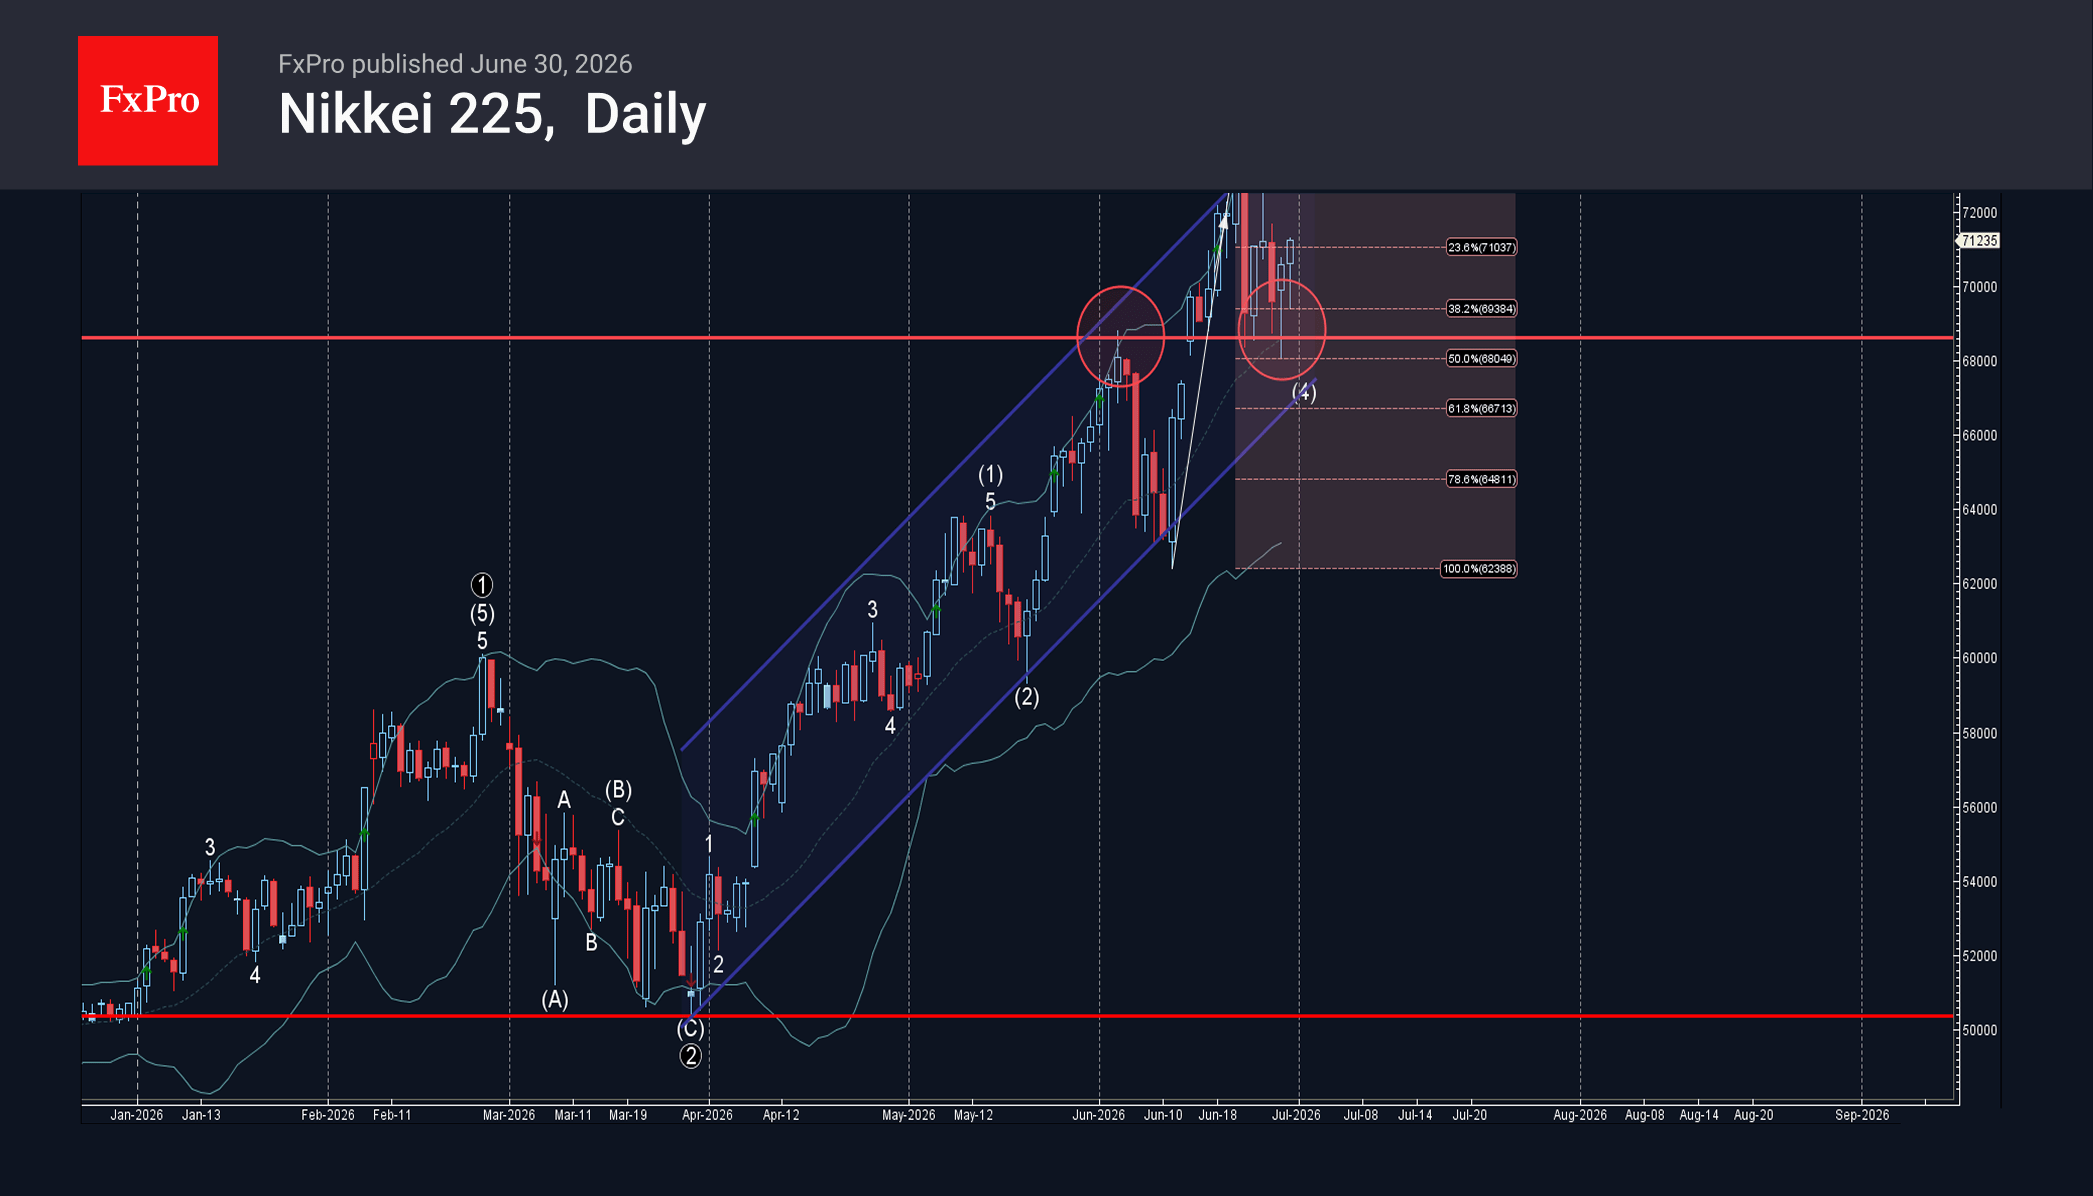
Nikkei 225: ⬆️ Buy
– Nikkei 225 reversed from support level 68600.00
– Likely to rise to resistance level 72575.00
Nikkei 225 index recently reversed from the support area between the support level 68600.00 (former strong resistance from the start of June), 20-day moving average and the 50% Fibonacci correction of the upward impulse from the start of this month.
The upward reversal from this support area created the daily Japanese candlesticks reversal pattern Hammer – which started the active impulse wave (5).
Given the strong daily uptrend, Nikkei 225 index can be expected to rise to the next resistance level 72575.00 (that stopped earlier impulse wave (3)).
AUDCAD Wave Analysis
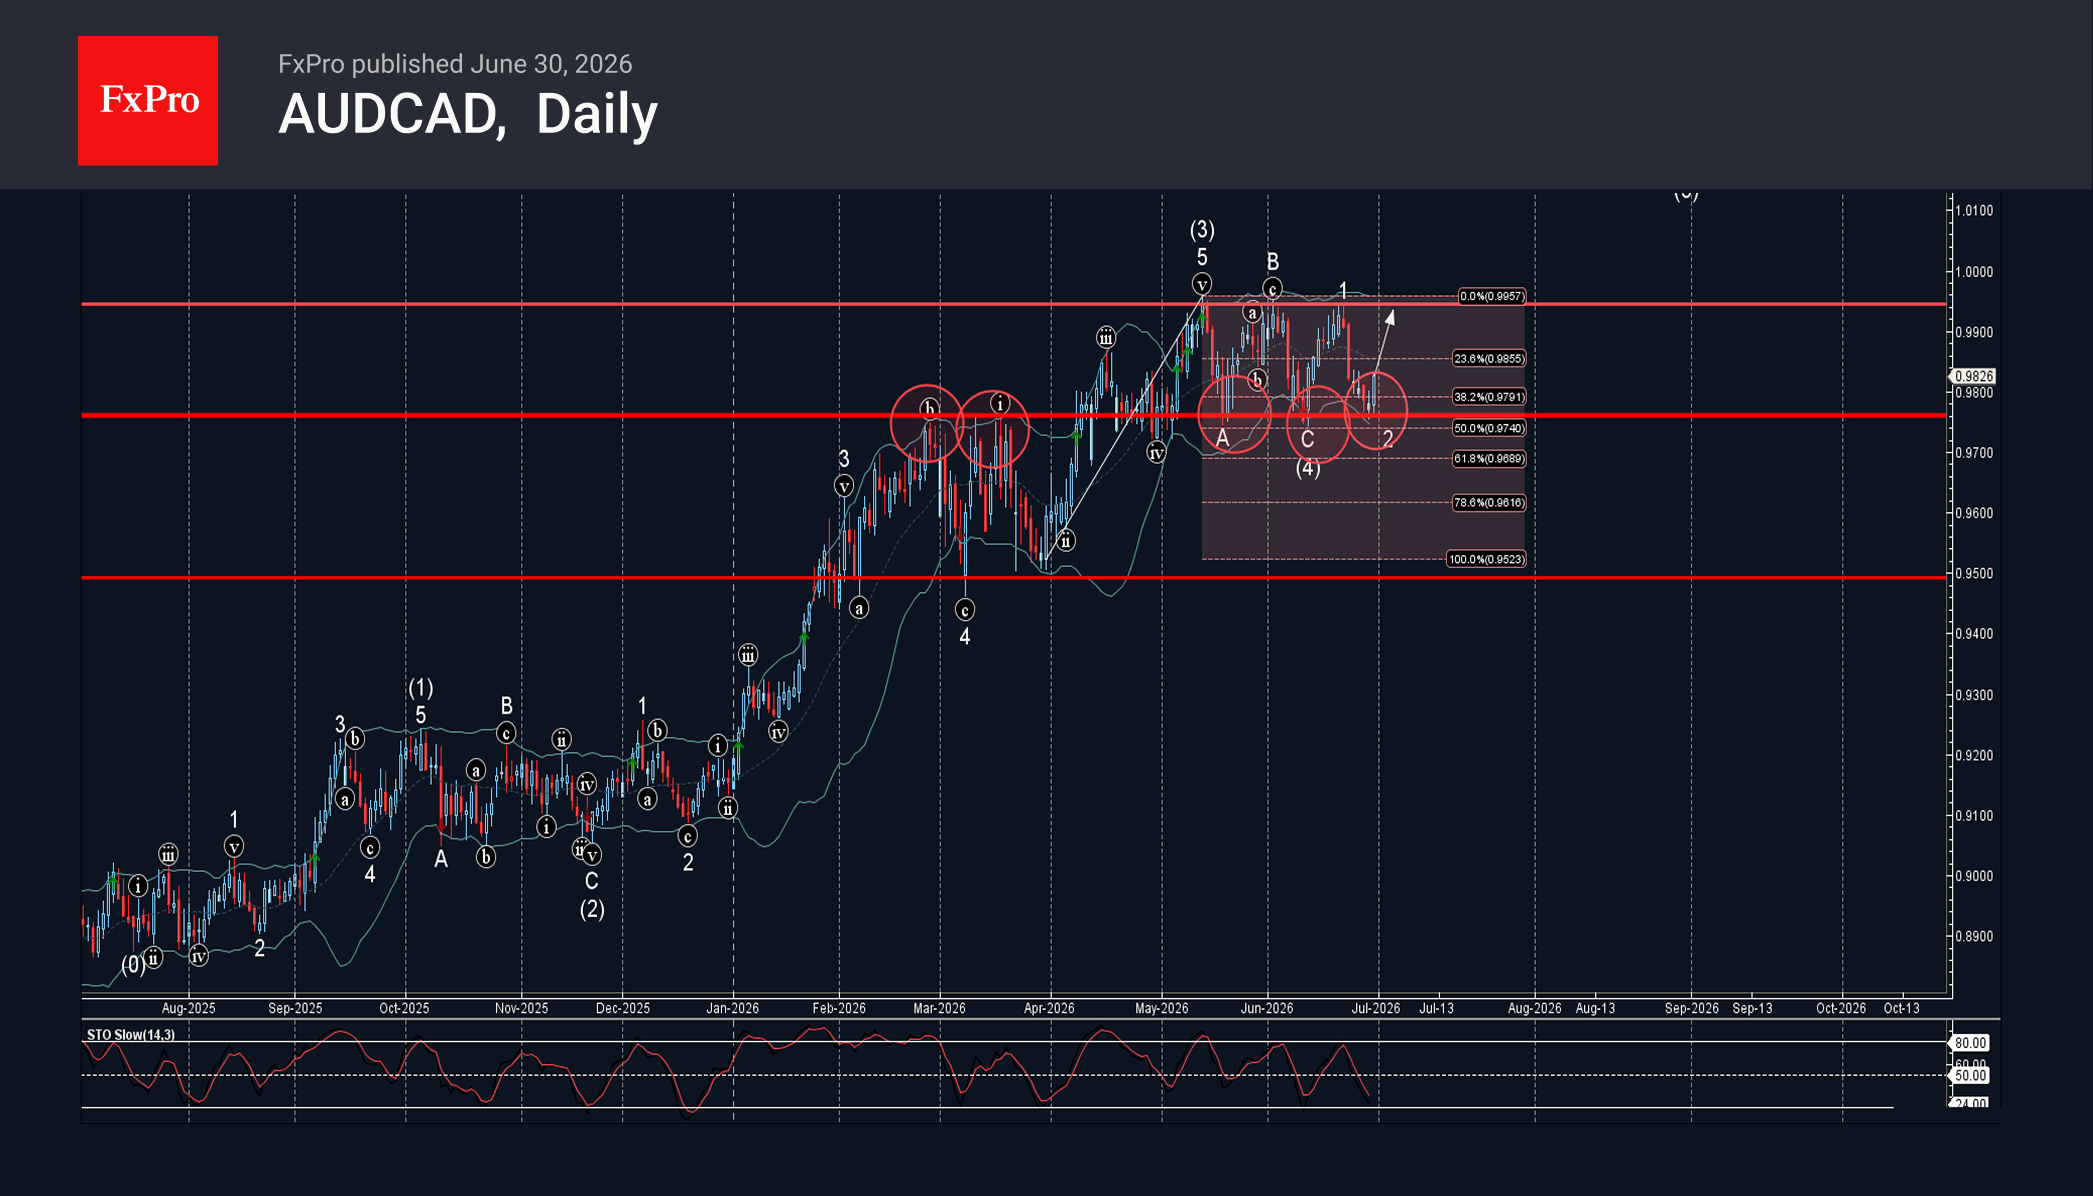
AUDCAD: ⬆️ Buy
– AUDCAD reversed from support area
– Likely to rise to resistance level 0.9945
AUDCAD currency pair earlier reversed from the support area between the support level 0.9760 (former strong resistance from February and March which has been reversing the price from the middle of May), 50% Fibonacci correction of the upward impulse from March and the lower daily Bollinger Band.
The upward reversal from this support area started the active short-term impulse wave 3, which belongs to the impulse wave (5) from June.
Given the clear daily uptrend, AUDCAD currency pair can be expected to rise to the next resistance level 0.9945 (that stopped earlier waves 3, B and 1).
Eco Data 7/1/26
| GMT | Ccy | Events | Act | Cons | Prev | Rev |
|---|---|---|---|---|---|---|
| 23:00 | AUD | Manufacturing PMI Jun F | 51.5 | 51.2 | 51.2 | |
| 23:50 | JPY | Tankan Manufacturing Index Q2 | 22 | 16 | 17 | |
| 23:50 | JPY | Tankan Non - Manufacturing Index Q2 | 37 | 35 | 36 | |
| 23:50 | JPY | Tankan Large All Industry Capex Q2 | 11.50% | 3.30% | ||
| 00:30 | JPY | Manufacturing PMI Jun F | 54.8 | 54.9 | 54.9 | |
| 01:30 | AUD | Building Permits M/M May | -1.10% | 0.20% | -3.40% | |
| 01:45 | CNY | RatingDog Manufacturing PMI Jun | 51.7 | 52 | 51.8 | |
| 05:00 | JPY | Consumer Confidence Index Jun | 33.8 | 34 | 33.6 | |
| 06:30 | CHF | Real Retail Sales Y/Y May | 3.50% | 0.80% | 1.60% | 1.70% |
| 07:30 | CHF | Manufacturing PMI Index Jun F | 54.3 | 56.3 | 57.3 | |
| 07:50 | EUR | France Manufacturing PMI Jun F | 51.2 | 50.7 | 50.7 | |
| 07:55 | EUR | Germany Manufacturing PMI Jun F | 50.3 | 50 | 50 | |
| 08:00 | EUR | Eurozone Manufacturing PMI Jun F | 51.4 | 51.3 | 51.3 | |
| 08:30 | GBP | Manufacturing PMI Jun F | 52.5 | 53.3 | 53.1 | |
| 09:00 | EUR | Eurozone CPI Y/Y Jun P | 2.80% | 3.00% | 3.20% | |
| 09:00 | EUR | Eurozone Core CPI Y/Y Jun P | 2.40% | 2.50% | 2.50% | 2.60% |
| 12:15 | USD | ADP Employment Change Jun | 98K | 118K | 122K | |
| 13:45 | USD | Manufacturing PMI Jun F | 53.9 | 55.7 | 55.7 | |
| 14:00 | USD | ISM Manufacturing PMI Jun | 53.3 | 54.2 | 54 | |
| 14:00 | USD | ISM Manufacturing Prices Paid Jun | 73 | 79 | 82.1 | |
| 14:00 | USD | ISM Manufacturing Employment Index Jun | 49.7 | 48.6 | ||
| 14:00 | USD | Construction Spending M/M May | 0.10% | 0.30% | 0.40% | |
| 14:30 | USD | Crude Oil Inventories (Jun 26) | -3.8M | -2.9M | -6.1M |
| 23:00 | AUD |
| Manufacturing PMI Jun F | |
| Actual | 51.5 |
| Consensus | 51.2 |
| Previous | 51.2 |
| 23:50 | JPY |
| Tankan Manufacturing Index Q2 | |
| Actual | 22 |
| Consensus | 16 |
| Previous | 17 |
| 23:50 | JPY |
| Tankan Non - Manufacturing Index Q2 | |
| Actual | 37 |
| Consensus | 35 |
| Previous | 36 |
| 23:50 | JPY |
| Tankan Large All Industry Capex Q2 | |
| Actual | 11.50% |
| Consensus | |
| Previous | 3.30% |
| 00:30 | JPY |
| Manufacturing PMI Jun F | |
| Actual | 54.8 |
| Consensus | 54.9 |
| Previous | 54.9 |
| 01:30 | AUD |
| Building Permits M/M May | |
| Actual | -1.10% |
| Consensus | 0.20% |
| Previous | -3.40% |
| 01:45 | CNY |
| RatingDog Manufacturing PMI Jun | |
| Actual | 51.7 |
| Consensus | 52 |
| Previous | 51.8 |
| 05:00 | JPY |
| Consumer Confidence Index Jun | |
| Actual | 33.8 |
| Consensus | 34 |
| Previous | 33.6 |
| 06:30 | CHF |
| Real Retail Sales Y/Y May | |
| Actual | 3.50% |
| Consensus | 0.80% |
| Previous | 1.60% |
| Revised | 1.70% |
| 07:30 | CHF |
| Manufacturing PMI Index Jun F | |
| Actual | 54.3 |
| Consensus | 56.3 |
| Previous | 57.3 |
| 07:50 | EUR |
| France Manufacturing PMI Jun F | |
| Actual | 51.2 |
| Consensus | 50.7 |
| Previous | 50.7 |
| 07:55 | EUR |
| Germany Manufacturing PMI Jun F | |
| Actual | 50.3 |
| Consensus | 50 |
| Previous | 50 |
| 08:00 | EUR |
| Eurozone Manufacturing PMI Jun F | |
| Actual | 51.4 |
| Consensus | 51.3 |
| Previous | 51.3 |
| 08:30 | GBP |
| Manufacturing PMI Jun F | |
| Actual | 52.5 |
| Consensus | 53.3 |
| Previous | 53.1 |
| 09:00 | EUR |
| Eurozone CPI Y/Y Jun P | |
| Actual | 2.80% |
| Consensus | 3.00% |
| Previous | 3.20% |
| 09:00 | EUR |
| Eurozone Core CPI Y/Y Jun P | |
| Actual | 2.40% |
| Consensus | 2.50% |
| Previous | 2.50% |
| Revised | 2.60% |
| 12:15 | USD |
| ADP Employment Change Jun | |
| Actual | 98K |
| Consensus | 118K |
| Previous | 122K |
| 13:45 | USD |
| Manufacturing PMI Jun F | |
| Actual | 53.9 |
| Consensus | 55.7 |
| Previous | 55.7 |
| 14:00 | USD |
| ISM Manufacturing PMI Jun | |
| Actual | 53.3 |
| Consensus | 54.2 |
| Previous | 54 |
| 14:00 | USD |
| ISM Manufacturing Prices Paid Jun | |
| Actual | 73 |
| Consensus | 79 |
| Previous | 82.1 |
| 14:00 | USD |
| ISM Manufacturing Employment Index Jun | |
| Actual | 49.7 |
| Consensus | |
| Previous | 48.6 |
| 14:00 | USD |
| Construction Spending M/M May | |
| Actual | 0.10% |
| Consensus | 0.30% |
| Previous | 0.40% |
| 14:30 | USD |
| Crude Oil Inventories (Jun 26) | |
| Actual | -3.8M |
| Consensus | -2.9M |
| Previous | -6.1M |
Will June Jobs Report and Warsh Appearance Challenge the Dollar’s Reign?
- US jobs market likely slowed in June, but World Cup may skew data.
- Warsh's first Sintra appearance will also be crucial for the US dollar.
- But after the June FOMC surprise, will hawkish expectations be matched?
- Warsh speaks on Wednesday (13:00 GMT), NFP is due a day early on Thursday (12:30 GMT).
A Barrage of Data and Central Bank Speak
A busy week is lined up for investors, as not only is the latest jobs report set to be released a day early due to markets being shut on Friday for Independence Day celebrations, but new Fed Chair Kevin Warsh speaks for only the second time since taking over the post. If that wasn't enough to keep traders glued to their desks, there's also a slew of other US data on the way that could shape expectations about the Fed policy path.
Heading into those risk events, investors are somewhat hawkishly positioned, pricing in just over three-thirds probability of a 25-basis-point rate hike in September, which represents a slight paring back from the near 100% odds in the immediate aftermath of the June policy decision. Nevertheless, markets have read Kevin Warsh's message loud and clear – taming inflation is the Fed's top priority right now and don't expect much in the way of forward guidance.
Deciphering the New Fed Chair
The latter has raised the chances of greater volatility in reaction to the incoming data, not only as investors scrutinize every economic indicator but also because of the lack of clarity about which data points the Fed will focus most on under the new regime. Wednesday's panel discussion in Sintra, Portugal, organized by the European Central Bank, presents an opportunity for Warsh to outline in more detail about how the Fed intends to bring inflation back to 2%.
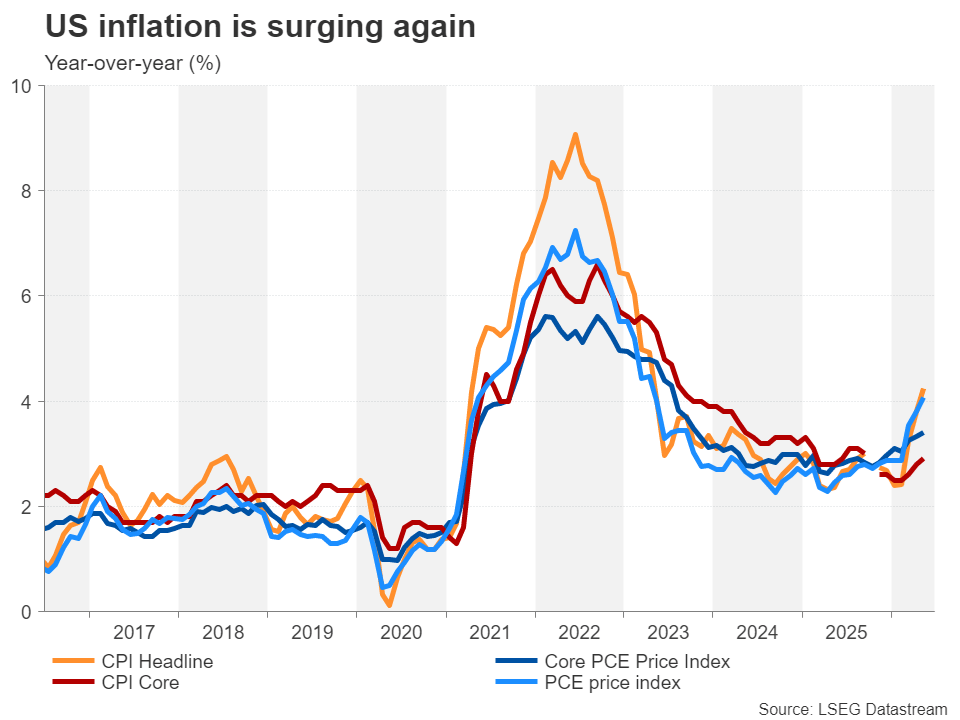
However, with other central bank heads also being invited to take part in the panel, namely, the Bank of England's Bailey and Bank of Canada's Macklem, together of course with President Lagarde, Warsh may not reveal much more about his views than he did at his post-meeting press conference two weeks ago. If anything, there's a risk Warsh may not come across as hawkish as he did on his FOMC debut, potentially echoing New York Fed President Williams' recent neutral stance on the direction of interest rates.
Is Another Hot NFP Report on the Cards?
Should that turn out to be the case, the adverse reaction to any upside surprises in Thursday's jobs report is likely to be more muted. Following May's better-than-expected print of 172k, forecasts for June nonfarm payrolls are for a more moderate gain of 110k. The unemployment rate is projected to have held steady at 4.3% for a fourth straight month. However, growth in average hourly earnings is expected to have quickened slightly to 3.5% y/y in June.
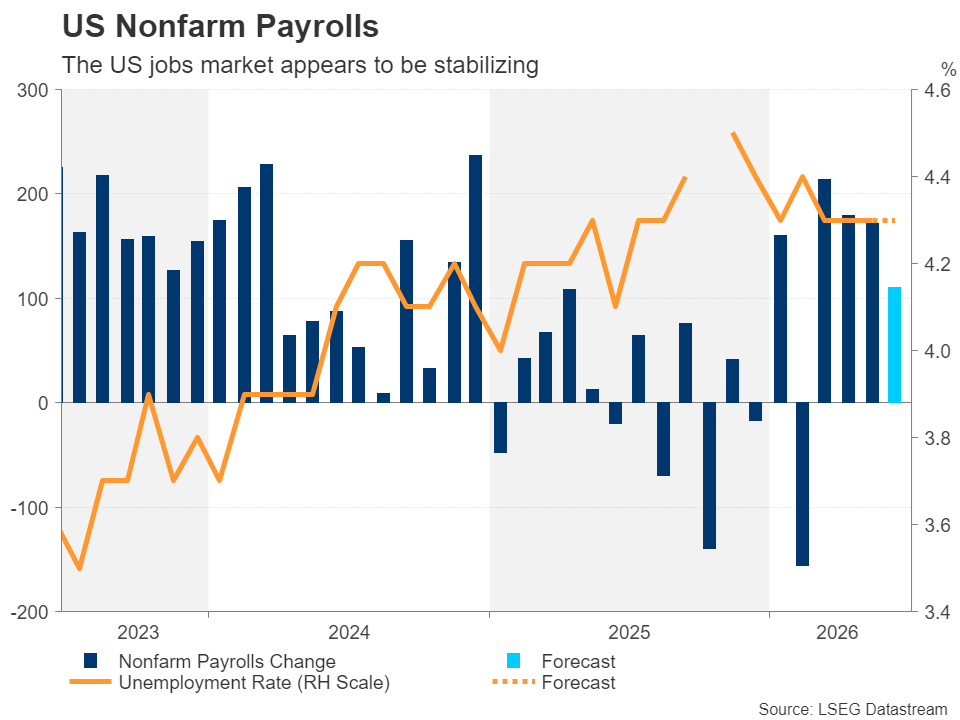
Another stronger-than-expected headline figure would further fuel bets of a September hike, or even sooner in July. This is certainly possible as lower energy prices due to the de-escalation in the Middle East and the boost to the economy from hosting the FIFA World Cup likely led to increased hiring in June.
Choppy Times Ahead for the Dollar
For the US dollar, however, it's going to be a tricky lead-up to Thursday's jobs release. Aside from the ECB forum and NFP data, traders will also have to juggle the consumer sentiment gauge for June and JOLTS job openings for May on Tuesday, as well as the ISM manufacturing PMI, ADP employment change and Challenger layoffs, all for June, on Wednesday.
In the meantime, any updates on talks between the US and Iran will also test dollar bulls, not to mention remarks from other central bankers at Sintra. In particular, the euro will be almost as much in the spotlight, as Lagarde may sound a bit more optimistic about the Eurozone inflation outlook now that oil prices are almost back to pre-war levels.
Is the Euro in Danger of Breaching $1.13?
Interestingly, the reduced geopolitical risks haven't been able to offset the boost to the dollar from the Fed's hawkish tilt. The euro hit one-year lows last week after tumbling below $1.1400. An upbeat set of labour market indicators out of the US would reinforce the hawkish expectations, triggering fresh selling towards $1.1300, which lies near the 123.6% Fibonacci extension of the March-April rebound.
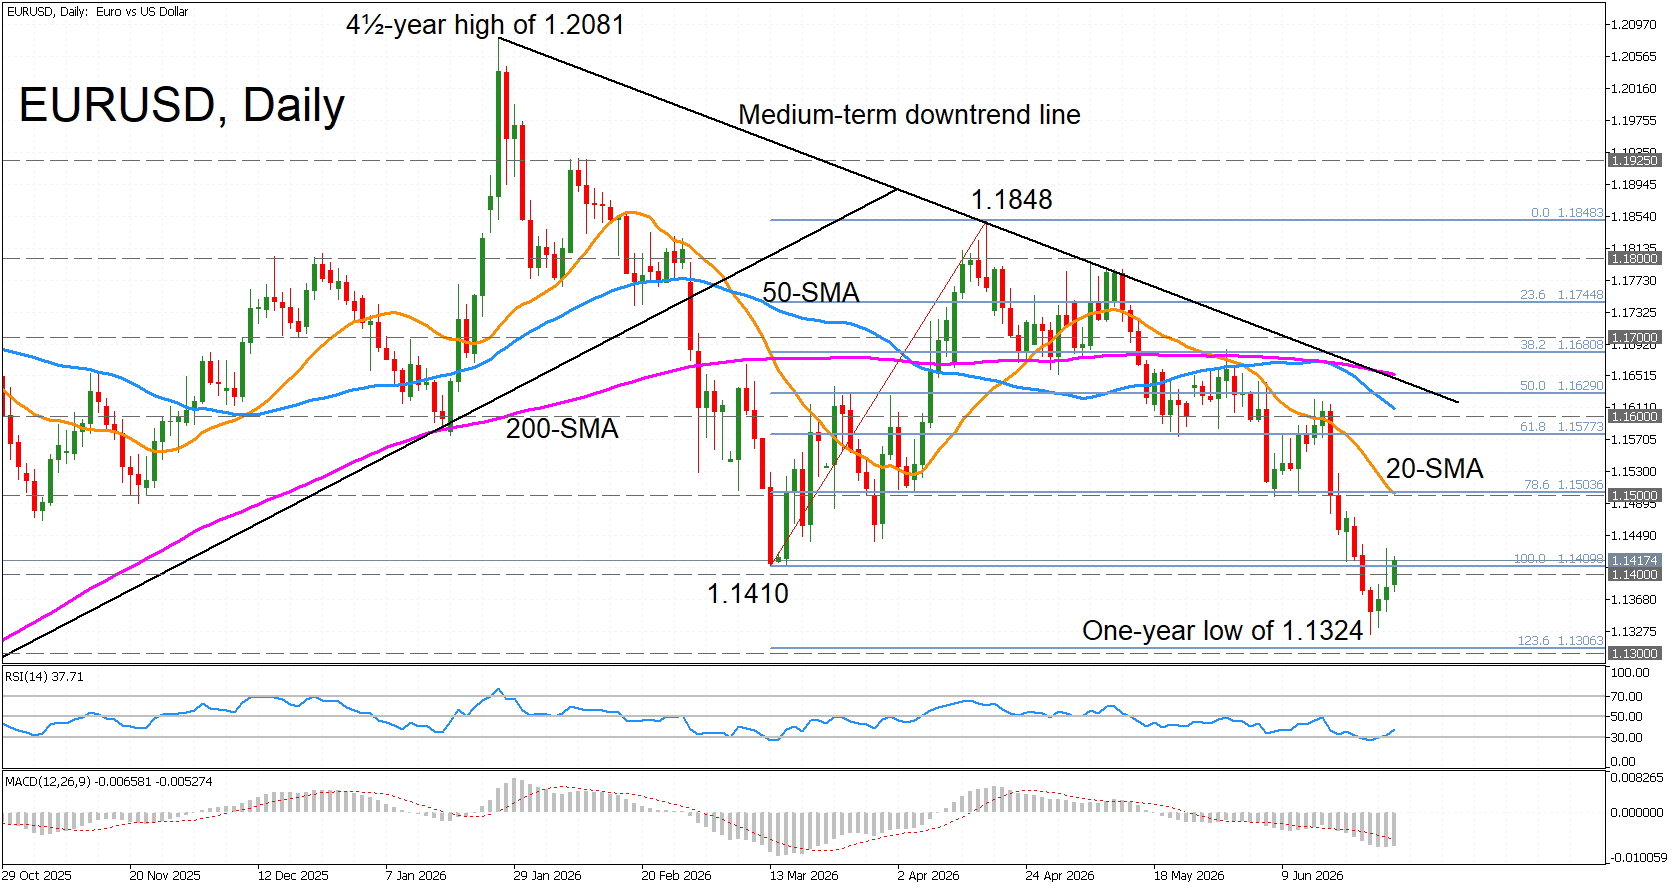
But soft NFP numbers combined with a much more neutral sounding Warsh could buoy the euro towards its 20-day moving average just above $1.1500.
Wall Street will also be keeping a close eye on Warsh's rhetoric and the payrolls numbers. The S&P 500's recent lower high suggests that the AI rally is cooling off. A hot jobs report would create a major hurdle for a new all-time high as it would likely cement a September rate hike.