
Sample Category Title
GBP/USD Daily Outlook
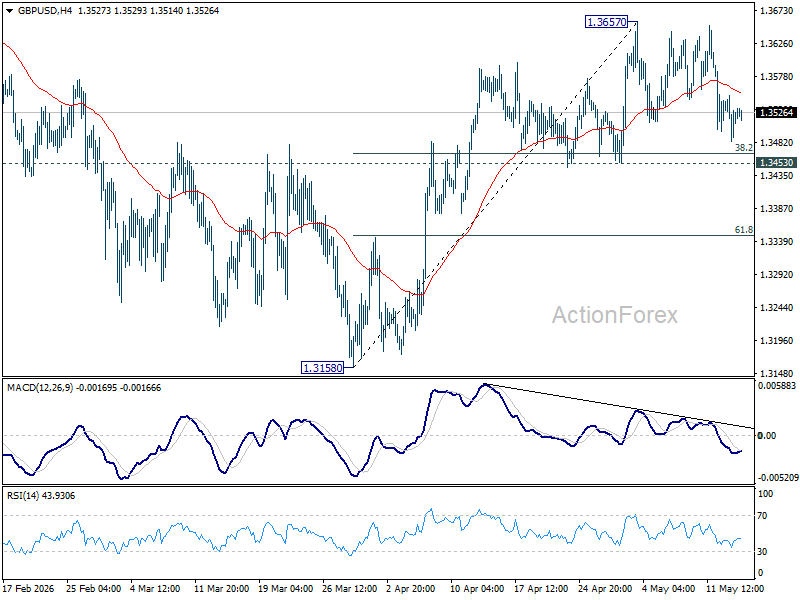
Daily Pivots: (S1) 1.3486; (P) 1.3518; (R1) 1.3553; More...
GBP/USD is still bounded in range trading below 1.3657 and intraday bias stays neutral. Further rally remains mildly in favor. On the upside, firm break of 1.3657 will resume the rally from 1.3158 to retest 1.3867 high. However, decisive break of 1.3453 will argue that the rebound has already completed, and turn bias to the downside for retesting 1.3158 instead.
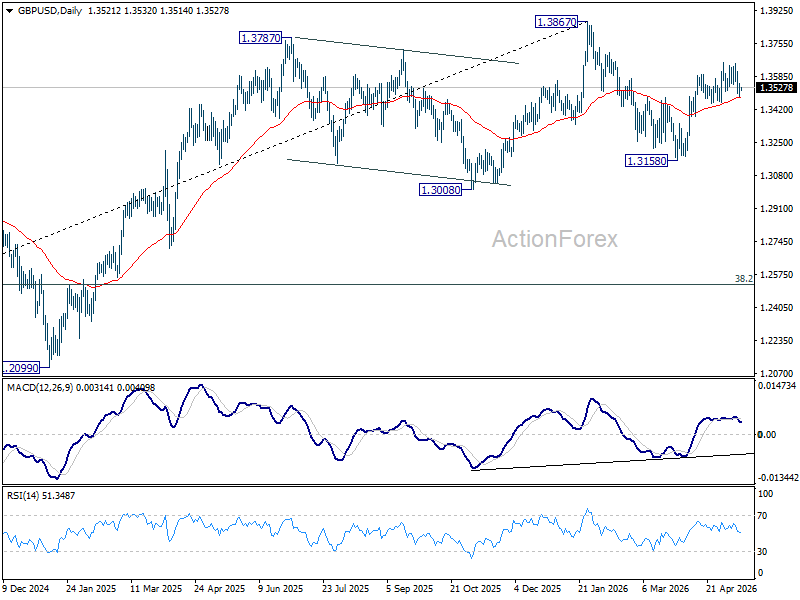
In the bigger picture, current development suggests that price actions from 1.3867 are merely a corrective pattern within the broader up trend from 1.0351 (2022 low). With 1.3008 support intact, medium term bullishness is maintained and break of 1.3867 is in favor for a later stage, towards 1.4248 key resistance (2021 high).
USD/CHF Daily Outlook
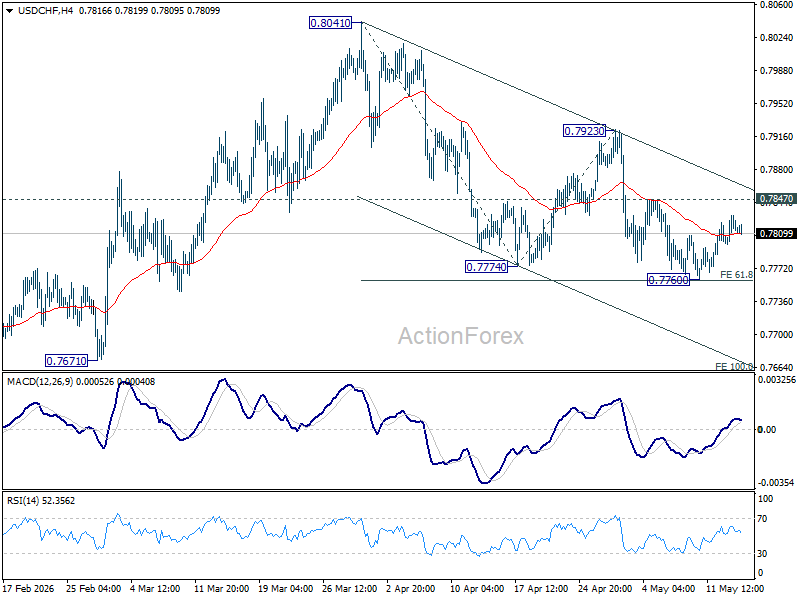
Daily Pivots: (S1) 0.7798; (P) 0.7814; (R1) 0.7831; More….
Intraday bias in USD/CHF stays neutral for the moment. With 0.7847 resistance intact, further decline is expected. On the downside, decisive break of 0.7760 will resume the whole decline form 0.8041, and target 100% projection of 0.8041 to 0.7774 from 0.7923 at 0.7656. However, firm break of 0.7847 resistance will indicate short term bottoming, and bring stronger rebound back to 0.7923 resistance.
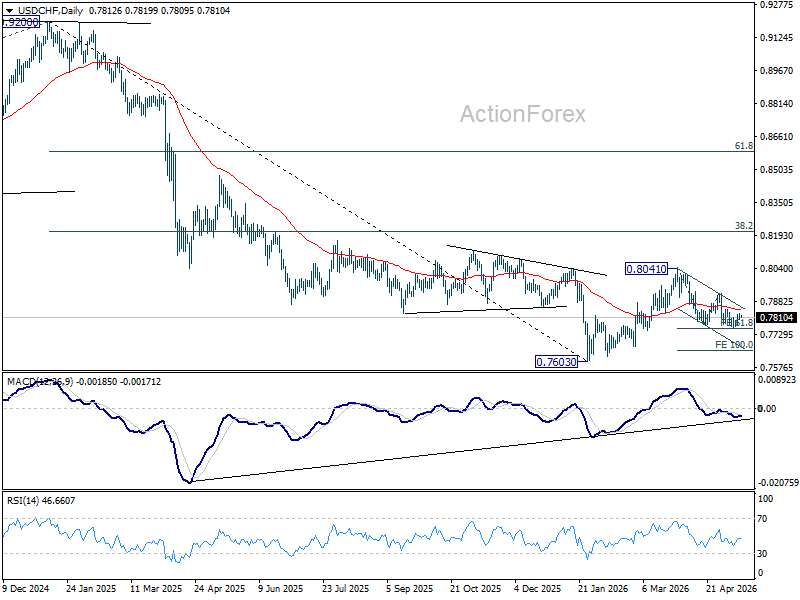
In the bigger picture, as long as 55 W EMA (now at 0.8051) holds, fall from 0.9200 is expected to continue, as part of the larger down trend. Firm break of 0.7603 will target 100% projection of 1.0146 (2022 high) to 0.8332 from 0.9200 at 0.7382.
AUD/USD Daily Report
Daily Pivots: (S1) 0.7233; (P) 0.7252; (R1) 0.7274; More...
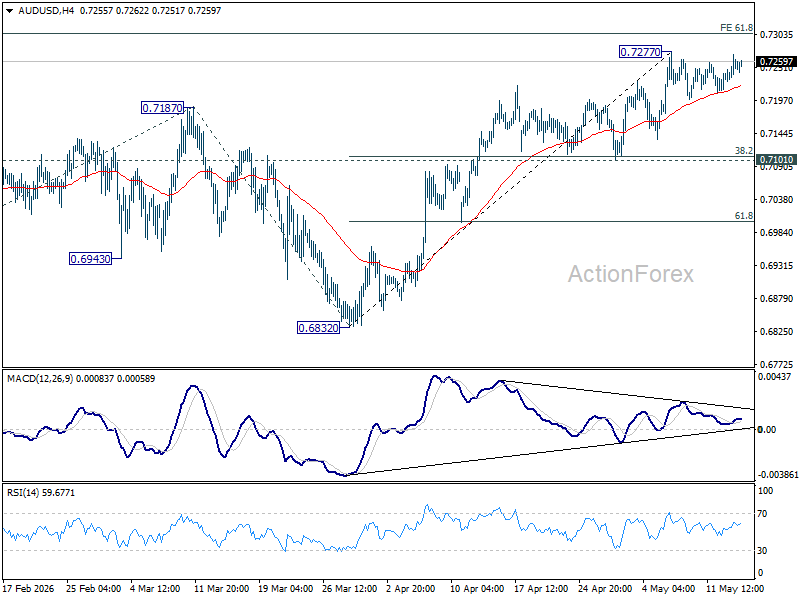
Intraday bias remains neutral for the moment. On the upside, firm break of 0.7277 will resume larger up trend and target 61.8% projection of 0.6420 to 0.7187 from 0.6832 at 0.7306. Outlook will stay bullish as long as 0.7101 support holds, in case of another dip.
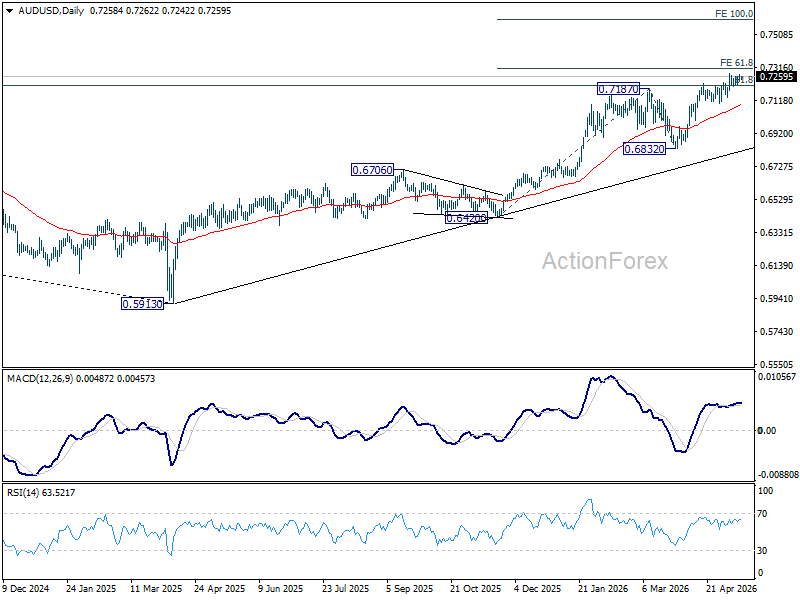
In the bigger picture, rise from 0.5913 (2024 low) is still in progress. Decisive break of 61.8% retracement of 0.8006 to 0.5913 at 0.7206 will solidify the case that it's already reversing the down trend from 0.8006 (2021 high). Further rally should then be seen to retest 0.8006. For now, outlook will remain bullish as long as 0.6832 support holds, in case of pullback.
USD/CAD Daily Outlook
Daily Pivots: (S1) 1.3686; (P) 1.3702; (R1) 1.3721; More...
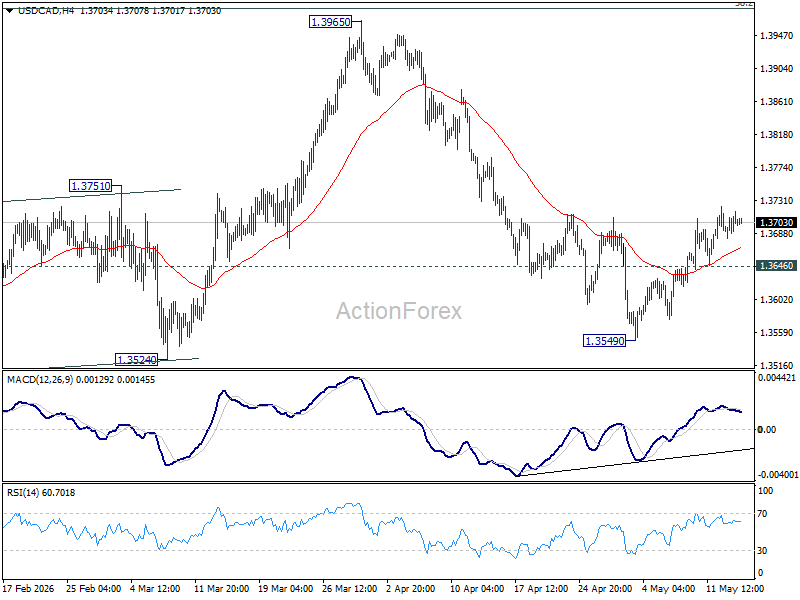
Intraday bias in USD/CAD remains mildly on the upside at this point. Rebound from 1.3549 is seen as the third leg of the corrective pattern from 1.3480. Further rise would be seen towards 1.3965 resistance. On the downside, though, break of 1.3646 minor support will bring retest of 1.3549 instead.
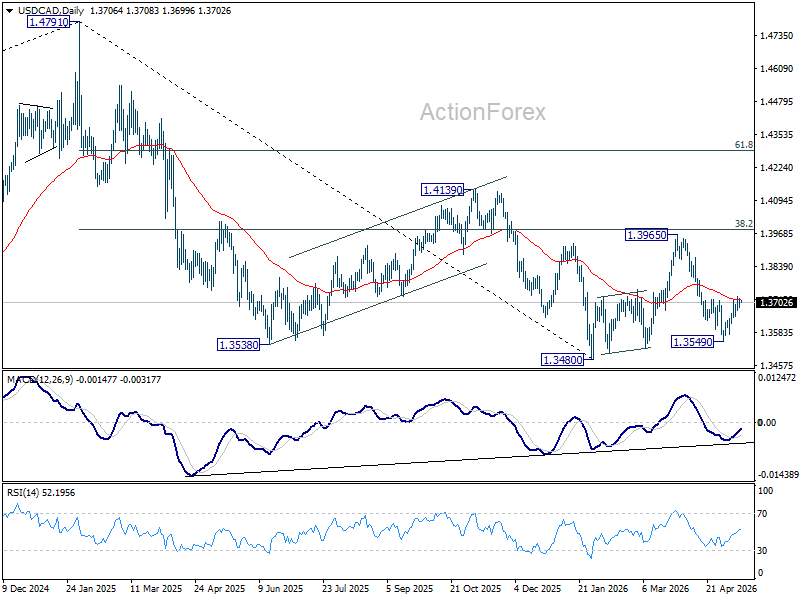
In the bigger picture, price actions from 1.4791 are seen as a corrective pattern to the whole up trend from 1.2005 (2021 low). Deeper fall could be seen, as the pattern extends, to 61.8% retracement of 1.2005 to 1.4791 at 1.3069. However, decisive break of 38.2% retracement of 1.4791 to 1.3480 at 1.3981 will argue that the correction has completed with three waves down to 1.3480 already.
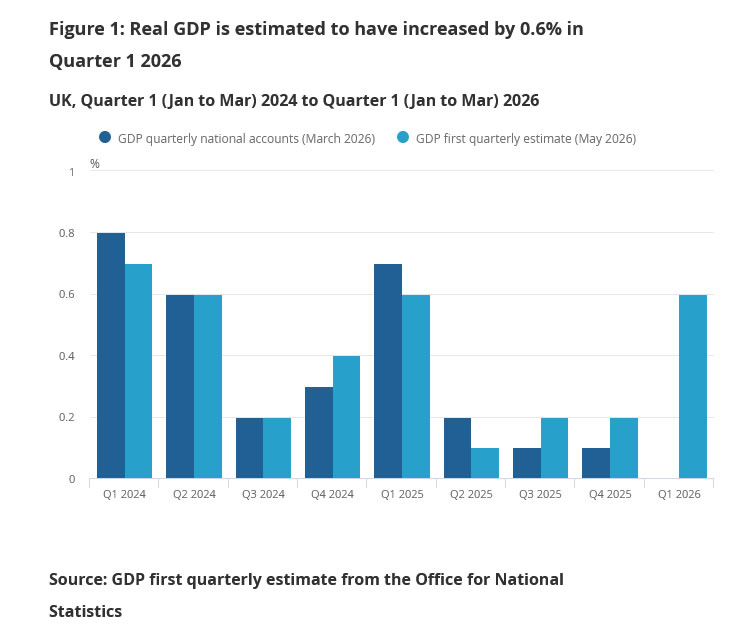
UK GDP Expands 0.6% in Q1, up 0.3% in March
UK economic growth held up better than expected in the first quarter of 2026, with GDP expanding 0.6% qoq in line with forecasts as stronger services activity helped offset softer industrial momentum. The figures suggest the economy entered the second quarter with more resilience than many investors had feared, despite elevated energy costs and rising political uncertainty surrounding Prime Minister Keir Starmer’s government.
Services remained the main engine of growth. Output in the sector increased 0.8% qoq following a 0.2% rise in the previous quarter and stood 1.4% higher than a year earlier. Production output also expanded by 0.2% qoq after a strong 1.3% gain in Quarter 4 2025, though annual production growth remained flat. Construction activity rose 0.4% qoq but was still -1.3% lower than the same period last year. Meanwhile, real GDP per head increased 0.6% qoq during the quarter and was up 0.9% yoy.
Monthly data for March surprised to the upside. UK GDP grew 0.3% mom versus expectations for a -0.1% mom contraction, following February’s 0.4% expansion. Services output rose 0.3% while construction surged 1.5%, offsetting a modest -0.2% decline in production activity.
The stronger-than-expected figures may provide some reassurance to policymakers that the UK economy retains underlying resilience even as higher energy prices, rising gilt yields, and domestic political instability continue clouding the broader outlook.
| Indicator | Previous | Latest | Expectation |
|---|---|---|---|
| UK GDP (Q1 QoQ) | 0.2% | 0.6% | 0.6% |
| Services Output | 0.8% | ||
| Production Output | 0.2% | ||
| Construction Output | 0.4% | ||
| Real GDP Per Head | 0.6% | ||
| UK GDP (March MoM) | 0.4% | 0.3% | -0.1% |
| Services Output | 0.3% | ||
| Construction Output | 1.5% | ||
| Production Output | -0.2% |
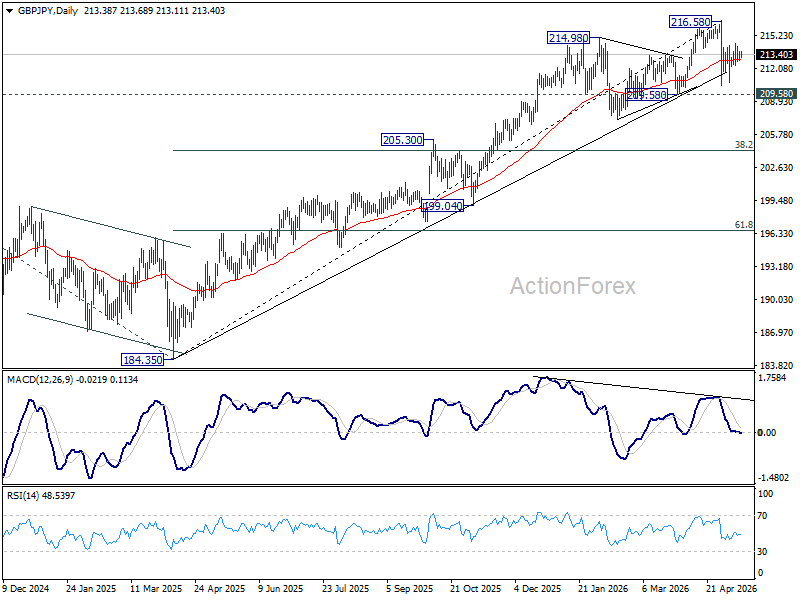
GBP/JPY Daily Outlook
Daily Pivots: (S1) 212.97; (P) 213.33; (R1) 213.79; More...
Intraday bias in GBP/JPY stays neutral and outlook is unchanged. On the downside, break of 212.35 minor support will bring deeper fall back to 210.43 support. On the upside, firm break of 214.40 will bring stronger rebound to retest 216.58 high.
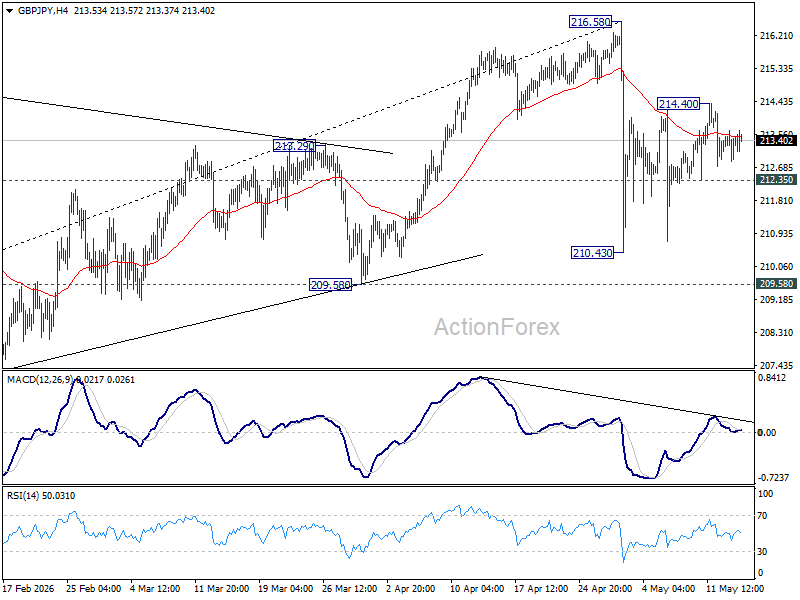
In the bigger picture, while the fall from 216.58 is steep, there is no clear sign of trend reversal yet. The long term up trend could still extend to 61.8% projection of 148.93 (2022 low) to 208.09 (2024 high) from 184.35 at 220.90 on resumption. However, sustained break of 55 W EMA (now at 205.75) will argue that it's already in medium term down trend for 184.35 support.
EUR/JPY Daily Outlook
Daily Pivots: (S1) 184.57; (P) 184.86; (R1) 185.10; More...
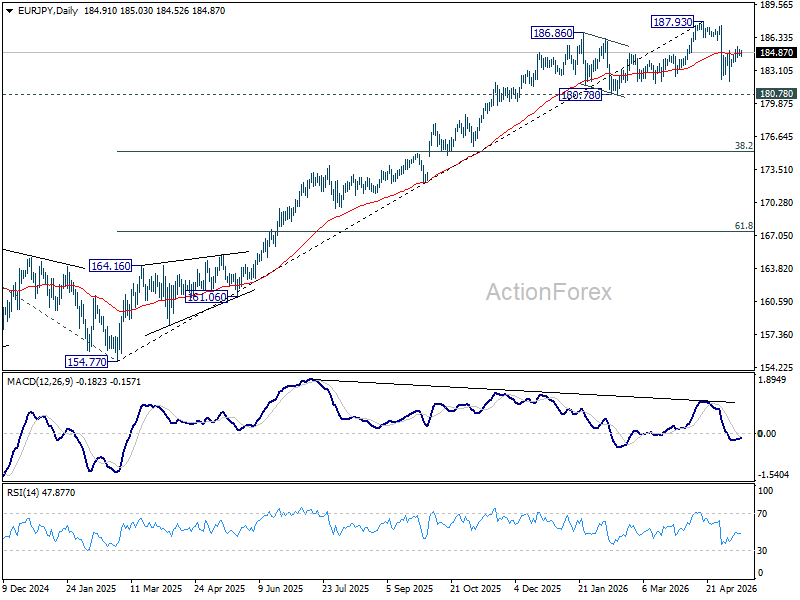
Intraday bias in EUR/JPY is turned neutral with current retreat. As noted before, pullback from 187.93 could have completed at 182.01 already. Further rise is in favor as long as 184.02 minor support holds. Above 185.44 will target a retest on 187.93 high. Nevertheless, break of 184.02 minor support will turn bias back to the downside towards 182.01 again.
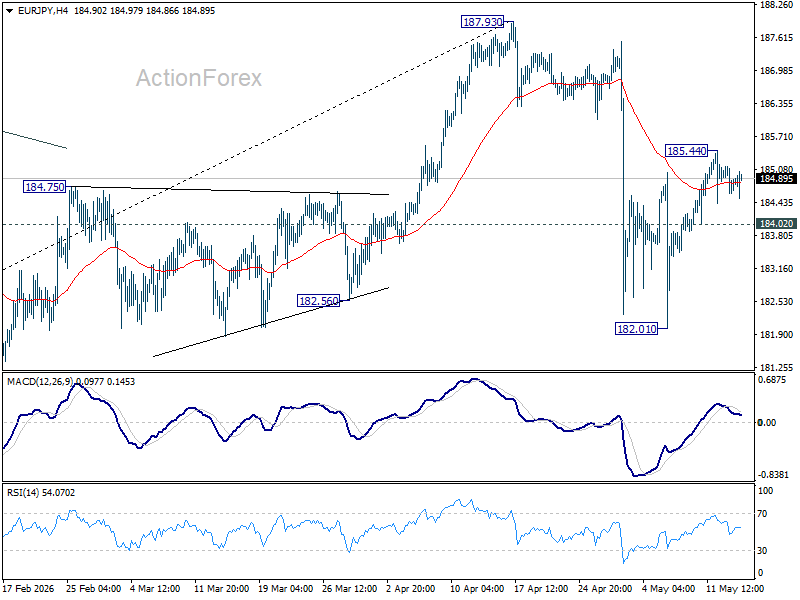
In the bigger picture, the pullback from 187.93 is steep, there is no sign of reversal yet. Uptrend from 114.42 is still expected to resume at a later stage to 78.6% projection of 124.37 (2022 low) to 175.41 (2025 high) from 154.77 at 194.88. However, sustained break of 55 W EMA (now at 178.04) will argue that it's already in a medium term down trend to 175.41 resistance turned support and below.
EUR/CHF Daily Outlook
Daily Pivots: (S1) 0.9148; (P) 0.9157; (R1) 0.9165; More....
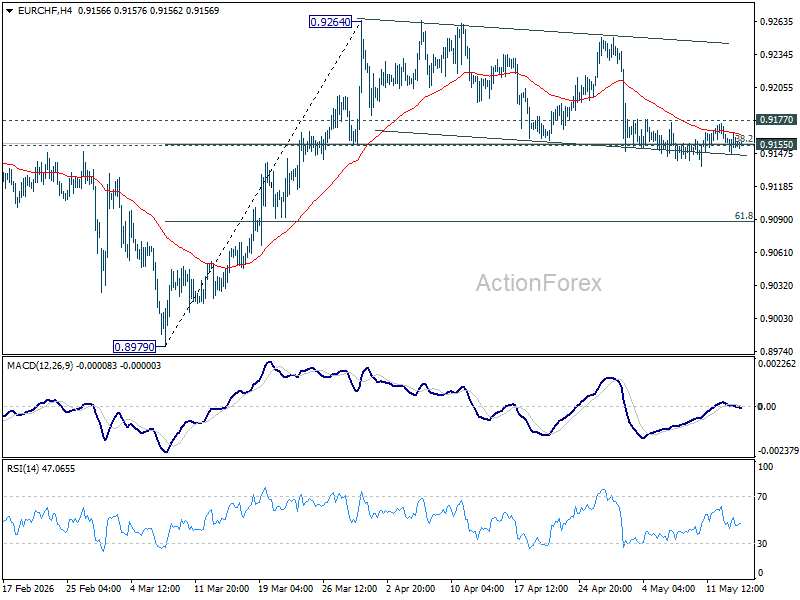
Intraday bias in EUR/CHF stays neutral for the moment. On the upside, break of 0.9177 minor resistance will turn bias back to the upside for 0.9264 resistance. However, sustained trading below 0.9155 cluster support (38.2% retracement of 0.8979 to 0.9264 at 0.9155) will turn bias back to the downside for deeper pullback to 61.8% retracement at 0.9088 and possibly below.
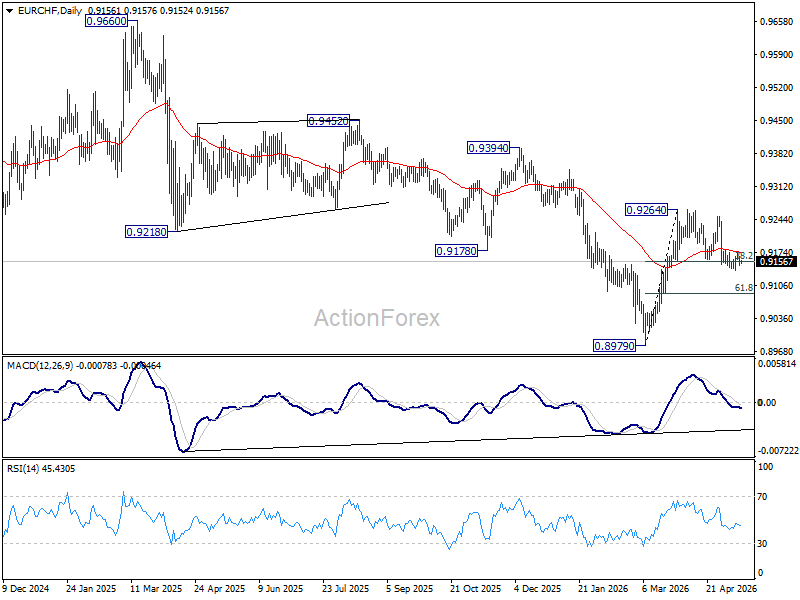
In the bigger picture, considering bullish convergence condition in W MACD, a medium term bottom should be in place at 0.8979. Sustained trading above 55 W EMA (now at 0.9241) will add more credence to this case. Further break of 0.9394 resistance will pave the way to 0.9660 resistance next. However rejection by the 55 W EMA will set up another fall through 0.8979 low at a later stage.
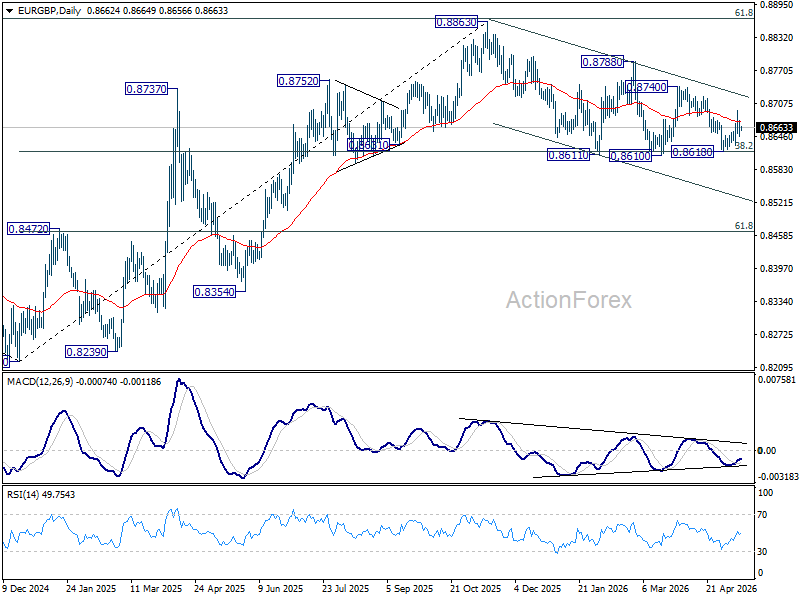
EUR/GBP Daily Outlook
Daily Pivots: (S1) 0.8641; (P) 0.8669; (R1) 0.8695; More…
Intraday bias in EUR/GBP remains neutral for the moment. Risk will stay on the upside as long as 0.8618 support holds. Break of 0.8695 will resume the rebound from 0.8618 to 0.8740 resistance. Decisive break there should pave the way through 0.8788 to retest 0.8863 high.
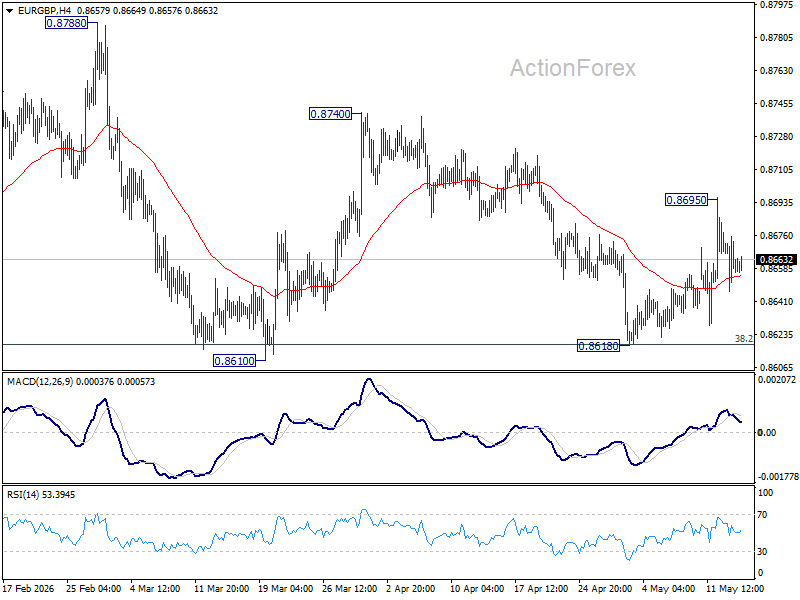
In the bigger picture, focus is back on 38.2% retracement of 0.8821 to 0.8863 at 0.8618. Strong rebound from there will retain medium term bullishness. Rise from 0.8221 should resume through 0.8863 at a later stage. Nevertheless, sustained break of 0.8618 will confirm that whole rise from 0.8221 has completed at 0.8863. Deeper decline should then be seen to 61.8% retracement at 0.8466 at least.
Trump-Xi Summit 2026: Key Expectations and What Markets Are Watching
Key Takeaways
- The 2026 Trump-Xi summit is viewed as a critical geopolitical event for financial markets, with investors primarily seeking signs of stabilisation in US-China trade relations, technology restrictions, and broader geopolitical tensions.
- Markets are focused on potential progress in semiconductor export controls, AI technology access, Taiwan-related communication channels, and currency stability, as even modest diplomatic improvements could support risk assets and Asian equities.
- The most likely market outcome remains a limited “managed competition” framework rather than a comprehensive trade deal, which could trigger only a temporary relief rally before markets refocus on inflation, oil prices, and Federal Reserve policy risks.
Today’s two-day meeting between Donald Trump and Xi Jinping in Beijing is shaping up to be one of the most consequential geopolitical events for global markets in 2026.
The summit comes at a time of heightened tensions driven by trade frictions, technology restrictions, Taiwan-related security concerns, and the inflation shock stemming from the Iran conflict.
Key Expectations from the Trump-Xi Summit
Temporary Trade Stabilisation Rather Than a Full Deal
Markets are likely expecting a de-escalation framework instead of a comprehensive trade agreement. Possible outcomes include:
- Partial tariff rollbacks or suspension of new tariffs.
- Agreements to resume high-level economic dialogue.
- China pledges increased purchases of US agricultural, energy, or industrial goods.
- Reduced rhetoric on export controls and sanctions.
A broad structural trade deal remains unlikely due to strategic rivalry between the two powers.
Supply Chain and Technology Negotiations
Technology remains the core battleground. Investors will focus on:
- Potential easing or delay of US semiconductor export restrictions, including possible easing of controls on Nvidia's H200 AI chips to China.
- Negotiations surrounding AI chips, rare earths, EV batteries, and critical minerals.
- Whether China receives any concessions on access to advanced technology.
Any softening stance could trigger strong rallies in Asian tech equities and semiconductor-linked stocks.
Taiwan and Security Communication Channels
A key objective may simply be reducing geopolitical tail risks:
- Re-establishment of military communication hotlines.
- Commitments to avoid escalation around the Taiwan Strait.
- Diplomatic language aimed at reducing accidental military confrontation.
Even symbolic cooperation would likely be viewed positively by risk assets.
Currency and Financial Market Stability
Given recent USD volatility and concerns over inflation:
- China may resist sharp yuan depreciation, with the offshore CNH continuing to strengthen in the past week and approaching a 3-year high of 6.7740 per USD.
- The US may seek commitments against competitive devaluation.
- Both sides could emphasize financial stability to calm bond and FX markets.
This would matter significantly for Asian FX, emerging markets, and global risk sentiment.
Possible Market Reactions
- Positive scenario, most market-friendly: Limited trade truce with improved diplomatic tone may trigger a rally in equities, Asian exporters, semiconductors, and cyclical assets.
- Neutral scenario, most likely: Constructive dialogue, but few concrete deliverables may lead to a short-term relief rally followed by renewed focus on inflation and rates.
- Negative scenario, least likely: Breakdown in talks or aggressive rhetoric on tariffs/Taiwan sees a risk-off move into USD, gold, Treasuries, and defensive sectors.