

Sample Category Title
EUR/AUD Daily Outlook
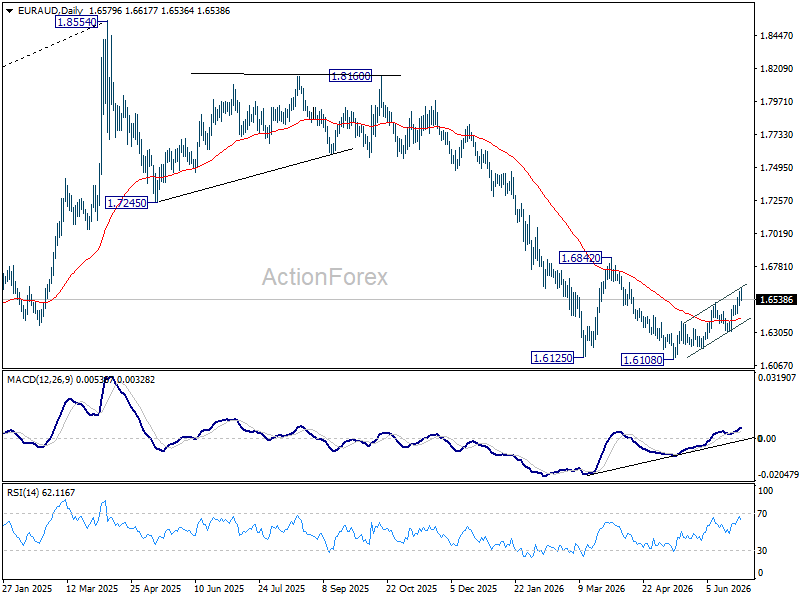
Intraday bias in EUR/AUD remains on the upside, and rise from 1.6108 should target 100% projection of 1.6186 to 1.6516 from 1.6306 at 1.6636 next. On the downside, below 1.6512 minor support will turn intraday bias neutral. But further rise will remain mildly in favor as long as 1.6306 support holds, in case of retreat.
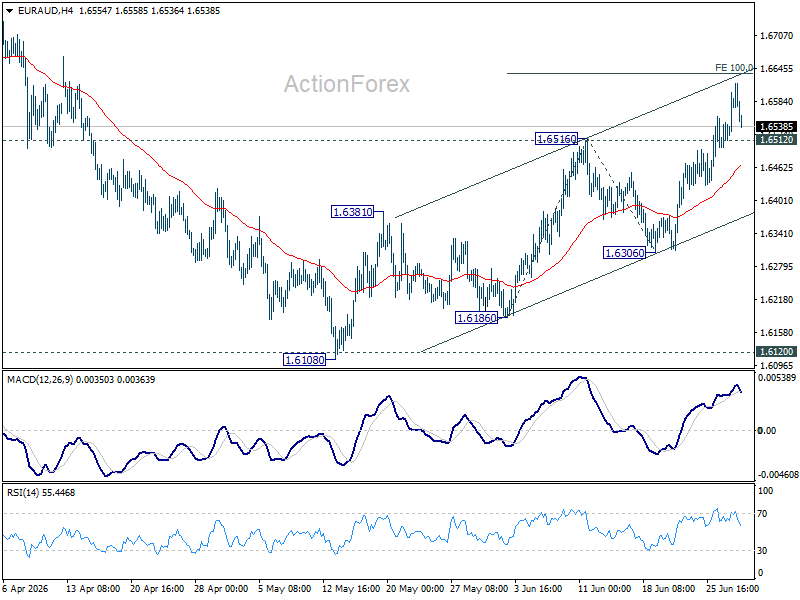
In the bigger picture, outlook will stay bearish as long as 1.6842 resistance holds. Fall from 1.8554 (2025 high) is expected to continue to 61.8% retracement of 1.4281 to 1.8554 at 1.5913. Decisive break there will pave the way back to 1.4281 (2022 low). However, firm break of 1.6842 should confirm medium term bottoming, and bring stronger rally.
EUR/CHF Daily Outlook
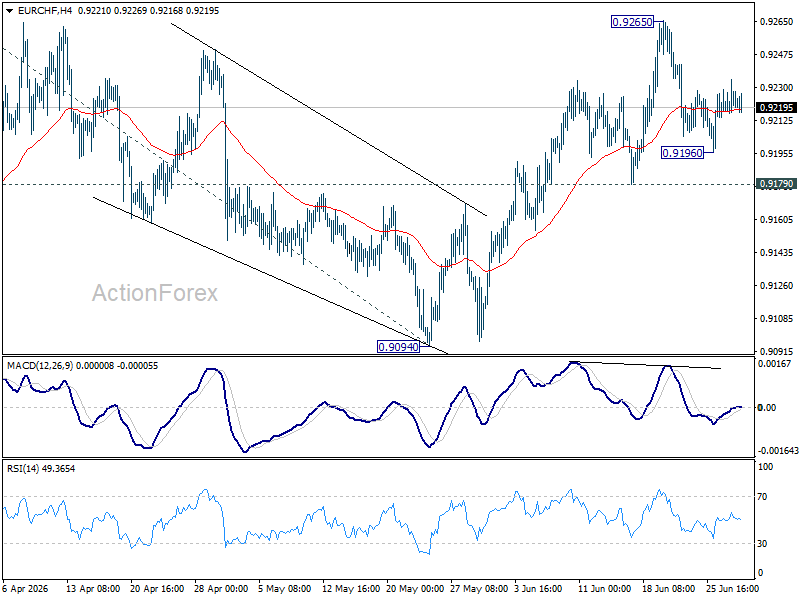
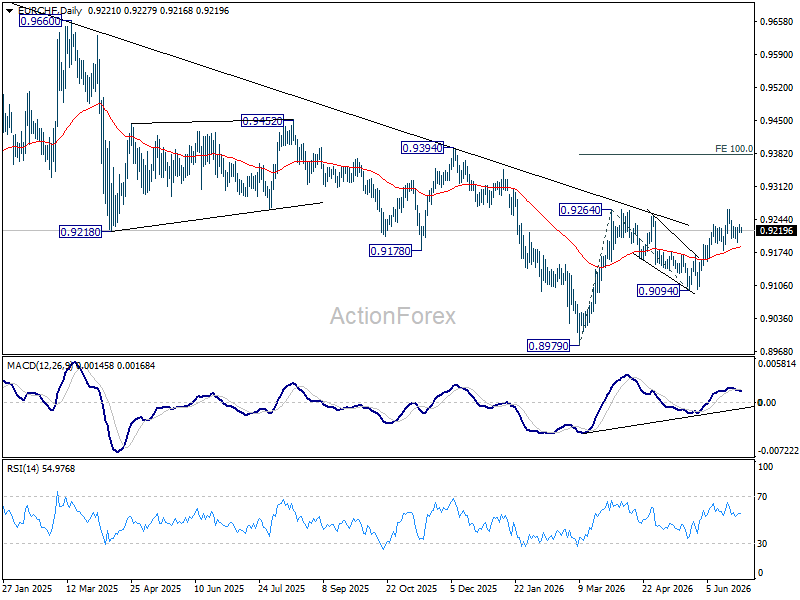
EUR/CHF's consolidation from 0.9265 is still extending, and intraday bias remains neutral. Further rally is expected as long as 0.9179 support holds. On the upside,firm break of 0.9264/5 will resume the rally from 0.8979 to 100% projection of 0.8979 to 0.9264 from 0.9094 at 0.9379.
In the bigger picture, the break of medium term falling trend line resistance indicates that 0.8979 is already a medium term bottom. Considering bullish convergence condition in W MACD, rise from there should at least be reversing the fall from 0.9928, with prospect of developing into a medium term up trend. Firm break of 0.9394 resistance will add more credence to this case. For now risk will remain on the upside as long as 0.9094 support holds, in case of retreat.
Gold: Heading for $3,600?
- Easing concerns over the Fed’s independence have bolstered the Dollar.
- Fears of high interest rates are weighing on gold.
The US dollar rose after a three-day decline, thanks to growing investor confidence in the Fed’s independence, anticipation of Kevin Warsh’s speech in Sintra, Portugal, and the realisation that the situation in the Middle East must be taken seriously. The US is attempting to de-escalate the conflict and has announced talks, but Iran insists on maintaining control over the Strait of Hormuz. The positions of the two sides remain far apart, heightening geopolitical risks and boosting demand for the greenback as a safe-haven asset.
The US dollar received a boost from the Supreme Court’s ruling that Donald Trump cannot dismiss Lisa Cook from her post at the Fed. Had the situation been different, the White House would have filled the Committee with doves and pushed for a rate cut. Such a scenario would have put pressure on the US dollar due to fears that the Fed might lose its independence. Now that this threat has been removed, it is having a positive impact on the USD index.
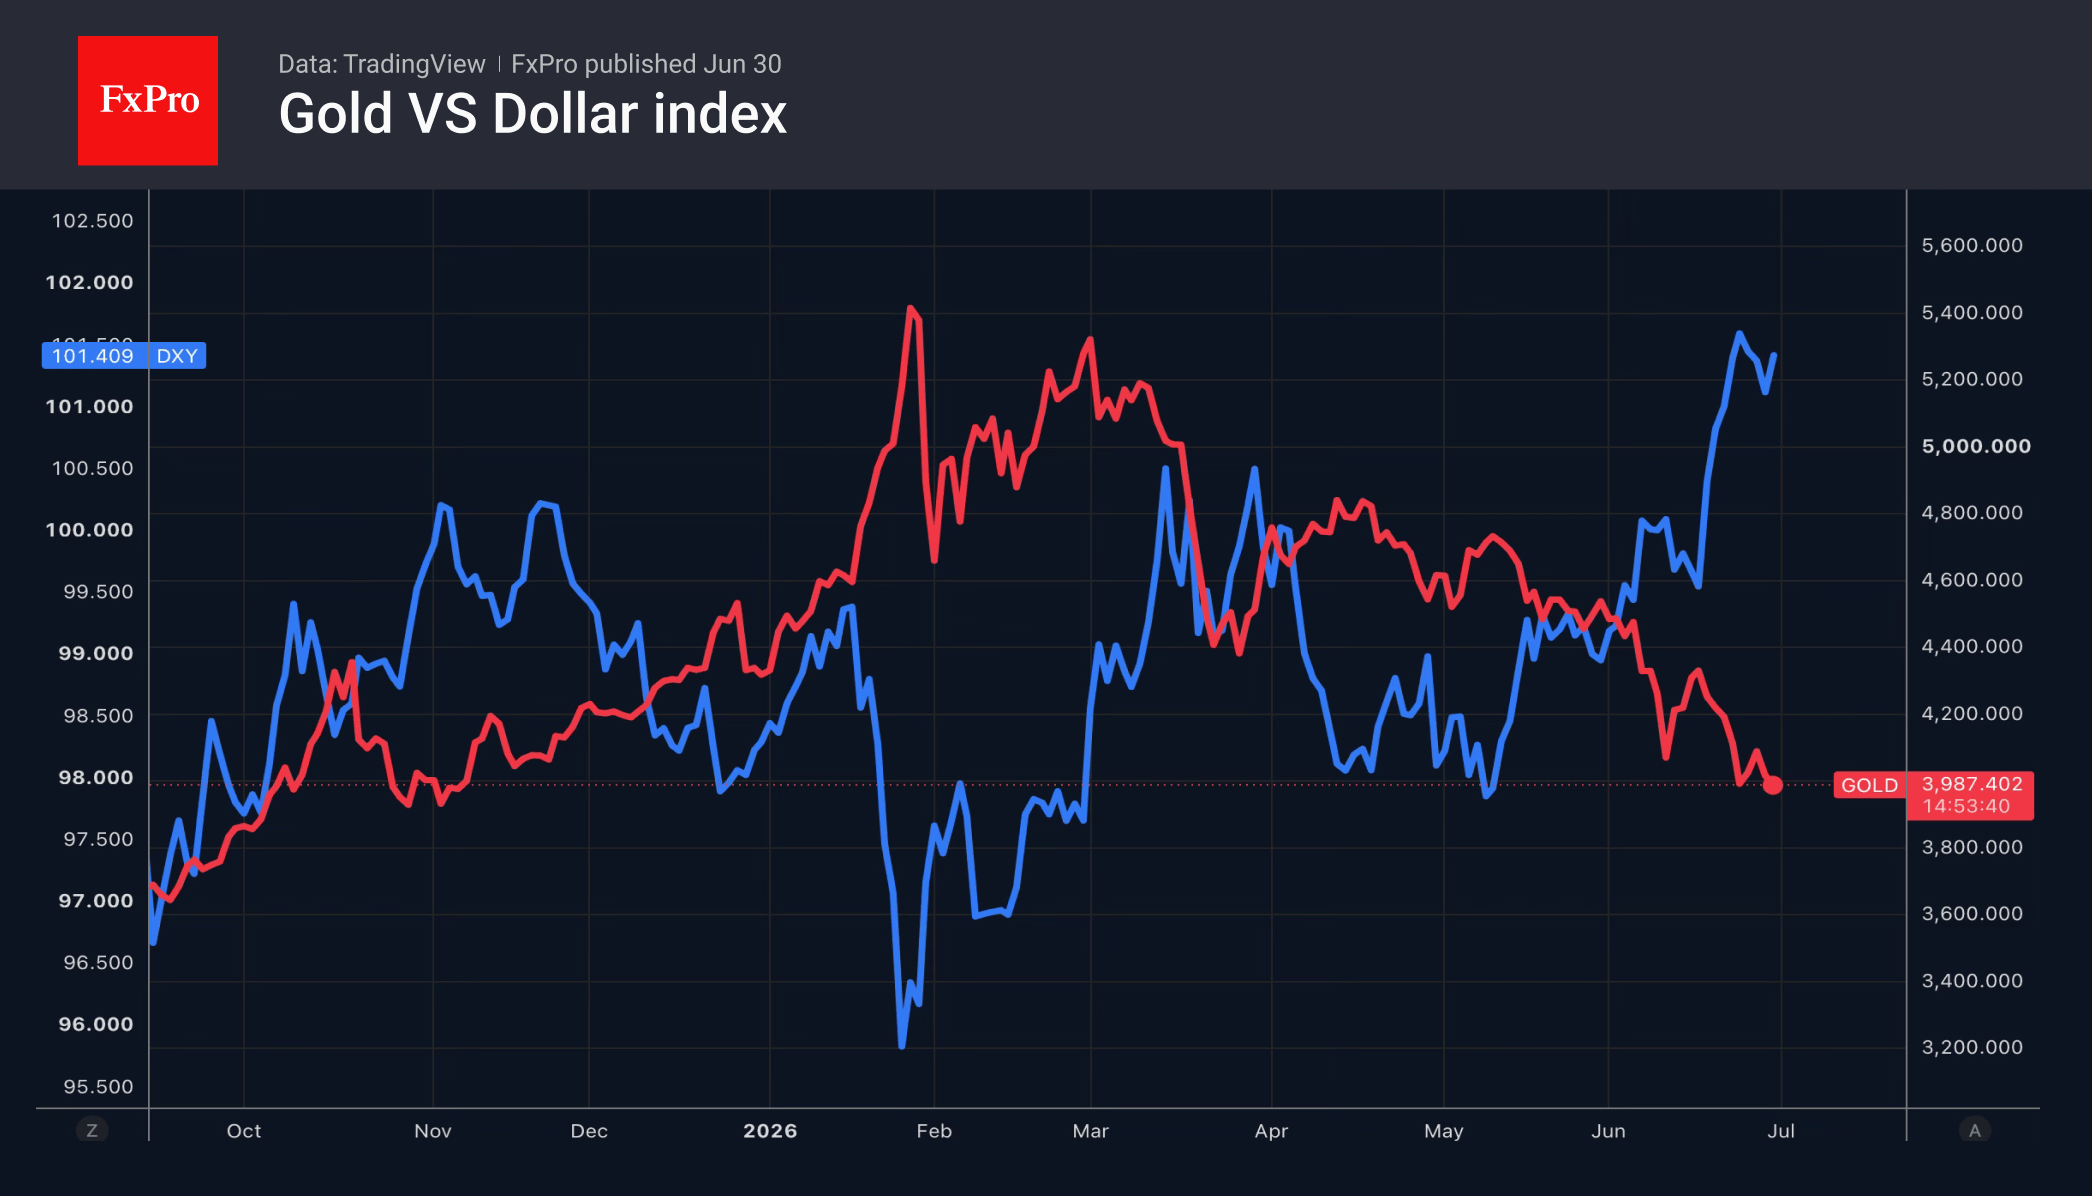
The strengthening of the US dollar has created headwinds for gold, pushing it back below $4,000 per ounce. While the fall in oil prices is reducing inflationary risks, the market remains fixated on the possibility of a Fed rate hike and a stronger dollar.
Precious metals have seen a brief resurgence amid a reduced likelihood of monetary tightening. The probability of monetary tightening in September has fallen over the past week from over 70% to 62%, whilst the likelihood of two federal funds rate hikes in 2026 has dropped from 50% to 38%. Nevertheless, investors’ attention is focused more on the persistence of relatively high interest rates, causing non-yielding gold to lose ground.
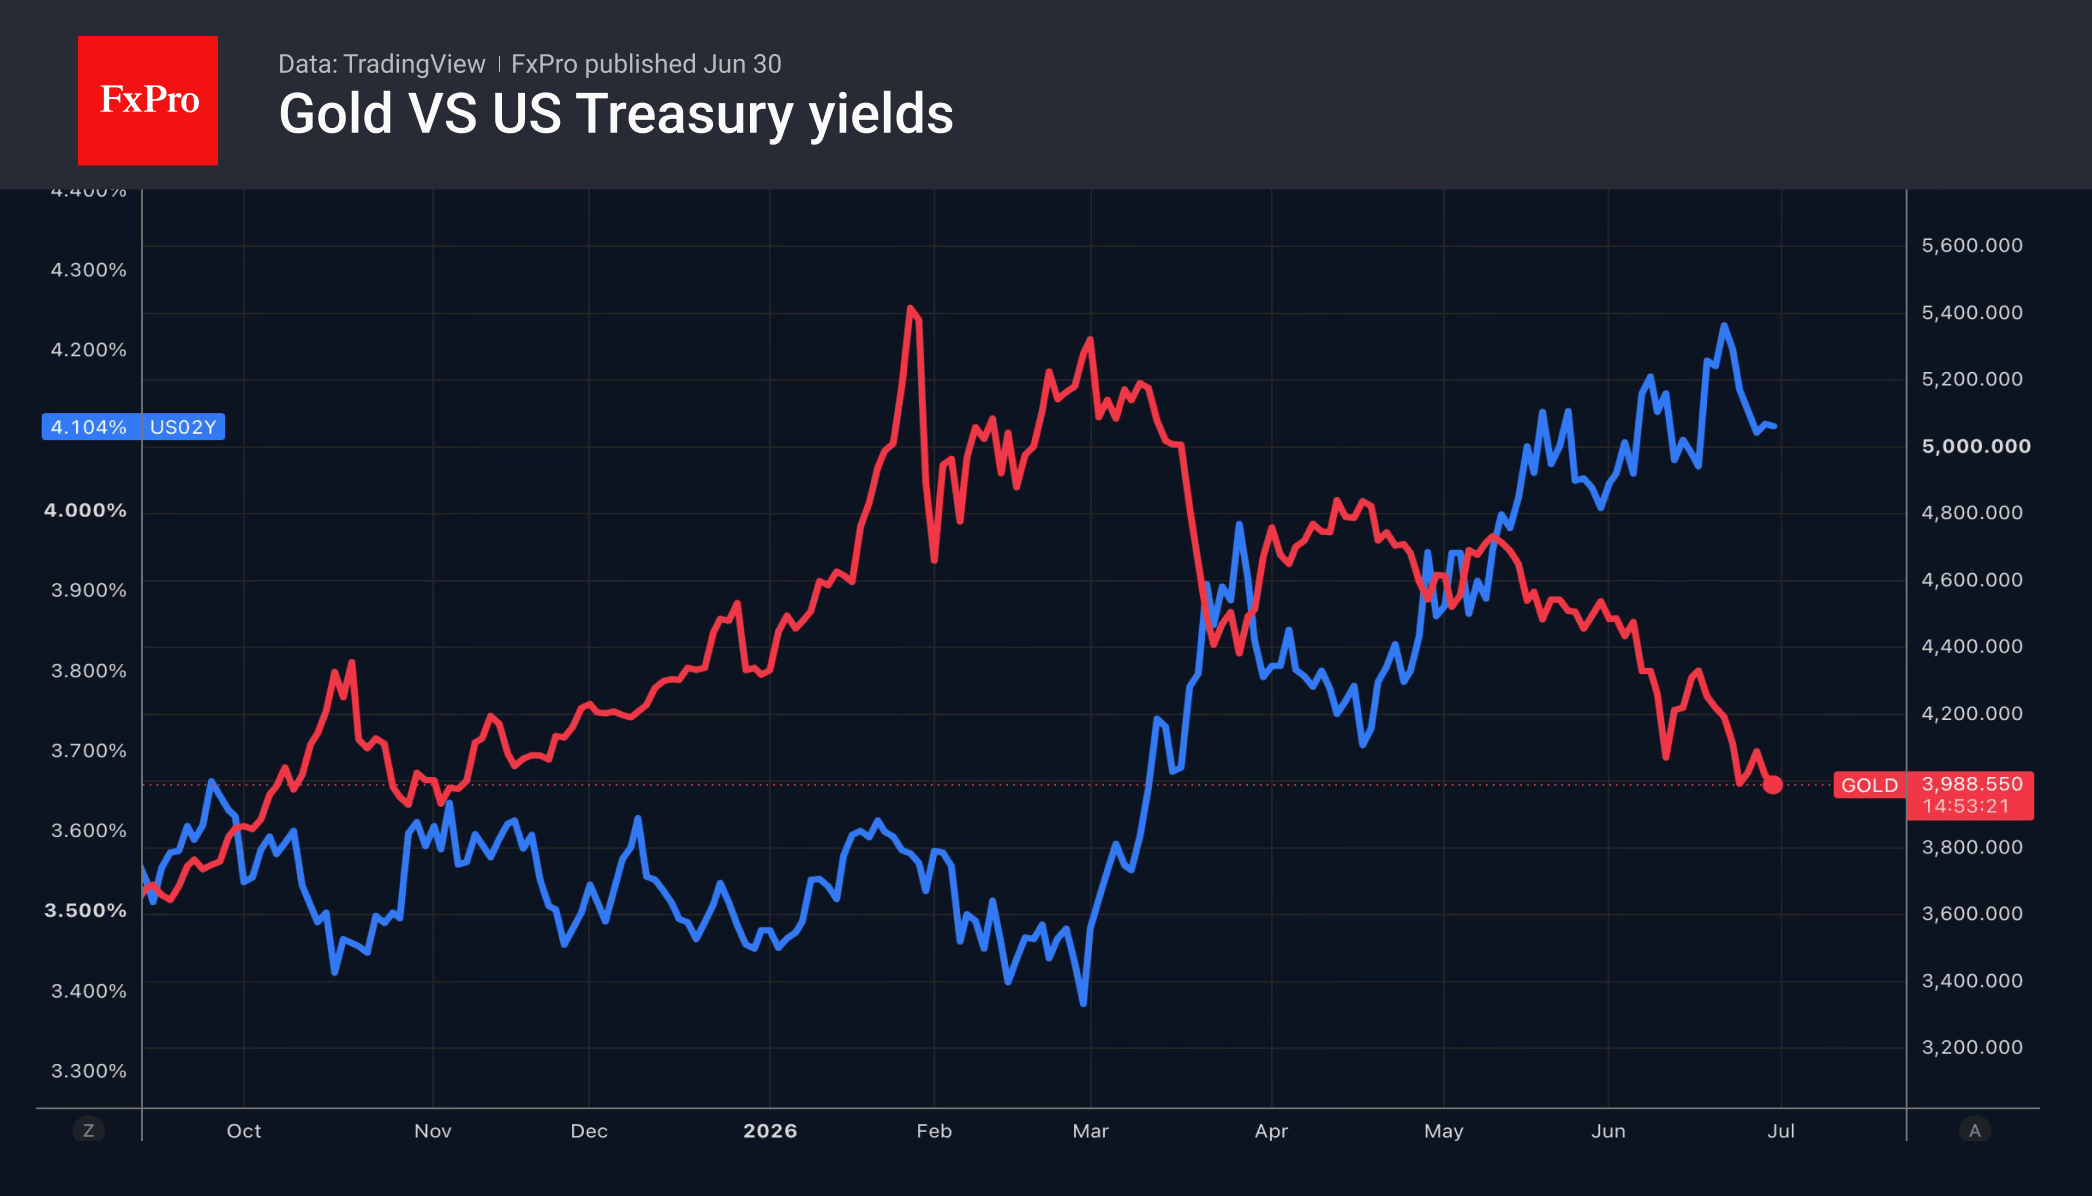
The high yields on Treasuries are being sustained by Warsh’s emphasis on the Fed talking less and acting more. The new chair wants the markets to signal to the central bank where rates should be, rather than the central bank dictating to the markets. The Fed’s shift from verbosity to reticence is heightening uncertainty and allowing investors to demand a higher risk premium. This is reflected in debt market rates and the dynamics of Gold.
The bulls believe that gold will prove more resilient to headwinds. The bears are counting on it falling further towards $3,600 before buying interest returns.
The FxPro Analyst Team
Is Bitcoin Set to Move Lower?
Market Overview
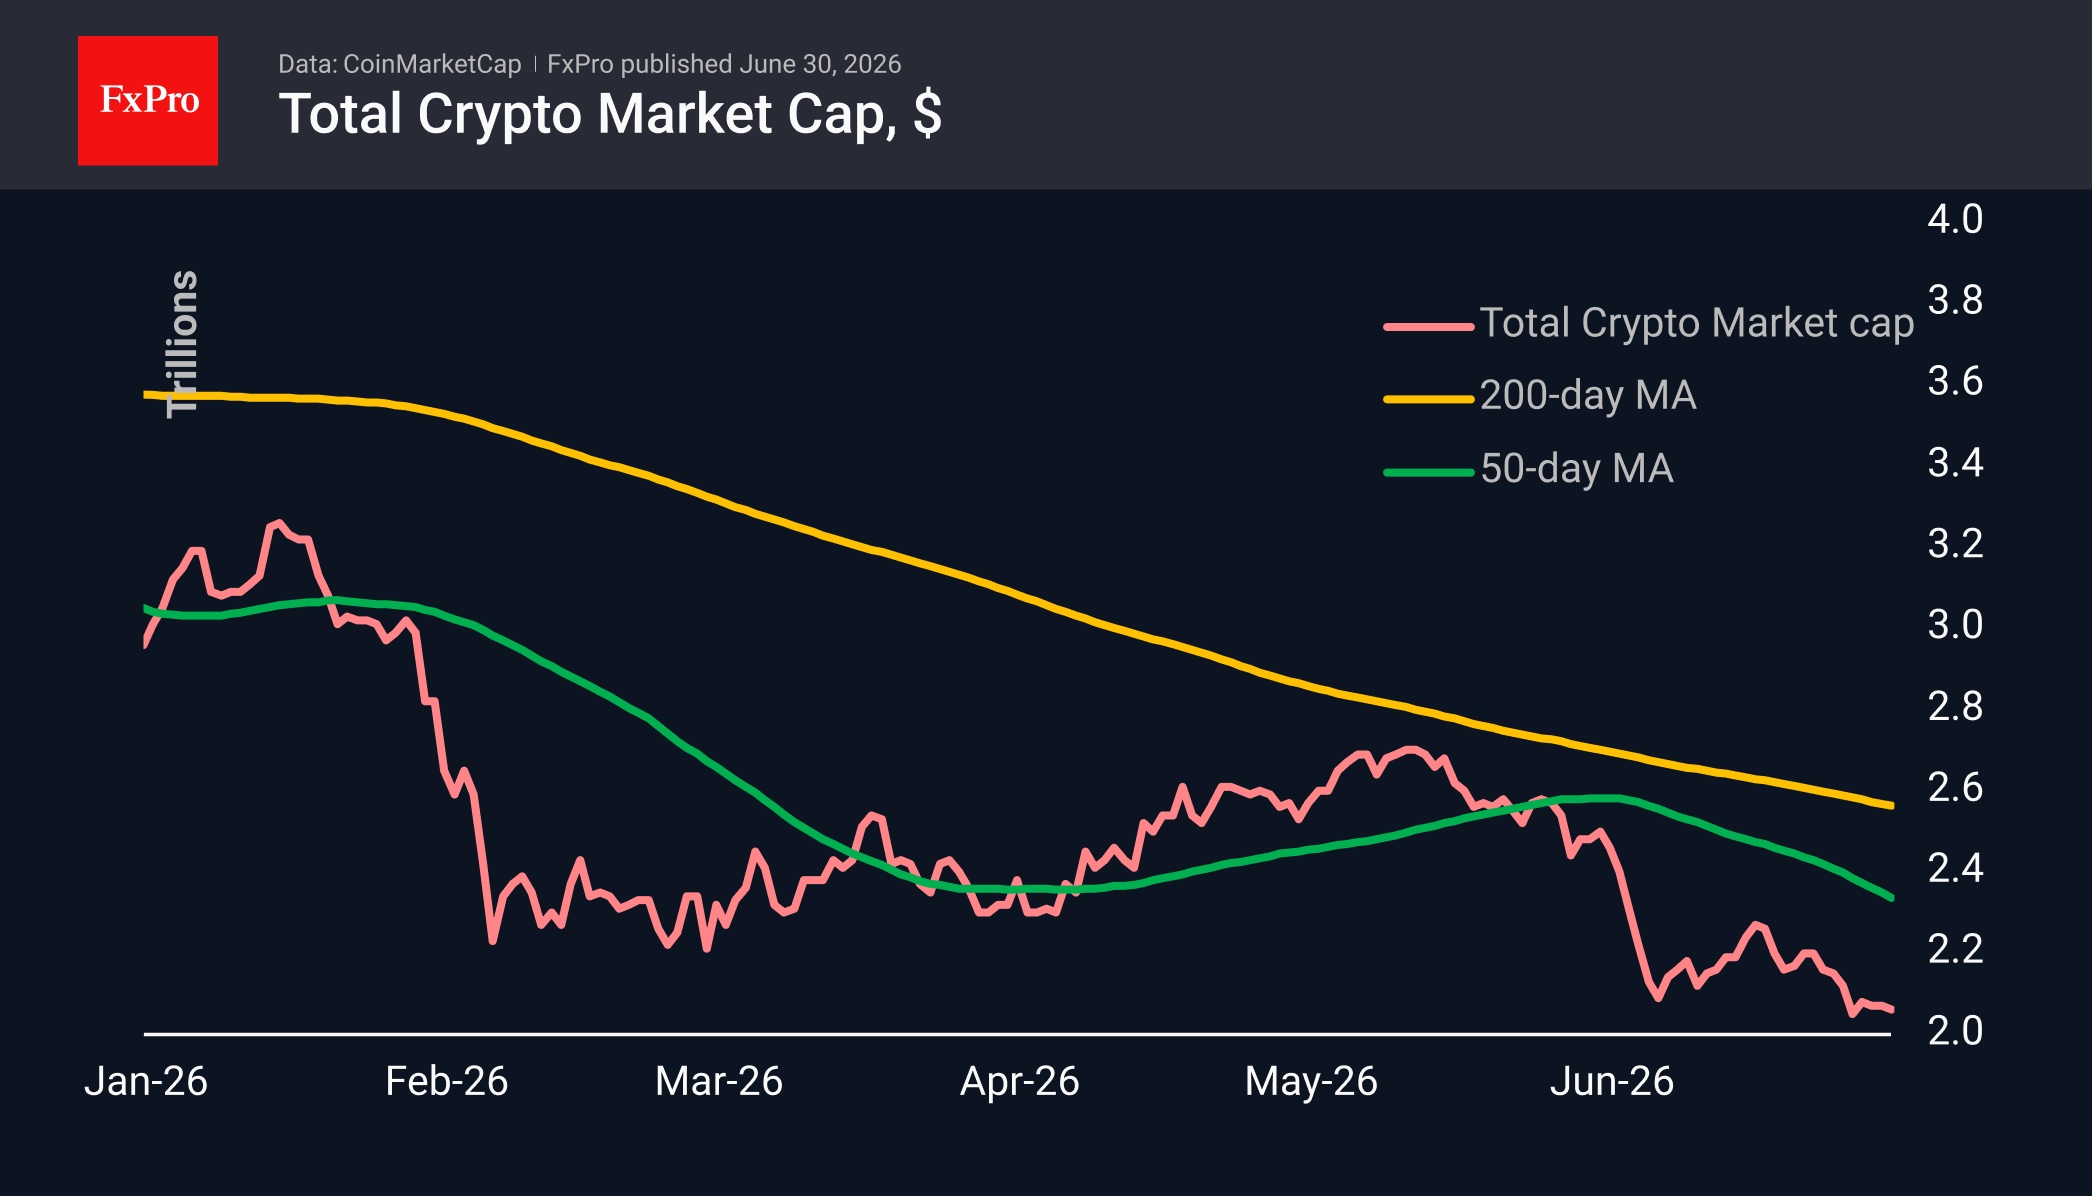
The crypto market capitalisation has changed little over the past 24 hours, remaining close to $2.06T. Among the most popular coins with traders, the top gainers are Stellar (+7.3%), Zcash (+4.2%), and Solana (+2.2%). The biggest fallers were Cosmos and Aave (both down 3.9%) and Immutable (-2.9%).
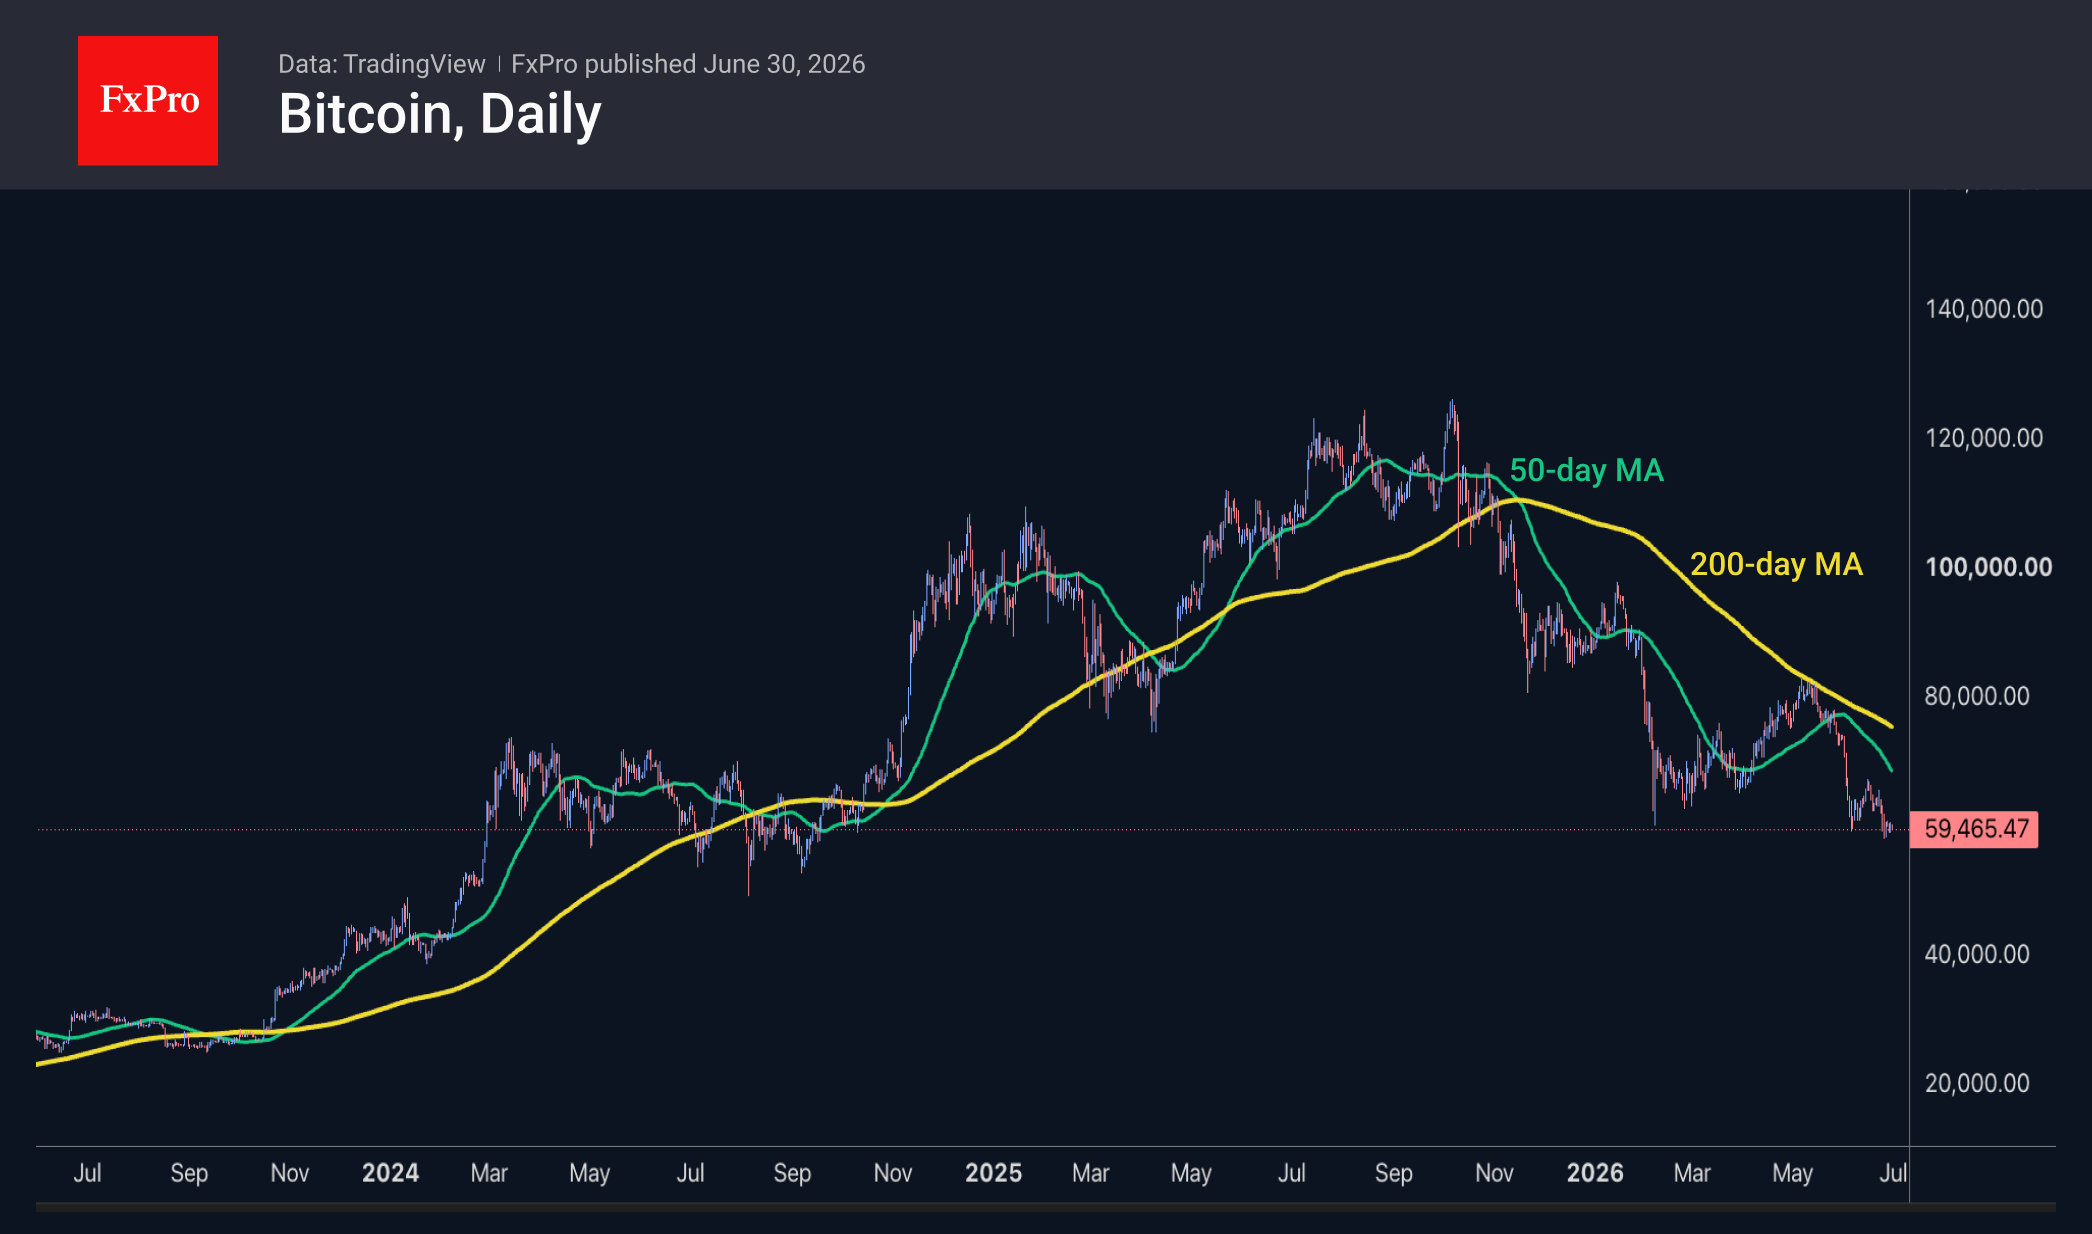
Bitcoin has been trading predominantly within a narrow range of $59K-$60K for the fifth consecutive day. This is a rather dangerous consolidation for the bulls, as it is taking place below previous local lows, from which the price rebounded in February and June. The leading cryptocurrency underwent a similar consolidation from March to October 2024, stuck in the $55–70K range with brief breakouts. But that was a consolidation in a rising market, whereas this one is in a falling market, given the direction of the 200- and 50-day moving averages and their position relative to the price. If we are indeed seeing a step-by-step decline, the next step could be the $40K mark.
News Background
On-chain data points to the start of a phase of capitulation among holders of the leading cryptocurrency, notes analyst Darkfost. Such periods have always proved profitable for long-term investors who began accumulating the asset then.
At the end of last week, Strategy’s preferred shares (STRC) hit an all-time low of around $71. Ordinary shares (MSTR) slumped by 25% over the week, falling to their lowest level since February 2024.
The share price decline intensified after the Rosen Law Firm announced it would launch a formal investigation into possible breaches of securities laws by Strategy. The lawyers intend to seek evidence of market manipulation and of misleading market participants regarding the true sustainability of Strategy’s assets.
The premium on Bitcoin reserves was a central part of Strategy’s business model. Whilst the shares were trading significantly above the book value of the BTC on the balance sheet, the company was able to issue new shares, purchase Bitcoin and increase its per-share ratio.
Strategy’s board of directors has authorised the company’s management to sell any amount of cryptocurrency from the reserves at any time. Previously, a separate board resolution was required for each sale. The board of directors expects that proceeds from the sale of bitcoins could reach $1.25 billion.
The FxPro Analyst Team
Gold Declines: Fed Policy and Geopolitics Weigh
Gold prices fell below 4,000 USD per troy ounce on Tuesday, reaching their lowest level in nearly eight months. The precious metal remains under pressure amid expectations of further Federal Reserve tightening and ongoing uncertainty over the Middle East situation.
Since the start of June, gold has lost more than 12%, with quarterly losses estimated at approximately 15%. Markets continue to price in three Fed rate hikes for the remainder of the year, with the first potentially coming in September.
Investors are now turning their attention to the upcoming US labour market report, which could shape expectations for the Fed's next policy steps.
An additional layer of uncertainty comes from US–Iran negotiations, which are set to resume today in Doha. Despite ongoing diplomatic contacts, the prospects for a long-term settlement remain limited, with control over shipping in the Strait of Hormuz remaining a key sticking point.
Technical Analysis
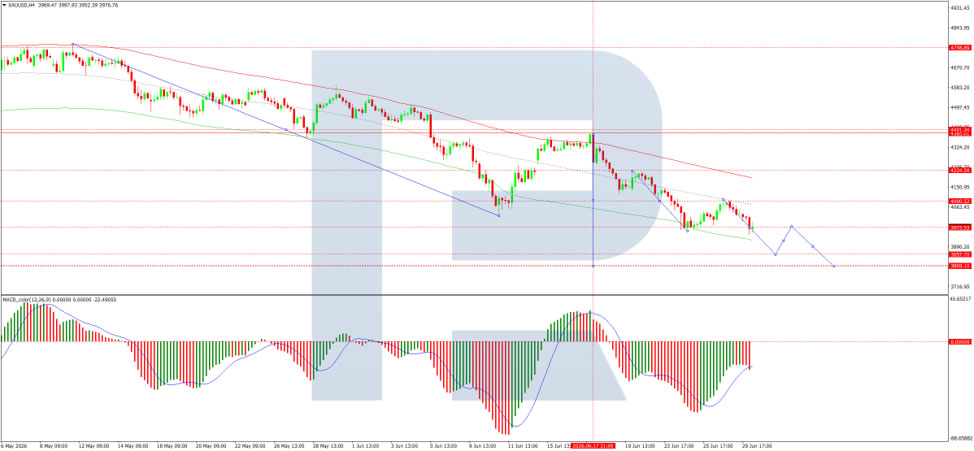
On the H4 XAU/USD chart, the market is trading within a consolidation range around the 4,017 USD level and has declined to 3,940 USD. A corrective move towards 4,016 USD (a test from below) is expected, followed by a potential decline to 3,885 USD, with scope for a further move to 3,810 USD. The MACD indicator confirms the current downside momentum, with its signal line below the centre line and pointing firmly downwards.
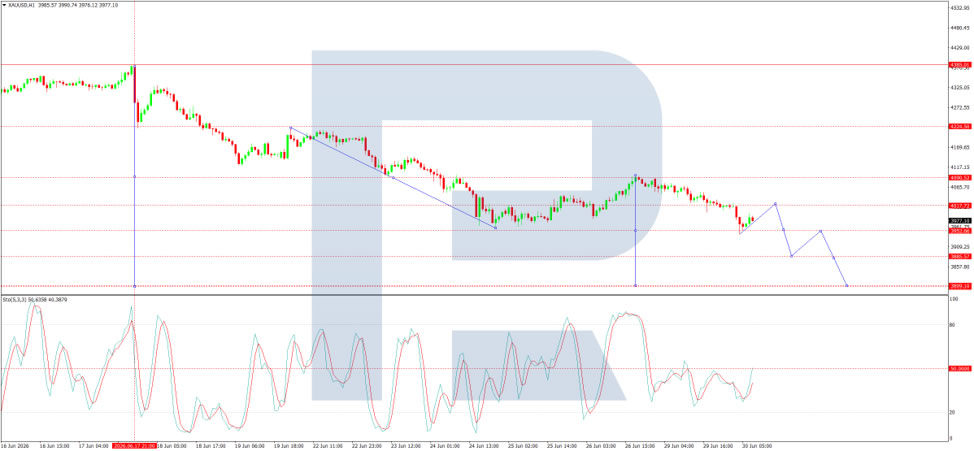
On the H1 chart, the market broke below the 4,017 USD level and moved lower to 3,940 USD. A corrective rebound towards 4,016 USD (a test from below) may follow before a further decline to 3,885 USD, with scope for an extension to 3,810 USD. The Stochastic oscillator supports this scenario, with its signal line below 50 and pointing downwards towards 20, indicating continued downside pressure.
Conclusion
Gold has fallen below 4,000 USD for the first time in nearly eight months, extending its losses amid expectations of further Fed tightening and persistent geopolitical uncertainty. Markets are pricing in three rate hikes for the rest of the year, with the first likely in September, while US–Iran negotiations in Doha offer limited prospects for a breakthrough given deep disagreements over shipping control in the Strait of Hormuz. Gold has now lost more than 12% since the start of June, with quarterly losses approaching 15%. Technical indicators point lower, suggesting further downside towards 3,885 USD and potentially 3,810 USD in the near term.
Forget the Level. Watch the Timing: Intervention Risks Rise as USD/JPY Hits 40-Year High
USD/JPY has broken to a fresh 40-year high, and with it, the market may have abandoned the wrong debate. Traders have speculated whether Japan would intervene at 160, then 162, then perhaps 163 or 164. But after another day of relentless Dollar buying and another round of ignored warnings from Tokyo, the more relevant question is no longer where intervention comes—it is when.
Japanese officials delivered all the familiar signals. Finance Minister Katsunobu Katayama said today that authorities were "standing ready to take action". Chief Cabinet Secretary Yoshimasa Kihara reminded markets that "bold actions are included as an option" alongside coordination with the United States. Yet USD/JPY barely paused. Traders appear convinced that Tokyo has little incentive to spend tens of billions of dollars defending the Yen just days before one of the year's most important macro events. If Thursday's US Non-Farm Payrolls report surprises to the upside, stronger Treasury yields and renewed expectations of aggressive Federal Reserve tightening could quickly erase any intervention-driven decline, leaving Japan with fewer reserves and less credibility.
That thinking has emboldened speculative accounts to keep testing higher levels. It also reflects a broader reality. This is not simply a weak-Yen story. The Dollar is appreciating against most major currencies as investors continue to favor the yield advantage created by the Fed's hawkish stance. Meanwhile, Prime Minister Sanae Takaichi's government has shown little sign of treating Yen weakness as a political emergency, reducing pressure on the Ministry of Finance to act immediately. Some market participants now believe Tokyo's tolerance has quietly shifted higher, making a move toward 163-164 conceivable before officials commit significant resources.
Ironically, delaying intervention could make it far more powerful. Rather than fighting the market ahead of payrolls, Tokyo may be waiting for the combination of an overstretched USD/JPY, a potentially disappointing employment report and the thin liquidity surrounding the US Independence Day holiday. Under those conditions, intervention would have a far greater chance of triggering a violent unwinding of leveraged long-Dollar positions than it would in normal market conditions.
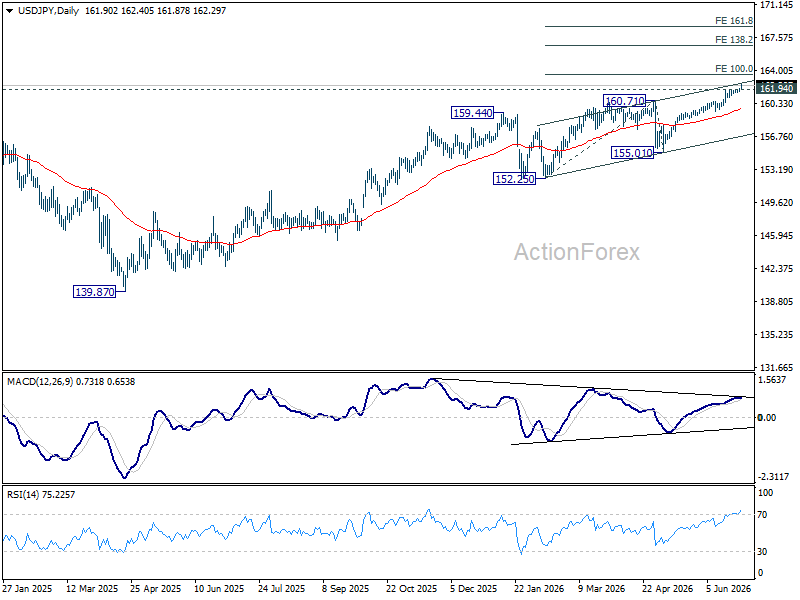
Technically, the decisive break above the 161.94 high from 2024 confirms resumption of the long-term uptrend. As long as 161.51 support holds, further gains are favored toward 100% projection of the 152.25 to 160.71 from 155.01 at 163.47. Some hesitation could emerge around that Fibonacci objective. But a decisive break of 163.47 would expose 138.2% projection at 166.70 next.
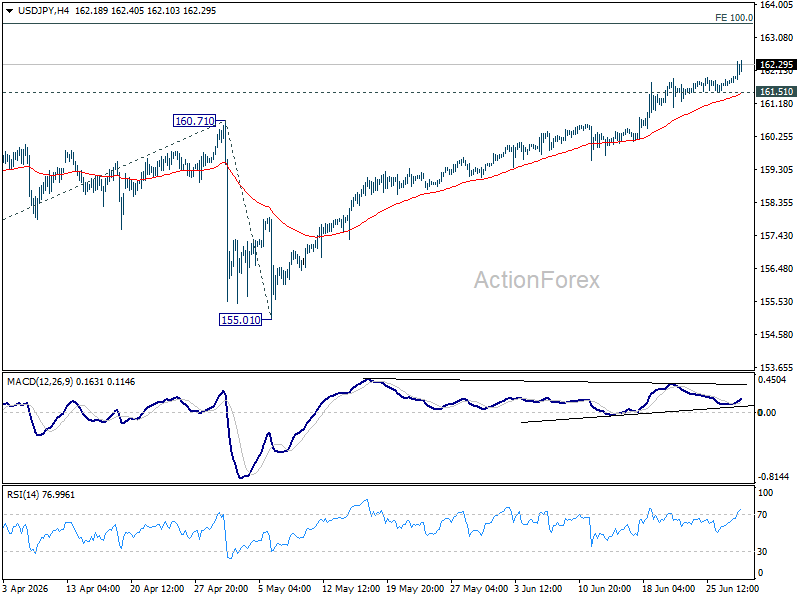
For now, the charts continue to support Dollar strength—but they also increase the probability that whenever Japan finally intervenes, it will be about maximizing impact rather than defending a specific number.
Swiss KOF Barometer Climbs Above Long-Term Average as Economic Outlook Improves
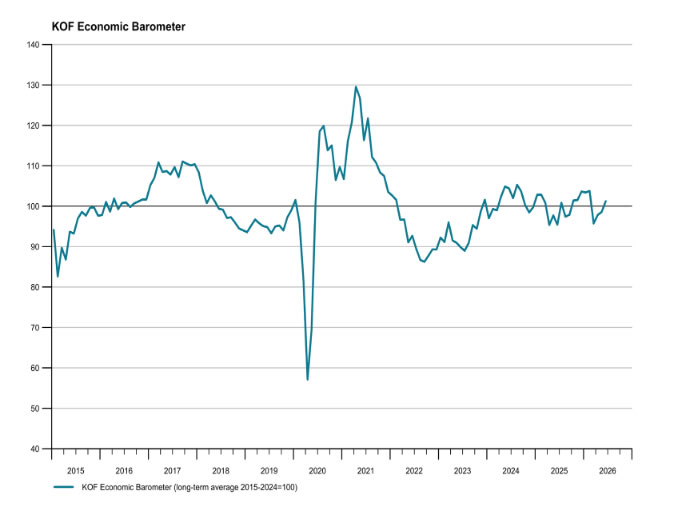
Switzerland's economic outlook improved noticeably in June as the KOF Economic Barometer rose from 98.6 to 101.2, comfortably beating expectations of 99.4 and moving back above its long-term average of 100. The latest reading suggests growth momentum is strengthening after several months of below-trend performance.
The KOF said the improvement was driven primarily by manufacturing, where production-related indicators showed a marked pickup. Demand-side indicators also strengthened, with both foreign demand and private consumption contributing positively to the outlook. "The outlook for the Swiss economy improves noticeably," the institute said, adding that the Barometer had risen "slightly above its average" after remaining below trend in recent months.
The survey points to a more balanced recovery in the Swiss economy, supported by both external and domestic demand. The improvement in foreign demand suggests Swiss exporters continue to benefit from resilient global activity, while firmer private consumption indicates households are becoming more confident. Together, the data reinforce expectations that the Swiss economy is regaining momentum after a softer start to the year.
| Indicator | Previous | Latest | Consensus |
|---|---|---|---|
| KOF Economic Barometer | 98.6 | 101.2 | 99.4 |
Chart Alert: USD/JPY Bullish Break Above 161.95 Signals Further Yen Weakness
Key takeaways
- USD/JPY has confirmed a major technical breakout. The decisive move above the long-standing 161.95 resistance suggests that bullish momentum remains firmly in place, with the pair entering a fresh medium-term impulsive advance despite increasingly forceful verbal intervention from Japanese officials.
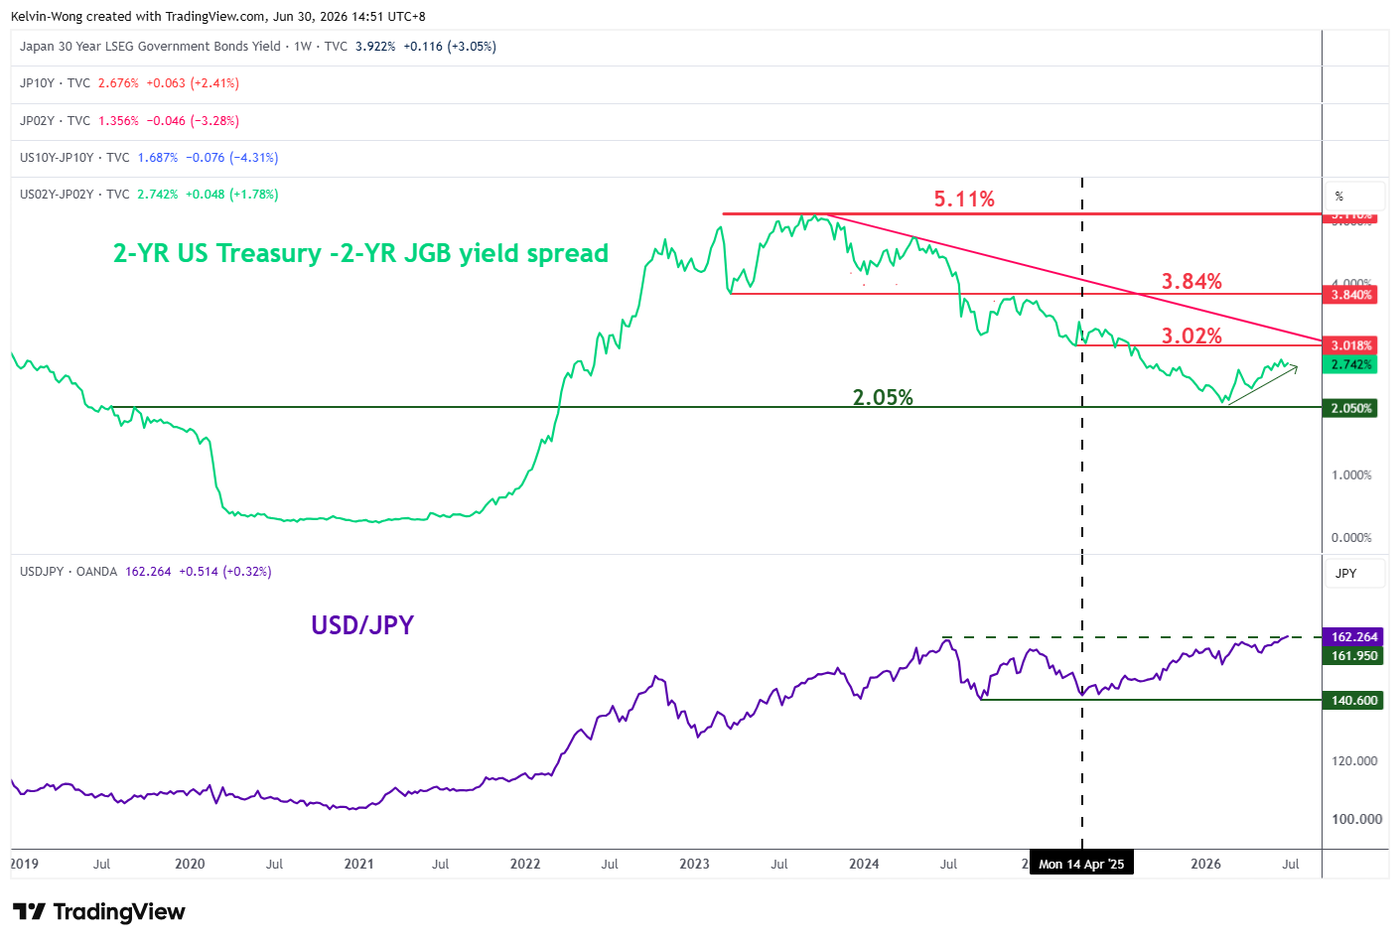
- Interest-rate differentials remain the dominant driver. The widening 2-year US Treasury-JGB yield spread continues to underpin dollar strength against the yen, as markets anticipate further policy tightening from the Federal Reserve while the Bank of Japan remains relatively accommodative despite its latest rate hike.
- Japan’s domestic policies are reinforcing yen weakness. A large-scale fiscal stimulus programme, combined with persistent foreign inflows into Japanese equities and associated currency hedging activity, is adding structural selling pressure to the yen.
- Verbal intervention alone appears insufficient. Unless Japanese authorities escalate to direct foreign exchange intervention or the US-Japan yield spread narrows materially, the path of least resistance for USD/JPY remains to the upside.
This is a follow-up analysis on the prior report, “Chart alert: USD/JPY advances toward the next 161.60/95 key intervention levels”, published on 10 June 2026
The price action of USD/JPY has advanced northwards as expected and cleared the key resistance level of 161.95, following the FX intervention in July 2022.
In today’s Asian session (Tuesday, 30 June 2026), the Japanese yen weakened to a 40-year low, printing 162.41 per US dollar despite verbal interventions from Japan’s Finance Minister Katayama and Chief Cabinet Secretary Kihara.
Why are verbal warnings being ignored?
The widening yield gap: While the Bank of Japan (BoJ) lifted its benchmark interest rate to “around 1%” in mid-June (its highest level since 1995), it remains severely behind the curve compared to Western developed central banks. With US rates at 3.50%–3.75% and the Fed expected to raise rates toward 4.00% under Chair Kevin Warsh, the nominal yield differential keeps JPY highly attractive as a funding currency for global carry trades
Given these circumstances, the 2-year yield spread between US Treasury notes and Japanese Government Bonds (JGBs) has continued to widen, now just above a major support level of 2.05%, and the yield premium has steadily increased to 2.74%, putting upside pressure on USD/JPY (see Fig. 1).
Takaichi’s aggressive fiscal package: Prime Minister Sanae Takaichi’s late-June unveiling of a massive $2.3 trillion public-private investment program over 14 years has reignited fears of structural fiscal expansion. This unchecked stimulus risks overheating the economy, causing long-term Japanese government bond (JGB) yields to rise in tandem with a weakening currency.
Nikkei 72,000 hedging blowback: The record-breaking rally in the Nikkei 225 past the 72,000 psychological level (printing an intraday all-time high of 72,832 on 22 June 2026) has been heavily fuelled by foreign capital pouring into Japanese AI and semiconductor equities. However, these inflows have been accompanied by aggressive currency hedging by foreign institutions, leading to immediate, heavy selling pressure on the spot JPY.
Fig. 1: 2-YR US Treasuries/JGBs yield spread with USD/JPY as of 30 Jun 2026 (Source: TradingView). The information presented is historical information, and past performance is not indicative of future performance.
Let’s now focus on the short-term trajectory (1 to 3 days) of the USD/JPY from a technical analysis perspective.
Continues to oscillate within a minor ascending channel
Fig. 2: USD/JPY minor trend as of 30 Jun 2026 (Source: TradingView). The information presented is historical information, and past performance is not indicative of future performance.
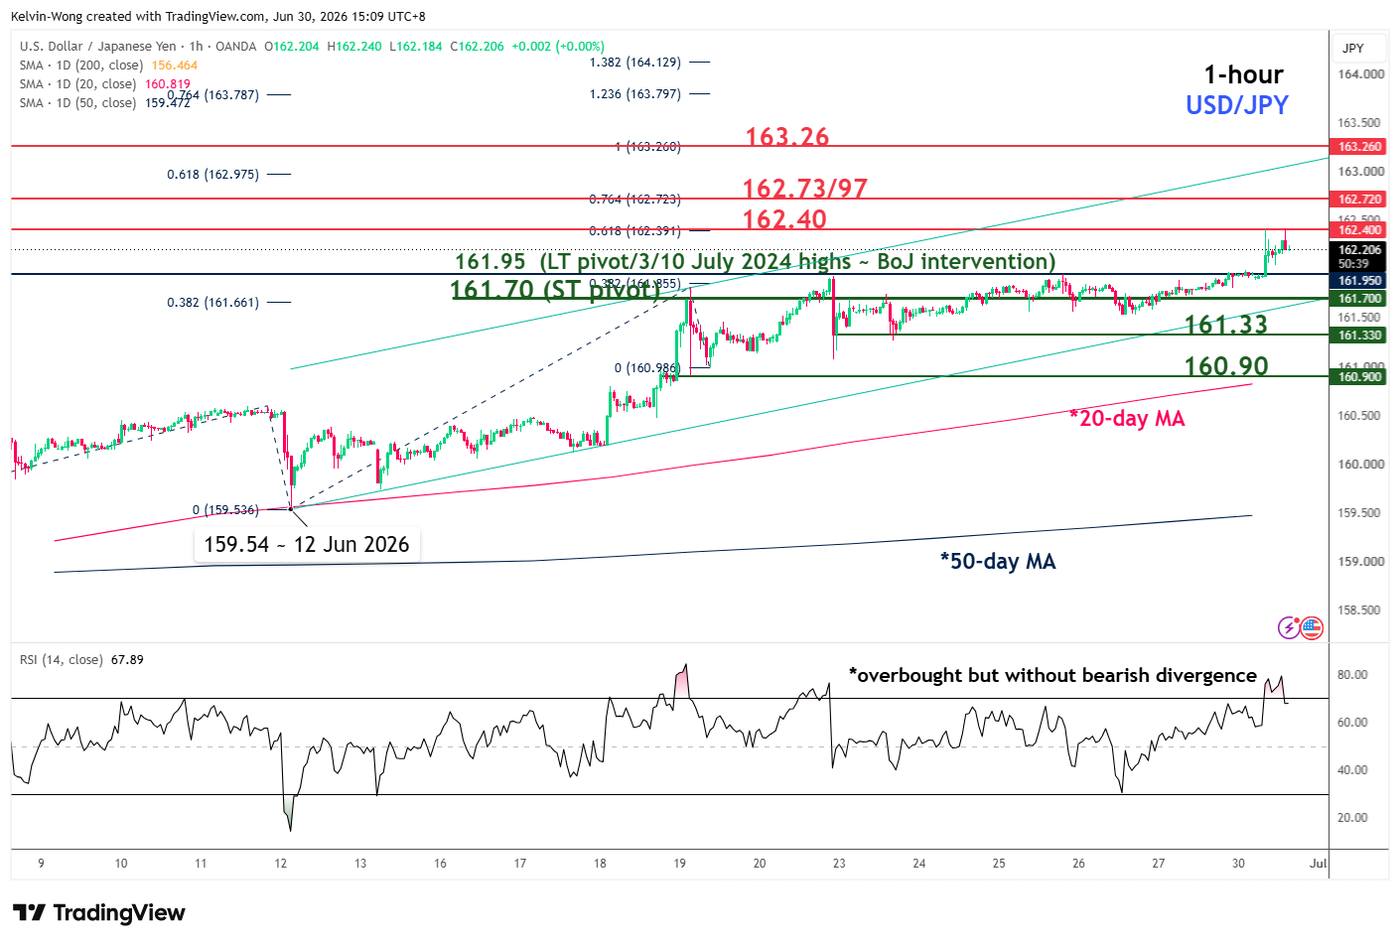
Trend bias: Minor uptrend remains intact with key short-term pivotal support at 161.70.
Resistances: 162.40 (Fibonacci extension), 162.73/97 (Fibonacci extension), 163.26 (Fibonacci extension & upper boundary of minor ascending channel) (see Fig. 2).
Next supports: 161.33 (22/23 Jun 2026 low), 160.90 (19 Jun 2026 low & 20-day MA)
Key elements to support the short-term bullish bias on USD/JPY
- Price action in USD/JPY continues to trade above the rising 20- and 50-day moving averages, suggesting that the minor and medium-term uptrend phases remain intact.
- The bullish breakout above a major range resistance at 161.95 increases the odds of a continuation of the medium-term (multi-week) bullish impulsive up-move sequence in USD/JPY.
NASDAQ-100: Price Concentrates Within the Market Profile Zone
Last week was one of the worst for US technology stocks since the beginning of 2026, with the index losing around 4.6% under the influence of two opposing factors. Firstly, the market continued to reassess the pace of returns on AI infrastructure investment — concerns that spending is outpacing actual returns triggered a sell-off in semiconductor stocks, with the Philadelphia Semiconductor Index falling nearly 8% over the week. Secondly, the US-Iran conflict surrounding the Strait of Hormuz escalated over the weekend: Tehran claimed responsibility for attacks on commercial vessels, while the US responded with air strikes. By Monday morning, tensions had eased somewhat as both sides announced a temporary halt to hostilities and agreed to hold talks in Doha on Tuesday. Against this backdrop, Nasdaq-100 futures gained around 1.1%.
Technical Picture
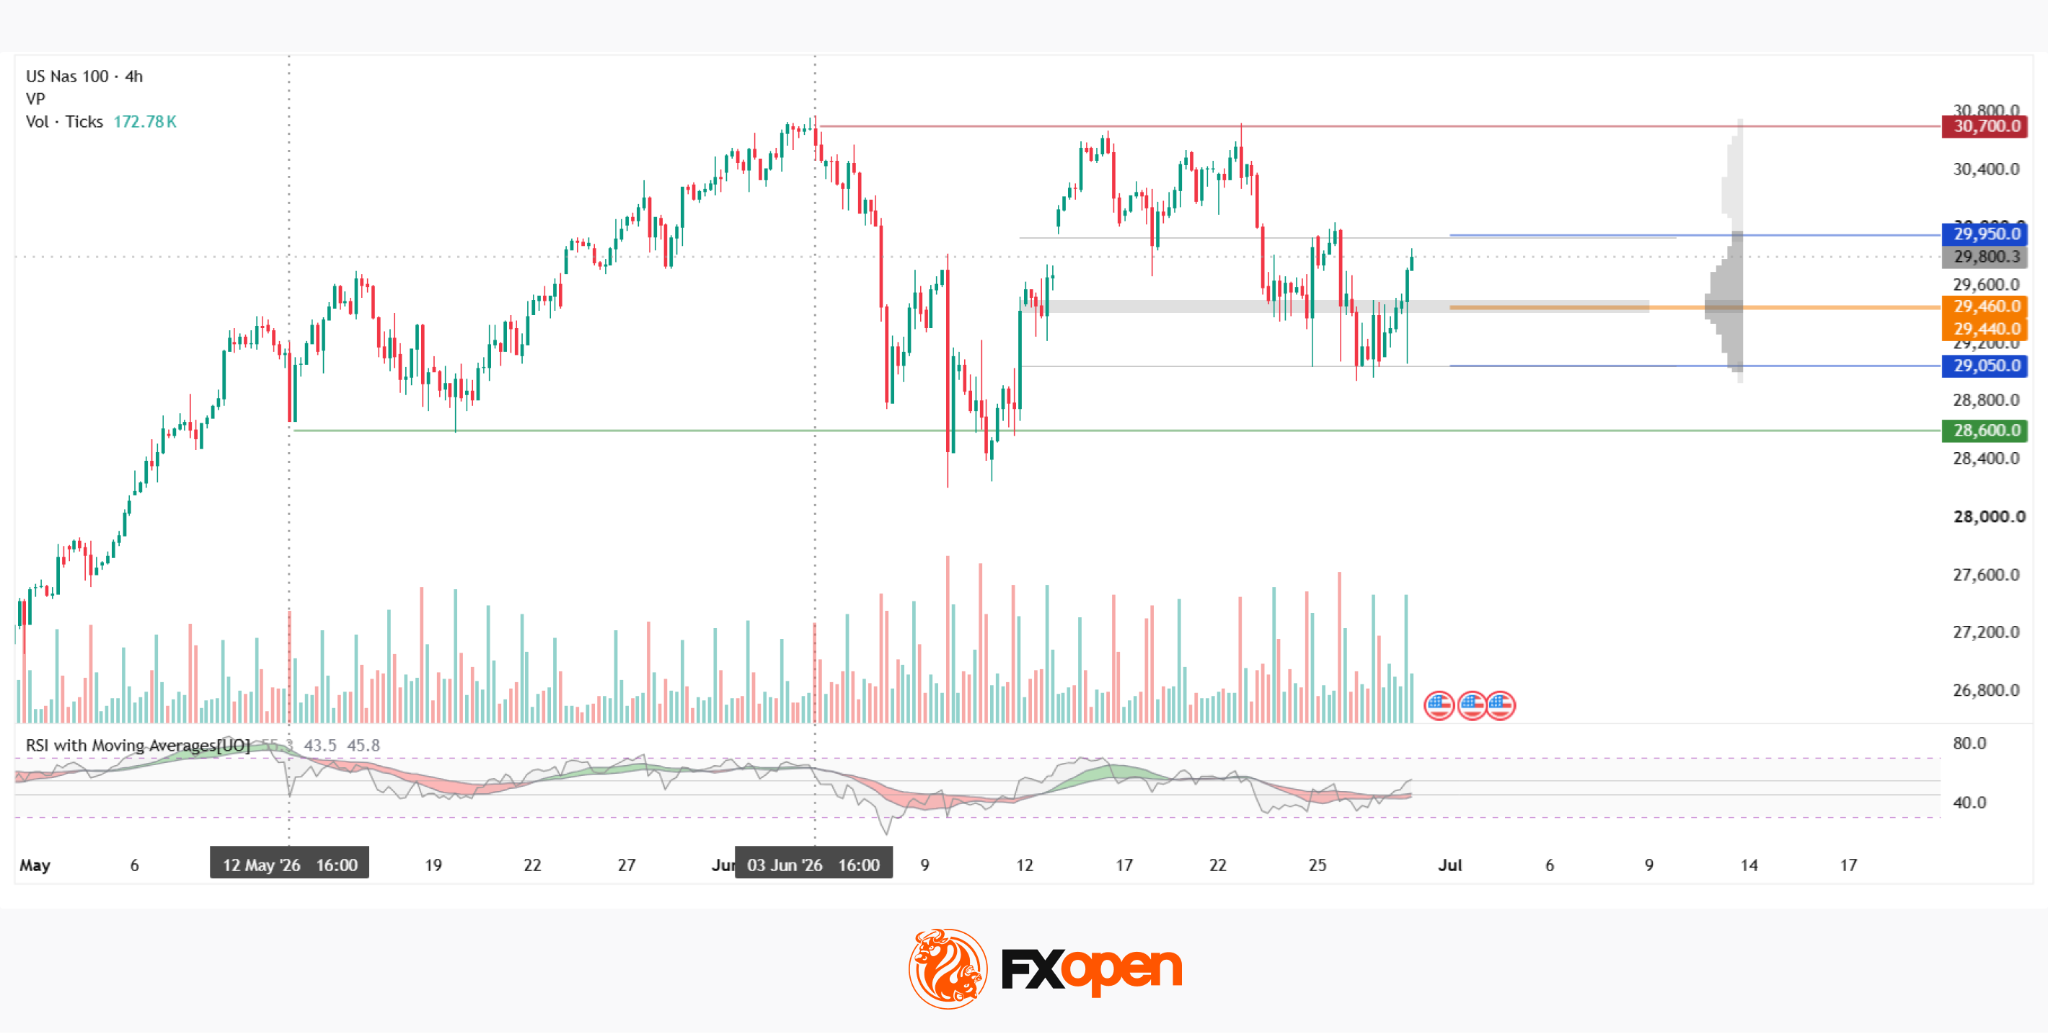
On the four-hour chart, the Nasdaq-100 (NDXm on FXOpen) has been trading within a sideways range since May, bounded by support near 28,600 and resistance around 30,700 — a range that formed following the June peak. After reaching that peak, the index experienced a sharp decline on 9 June, accompanied by exceptionally high trading volume. As a result of buyers defending the local lows, the price has since concentrated near the centre of the current range.
At present, the price is holding above the POC zone at 29,440–29,460, which may be viewed by market participants as the key point of attraction within the range. The price is approaching intermediate resistance at the upper boundary of the profile at 29,950, above which lies the red resistance level. RSI + MAs shows readings of 55, 43 and 45 — the oscillator remains above both moving averages, although the moving averages have yet to confirm a potential reversal and remain near the lower boundary of the neutral zone.
Key Takeaways
News of a pause in the US-Iran conflict supported the Nasdaq-100 at the market open, although concerns surrounding AI-related spending remain unresolved and were the primary driver of price action throughout June. The POC zone continues to serve as the key reference point for the balance between supply and demand: this is where the largest concentration of horizontal volume is located, and holding above this area could indicate that the market is preparing to continue its move towards the upper part of the range.
Trade global index CFDs with zero commission and tight spreads (additional fees may apply). Open your FXOpen account now or learn more about trading index CFDs with FXOpen.
This article represents the opinion of the Companies operating under the FXOpen brand only. It is not to be construed as an offer, solicitation, or recommendation with respect to products and services provided by the Companies operating under the FXOpen brand, nor is it to be considered financial advice.
ECB’s Lane: Lower Oil Prices Will Take Time to Feed Through Economy
European Central Bank Chief Economist Philip Lane said policymakers will remain flexible on interest rates as they assess how the recent decline in oil prices feeds through the economy, emphasizing that it is too early to draw conclusions about the inflation outlook. His remarks reinforce the ECB's data-dependent approach ahead of the next policy meeting.
Lane told BloombergTV that the Governing Council is committed to "not boxing ourselves in" on the trajectory for monetary policy, leaving open the possibility of another rate increase if inflation pressures prove more persistent than expected. While acknowledging that "the oil market has moved quite a bit since the last decision," he cautioned that policymakers need to "see how lower oil percolates across the economy" before adjusting their assessment of inflation risks.
Lane also suggested that confidence has yet to fully recover despite easing geopolitical tensions. "There has been some improvement in confidence but not to pre-war levels," he said, adding that "there hasn't been fast rethinking of investors and consumers." He also noted that oil prices for 2027 and 2028 are still expected to remain above pre-war levels, indicating that the ECB continues to see medium-term energy costs as a factor supporting a cautious approach to monetary policy.