Sample Category Title
Australia & New Zealand Weekly: Outlook for the Economy Supports Rates on Hold; China Represents Dominant Risk
Week beginning 18 December 2017
- Outlook for the economy supports rates on hold; China represents dominant risk.
- RBA minutes.
- Australia: mid-year Federal budget update, Westpac-MI Leading Index.
- NZ: GDP, business confidence, consumer confidence, current account.
- China: property prices.
- US: GDP 3rd estimate, PCE deflator.
- Central banks: BoJ policy decision.
- Key economic & financial forecasts.
Information contained in this report was current as at 15 December 2017.
Outlook for the Economy Supports Rates on Hold; China Represents Dominant Risk
As we contemplate 2018 and 2019 there are a number of key themes that we believe will dominate economic and market developments.
Our advice to customers throughout 2017 has been to expect Australia's growth rate to be anchored below trend in both 2018 and 2019. That has contrasted with official forecasts (Reserve Bank) which anticipate growth picking up to 3.25% in both 2018 and 2019 while Commonwealth Treasury is forecasting growth nearer 3%.
We have recognised a solid ongoing boost to growth from nonresidential construction; government spending and exports. However we are much more downbeat than official forecasts on the consumer; residential construction and equipment investment.
Slowing household incomes
Signals from the September quarter national accounts are not encouraging for the official view. There is some evidence that households are reassessing prospects for income growth, particularly with respect to a lift in wages growth. Ongoing positive expectations for a boost in income growth have encouraged households to cut their savings rate from 7.5% in 2013 to 3.2% in September 2017 (up from 3.0% in June).
We believe that household labour income growth will ease again in 2018 as wages growth remains benign and hours worked start to slow. Households which are also constrained by high debt and high energy prices are unlikely to be able to lift spending to allow the official growth forecasts to be reached.
Housing downturn
Resulting below trend consumption growth will also discourage any recovery in equipment investment. Residential housing and alterations and additions have also started to slow and, based on the downturn in high rise approvals, we expect this downturn has further to run. Large increases in supply and a marked slowdown in sales to foreigners are weighing on the outlook for residential building.
House price inflation is disappearing. On a six month annualised basis prices are now falling in Sydney and Perth while price gains are slowing in Melbourne, Brisbane and Adelaide.
The regulator's macroprudential policies are restricting interest only loans and tighter guidelines for all new loans are slowing house price inflation and credit growth. We expect housing credit growth to slow from 6.5% in 2017 to 5% in 2018 and 4.5% in 2019.
In previous cycles the authorities have relied on raising interest rates to slow the highly cyclical housing market. This time, the same effect has been achieved by the regulator as banks have independently raised loan rates, with the downturn in foreign demand also weighing on activity.
Inflation below target
Inflation is expected to remain benign holding a little below the bottom of the Reserve Bank's 2-3% target band. In this regard we are in agreement with the Reserve Bank which is forecasting that underlying inflation will hold at 1.75% in 2018 before lifting modestly to 2% in 2019.
Under these circumstances we can not fall into line with most other economists who continue to anticipate that the Reserve Bank will begin to raise rates in 2018. Indeed we have been of the view through 2017 that the official cash rate will remain on hold in both 2018 and 2019.
With rates on hold in Australia and the US Federal Reserve continuing to raise rates, Australia's cash rate is set to fall below the Federal funds rate by mid-2018.
Sustained period of negative Aus-US rate spreads
The US economy is operating with much less 'slack' in its labour market (unemployment rate of 4.1% compared to a estimated full employment rate of 4.75%) than Australia (unemployment rate of 5.5% compared to a full employment rate of 5.0%) but little wage pressure has emerged. Over the course of 2017 the USD has fallen by around 8% despite four rate hikes since December. With financial conditions also easing via a 20% rally in the US equity market, the Fed has seized on the opportunity to raise rates in anticipation of rising inflation. Without access to an effective macro-prudential policy (due to the highly regionalised and low concentration of lenders in the market) it has relied on higher rates to deal with the threat of financial instability.
We expect that process to continue in 2018 with two more 25 basis point hikes in June and December. That would see the AUD/USD yield differential in the overnight market contract to minus 38 basis points - a situation we have not seen early 2000. A heavy toll will be taken on the AUD with the currency forecast to fall to USD 0.70 by the end of 2018.
With upward pressure on the USD in 2018 and inflation remaining benign we expect that the Fed will hold rates steady through 2019 ensuring that the negative yield differential with Australia holds through 2019 and that the AUD will fall further. We expect a move down to USD 0.68 in 2019, with downside risks.
Heightened period of political uncertainty
Political uncertainty will remain a feature of the Australian economic picture in 2018 and 2019. The government is likely to embrace expansionary policies, particularly around tax, and may be prepared to compromise the proposed 2021 budget surplus to achieve a more constructive fiscal stance.
Coupled with the boost from a much lower Australian dollar, markets will eventually start to sense an improved growth outlook for Australia and even begin to anticipate higher overnight cash rates in 2020 following the 2019 election. Bond markets and the AUD will respond.
Global risks
The two major global risks for 2018 and 2019 centre around the US share market and the Chinese financial system.
The US share market has risen by over 20% over the last year or so. Pundits have been labelling this lift as a potential bubble. But earnings growth and the interest rate outlook are not severely out of line with current valuations. Share market collapses are generally triggered by sharp increases in bond rates. Such an increase would be in response to a significant upgrading in inflation and growth prospects. Westpac expects a reasonably benign path for inflation in the US through 2018 prompting the Fed to raise rates by 50 basis points and pushing the 10 year bond rate to 3% - not a sufficient enough move to trigger an equity market collapse. Furthermore, we expect the Fed to remain on hold in 2019 as policy in other major jurisdictions 'catches up' and the balance sheet gradually contracts. The more markets fear the sell off and the more cautious the rally becomes the more sustainable it is likely to be.
On the other hand the uncertainties and risks around the Chinese financial system are daunting.
Much has been made of the synchronised lift in global growth in 2017. From Australia's perspective, the key development has been the faster than anticipated growth in China. We expect China's growth rate will reach a comfortable 6.8% in 2017 but anticipate a decent slowdown in 2018, to 6.2%.
The Week that Was
The past week has proven particularly interesting. Following weeks of disappointing data, Australia received two significant upside surprises. Offshore, central banks were in focus.
The highlight of the week was the November employment report. We and the market were expecting another solid result circa 20k. In the event, the ABS reported an outcome more than three times as large, +62k, with full-time employment the primary contributor. Intriguingly, the unemployment rate was unchanged in the month at 5.4% as the participation rate rose 0.3ppts. This combination points to sample rotation being behind the jump. Regardless, this is still a strong update, being the 14th positive outcome and seeing annual growth at 3.2%, twice population growth. A partial reversal is likely in coming months but, based on the leading indicators, employment growth should remain robust into 2018.
The Westpac-MI Consumer Sentiment index also surprised to the upside in December, printing at 103. Continued strength in the labour market and tempered expectations of a rate hike likely aided confidence. Global growth and the positive impetus they have provided to equity markets was also supportive. Notably though, concerns around housing affordability remain front and centre, particularly in Sydney and Melbourne. Responses to the 'wisest place for savings' question also remain highly risk averse. Given high levels of household debt; soft wages growth; and rapid increases in the cost of life essentials, it seems unlikely that consumption growth will be driven higher as the RBA expect.
In addition to these two primary releases, this week also saw the latest update for the NAB business survey. In November, conditions remained above-average despite more than reversing October's spike. Confidence also deteriorated, but is still in line with the long-run average. Strength was also seen in our Q4 Australian Chamber Westpac Survey of Industrial Trends. These surveys point to strength in employment growth being sustained into 2018 as well as for a sustained uplift in investment.
Before turning to the global economy, it is worth noting that Monday coming will see the release of the Australian Federal Government's mid-year update. Our preview highlights that, unlike most of the post-GFC period, the update will be favourable. See preview box ahead for further detail.
In NZ, the new government has provided their first fiscal update, in which they took quite an optimistic view on the outlook. Our NZ team sees downside risks to the Government's growth forecasts and therefore to tax receipts and the bottom line.
For the US, there are three events worthy of discussion. First is the December FOMC meeting. Here the Committee delivered a 25bp rate hike as expected and showed greater confidence in the growth outlook - owing to firming expectations around tax reform as well as recent robust momentum. However, they continue to believe that inflation is set to remain below or at target throughout the forecast period. As a consequence, the FOMC's interest rate expectations were left unchanged.
The other two developments relate to Washington. The Alabama Senate election saw Democrat Doug Jones win. That means the Republican majority in the Senate is now just one. Unsurprisingly, this has seen Congressional Republicans push for a quick passing of the now-agreed joint tax package - before Doug Jones is admitted. However, that doesn't necessarily mean that there won't be hold outs. To date, Republican Senators Rubio and Collins have voiced concern. It also bears remembering that the current two-week spending authority granted will end in seven days, again raising the risk of a government shut down.
Caution was also on display at the European Central Bank and Bank of England December meetings. As occurred in the US, the ECB upgraded their growth view, but held back on inflation. Weakness in wages is a key factor here. We look for the ECB to step purchases down to a EUR15bn pace in Q4 2018 and then to end purchases for 2019. Increases in the benchmark refinance rate will be a long time coming. The Bank of England is closer to raising rates than the ECB currently; however, justification for doing so is very limited, and the downside risks are substantial.
Finally, we highlight some summer reading. The December/ January edition of Market Outlook has just been released. In it, a number of key themes are discussed, most notably China's financial system and Amazon's Australia entry. Having looked backed at the 'year that was', Chief Economist Bill Evans considers 2018 outlook for the Australian and global economy.
Chart of the week: Unemployment and underemployment
Total employment rose 61.6k compared the market's 19k forecast and Westpac's +25k. In the month unemployment was flat at 5.4% (5.40% at two decimal places vs. 5.39% in Oct) with a 0.3ppt gain participation driving 65.7k surge in the labour force.
A further positive is the decline in the underemployment from 8.5% in Aug to 8.3% in Nov (the seasonally adjusted estimate is only released quarterly). This is indicative of an overall improvement in the labour market and possible upwards pressure in wages. However, at this stage we are yet to see any significant increase in wage inflation and underemployment continues to lag the improvement in the unemployment rate and the surge in hours worked.
New Zealand: Week Ahead & Data Wrap
Growth slowdown under way
The past year has seen some big changes in the economic landscape, and further changes are on the cards over 2018. So as this year draws to a close, how is the New Zealand economy tracking, and what can we expect going forward?
How strong is the New Zealand economy looking?
Next week's GDP report is expected to show that economic growth slowed to just 0.4% through the September quarter. In part, this slowdown reflects the impact of some temporary factors. Poor weather through the middle part of the year put a dampener on agricultural production. We've also seen earlier boosts to demand in the tourism and hospitality sectors fading following high profile sporting events in the first half of 2017.
However, even smoothing through those temporary disruptions, the New Zealand economy has lost some steam. We expect that GDP growth over 2017 as a whole will come in at just 2.4%. That's down from 3% over 2016. And after adjusting for rapid population growth over the past year, we're left with a picture of relatively flat per capita economic growth.
But while the pace of overall growth has eased off, the final months of the year have seen signs of resilience in some key parts of the economy. Most notably, the housing market has found a new (though likely temporary) lease on life, with house sales posting solid gains through October and November. We've also seen a re-acceleration in house price inflation in parts of the country including Auckland. Importantly, this resurgence in the housing market appears to have also given spending a shot in the arm, with electronic cards transactions rising by more than expected in November.
Increasing headwinds expected over 2018
This resilience in activity late in 2017 is important, as it leaves the economy on a firmer footing as we enter what's shaping up to be a testing year. As we've been highlighting in recent weeks, headwinds for growth have been mounting. Among the more notable developments has been the downturn in net migration, which we expect to continue for some time and which will weigh on economic growth. At the same time, construction activity has flattened off in the face of difficulties sourcing finance, challenges accessing skilled labour, and rising costs.
And of course, on top of those factors we're looking at significant changes in the policy environment over the coming years. That includes the coming introduction of a suite of policies that will dampen the housing market, and which will likely have flow-on downside impacts for consumption spending.
The above factors mean that GDP growth is likely to remain fairly modest over the coming year. We're forecasting economic output will rise by only 2.4% over calendar 2018.
Our forecast for subdued economic growth over the coming year are in stark contrast to forecasts in the Government's Half Year Economic and Fiscal Update (HYEFU), released this past week. That update provided us with our first detailed look at how the new coalition Government expects its policies will affect the economy. However, digging though the details of the HYEFU, we think the Government is being far too optimistic about the outlook over the next few years. In particular, the HYEFU forecast assumes an acceleration in GDP growth to 3.5% over 2018, underpinned by firmness in both investment spending and household consumption. Both of those assumptions look doubtful to us. As well as the downside risks for the housing market and household spending highlighted above, businesses we've spoken with in recent weeks have told us that they are extremely nervous about the outlook. We expect that this will be a significant drag on investment spending and hiring over the coming year.
If GDP growth doesn't accelerate to the extent that the Treasury is projecting, the risk is that future revenue will fall short, requiring the Government to either rein in some of its spending plans, find additional sources of revenue, or abandon its commitment to reducing net debt so rapidly. This vulnerability isn't unique to the new Government: we made similar comments at the time of the May Budget. And since our point of disagreement relates to the outlook for economic growth several years ahead, it's likely that our concerns will remain for some time.
New year, new Governor
One of the lingering uncertainties about the economic outlook has been the potential impact of looming changes at the RBNZ. The most important question on this front is how policy will respond to the planned expansion of the RBNZ objectives to include a focus on employment.
We've been wary of the dual mandate as it might make it harder for the Reserve Bank of raise rates when inflation is too high, since that could conflict with a directive to maximise employment.
However, some of that uncertainty around the outlook for monetary policy has dissipated following the announcement that Adrian Orr will take over as RBNZ Governor in March. Mr Orr is currently the head of the NZ Super Fund. He has previously held senior roles at the RBNZ and was Chief Economist at Westpac. With his extensive experience in economic policy, we would expect that the RBNZ will remain realistic about what impact monetary policy can have on the economy in the long run, while still focusing on employment over the economic cycle.
Data Previews
Aus Federal budget, 2017/18 mid-year update, AUDbn
Dec 18, Last: -29.4 (pr), WBC f/c: -27
Mkt f/c: tba, Range: tba
- The Federal Government's Mid-Year Economic and Fiscal Outlook is expected to confirm the broad profile for the budget balance, as set out in the May Budget.
- On the economy: forecast nominal GDP growth for 2017/18 is likely to be upgraded to 4.5% from 4.0% at Budget time, on upside to commodity prices; while real GDP growth is on track for the forecast 2.75%. For the out years, the economic forecasts are likely to be little changed.
- The stronger starting position for the economy boosts revenues, while a likely small undershoot on expenditures could be used to fund modest new initiatives.
- On our figuring, the forecast budget deficit for 2017/18 is $2.4bn smaller, at $27.0bn vs $29.4bn at budget time.
Aus Oct Westpac-MI Leading Index
Dec 20, Last: +0.44%
- The six month annualised growth rate in the Leading Index lifted from -0.02% in September to +0.44% in October, marking the first above trend reading on momentum since mid-year and suggesting some of the headwinds to growth evident earlier in 2017 have eased.
- The Nov index will include mostly positive component updates including: the Westpac-MI Consumer Expectations Index, up 3.4% vs -1.8% last month; commodity prices, up 2.2% in AUD terms vs -0.4% last month; the Westpac-MI Unemployment Expectations Index, down -2.4% vs 1.2% last month (declines mean an improved read); and total hours worked, up 0.6% vs 0.3% last month.
NZ Q4 Westpac McDermott Miller Consumer Confidence
Dec 19, Last: 112.4
- The Westpac McDermott Miller Consumer Confidence survey softened to a level of 112.4 in September, down from 113.4 in June. Given normal quarter-to-quarter volatility, that was a fairly small decline. And following gains earlier in the year, it left household confidence at firm levels.
- The December survey will provide an update on how consumer confidence has fared following the election of the new Government and related changes in the outlook for economic policy.
NZ Dec business confidence
Dec 19, Last: -39.3
- Business confidence plunged in November, falling to its lowest level in nine years. Some of the drop was likely a knee-jerk reaction to the change of government - we find that business confidence averages about 20 points lower under left-wing governments. However, the November drop was even larger than this, and confidence has been falling since July.
- While the fall in confidence may prove to be an overreaction, expectations do matter. Our forecasts include a hiatus in business investment in 2018, one of the reasons why we expect subdued GDP growth next year.
- Inflation expectations rose sharply in November, presumably on a view that the new Government will be inflationary. We agree with that view over the long term, but not the one-year ahead horizon that the survey covers - in fact, the balance of Government policies is likely to reduce inflation over 2018.
NZ Q3 current account, % of GDP
Dec 20, Last: -2.8%, Westpac f/c: -2.5%, Mkt f/c: -2.5%
- We expect the annual current account deficit to narrow to 2.5% of GDP in the September quarter. Part of the improvement is due to base effects, with dairy export prices and volumes higher than they were a year earlier.
- For the quarter, goods exports were steady, while import prices and volumes fell. Services exports dropped back from the previous quarter's rise, when tourism was boosted by the Lions rugby tour.
- We expect the investment income deficit to widen, due to higher profits for overseas-owned firms.
NZ Q3 GDP
Dec 21, Last: 0.8%, Westpac f/c: 0.4%, Mkt f/c: 0.6%
- We expect a subdued 0.4% rise in GDP for the September quarter. Much of the expected weakness is due to lower primary sector activity. Milk production made a slow start to the new season, and oil and gas extraction has continued its natural decline.
- On the positive side, we expect strong contributions from non-food manufacturing, construction and personal services.
- The September quarter is likely to mark the low point for growth this year. The June quarter benefited from a pickup in milk production and a spike in tourist numbers during the Lions rugby tour. Similarly, we expect some rebound in December quarter growth, with a number of near-term indicators showing signs of life.
US Dec Personal income and spending
Dec 22, personal income, last 0.4%, WBC 0.4%
Dec 22, personal spending, last 0.3%, WBC 0.5%
Dec 22, personal deflator, last 0.1%, WBC 0.3%
- Despite very strong employment growth which has seen both the unemployment rate and underutilisation decline rapidly, wages growth in the US remains subdued. Indeed, on a real discretionary basis, household incomes are up only around 0.5%yr. It is therefore unsurprising that the savings rate has been falling.
- While sentiment has also been supportive, the budget reality that households face is restricting spending, which slowed in the September quarter and remained subdued in October. We expect November might see a bounce in services, but risks are to the downside.
- Inflation remains well contained. The core CPI disappointed expectations in Nov, +0.1% and the PCE variant is likely to follow suit. Energy will add in November.
Weekly Focus: The Season of Central Bank Metings Continues
Market Movers ahead
- An important meeting is coming up in the Swedish Riksbank, as it has to decide on whether to end QE and it is a close call as to what it will chose.
- Higher wage growth is key if the ECB is to realise its inflation target; therefore, euro area wage data for Q3 due out on Tuesday should be watched closely.
- The most important inflation measure in the US is likely to show slightly higher inflation.
- The Bank of Japan is expected to announce unchanged policy but might comment on recent tightening speculation.
Global macro and market themes
- Recent economic data releases support our view that the global expansion continues, not least in the euro area, where PMIs have been very strong in Q4.
- It is too early for markets to price out Brexit risk just yet, but it is positive that negotiations are moving forward.
- Central bank meetings support our view that global monetary policy tightening will be gradual.
- The environment is positive for risk assets such as equities; we believe EUR/USD will move higher and that yields will stay low.
- Norges Bank will hike rates late next year.
- In the FX space, we look for a weaker USD and a stronger GBP and NOK in 2018.
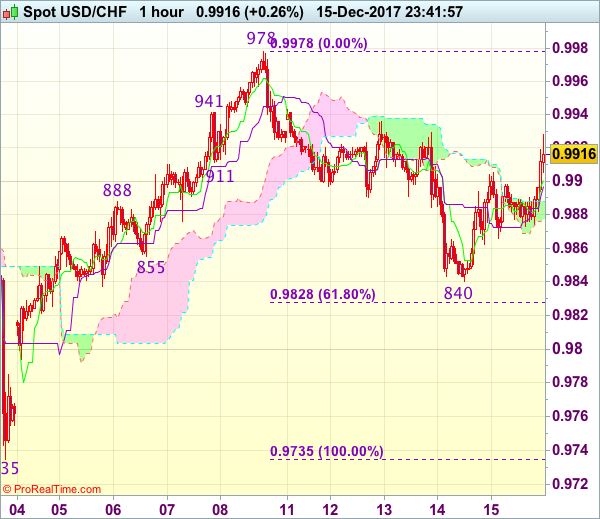
Trade Idea Wrap-up: USD/CHF – Hold long entered at 0.9870
USD/CHF - 0.9919
Most recent candlesticks pattern : N/A
Trend : Near term up
Tenkan-Sen level : 0.9904
Kijun-Sen level : 0.9901
Ichimoku cloud top : 0.9889
Ichimoku cloud bottom : 0.9877
Original strategy :
Bought at 0.9870, Target: 0.9970, Stop: 0.9835
Position : - Long at 0.9870
Target : - 0.9970
Stop : - 0.9835
New strategy :
Hold long entered at 0.9870, Target: 0.9970, Stop: 0.9870
Position : - Long at 0.9870
Target : - 0.9970
Stop : - 0.9870
Although the greenback retreated after meeting resistance at 0.9905 yesterday and consolidation would be seen, as long as yesterday’s low at 0.9840 holds, mild upside bias remains for another rebound, above 0.9905 would extend gain to 0.9935-40 but break there is needed to retain bullishness and signal low is formed, bring further rise towards resistance at 0.9978, however, only break there is confirm recent upmove has resumed and extend headway to psychological resistance at 1.0000.
In view of this, we are holding on to our long position entered at 0.9870. Below said support at 0.9840 would extend the fall from 0.9978 top for retracement of recent rise to 0.9820, then towards 0.9790-95, having said that, near term oversold condition should limit downside and price should stay above 0.9755-60, bring rebound later.
USD Holds Tight Ranges. Equities Slightly Supportive
Due to our annual Christmas Holiday, there will be no KBC Reports from Monday 18 December 2017 until Tuesday 2 January 2018.
- European equity markets opened with modest losses as sentiment from Asia temporary filtered through. However, there were no follow-through losses. Most European indices show limited losses. US equities resume their uptrend opening with gains of about 0.5%
- The Russian central bank cut its key interest rate by 50 basis points to 7.75% from 8.25%, a sharper cut than expected, and said further cautious reductions were possible in the first half of next year.
- "We will see a persistently high underlying pace of economic growth not only in the final quarter of 2017 and the first quarter of 2018, but also over the remainder of 2018, during which time the German economy will grow robustly," Bundesbank President Weidmann said in a statement.
- The US empire manufacturing index declined slightly more than anticipated in December, from 19.4 to 18.0 (vs 18.7). US industrial production increased by 0.2% M/M following a post-storm 1.4% M/M rebound in October.
- The ECB must be careful to avoid distorting markets with its asset purchases and that is an important factor in deciding when to adjust stimulus, Governing Council member Nowotny said.
- Irelands economy surged in the third quarter, boosted by rising exports and falling imports. GDP rose 10.5% from the year earlier period. The economy grew 4.2% from the previous quarter.
Rates
Start of end-of-year trading
Global core bonds trading shifted into lower gear. With key central bank meetings and eco data behind us, erratic end-of-year dealings might be name of the game for the remainder of the year. Recovering European stock markets didn't weigh on the Bund or the US Note future. Both contracts traded in narrow, sideways ranges. Spain made an opening gambit to fill the position of ECB vice-president Constancio after he leaves the board mid-2018. Between that date and Q3 2019, also ECB president Draghi and chief economist Praet will be replaced. The ECB Troika are the architects of current ultra-easy monetary policy, suggesting that a dramatic shift in thinking is possible depending on who'll fill the seats. ECB Nowotny and Vasiliauskas stroke a more hawkish tone today suggesting no additional need for QE. US eco data included a slightly disappointing empire manufacturing and US production data.
At the time of writing, the US yield curve bear flattens with yields rising up to 2.1 bps (2-yr). The German yield curve drops by 0.2 bps (5-yr) to 1.7 bps (2-yr). On intra-EMU bond markets, 10-yr yield spread changes versus Germany are nearly unchanged with Greece outperforming (-11 bps).
Currencies
USD holds tight ranges. Equities slightly supportive
Trading in the major US cross rates was confined to tight ranges today. US eco data were marginally softer than expected but with little impact on trading. The dollar traded soft early in the session, but gained a few ticks later as US equities extended their bull run.
Major Asian equity indices mostly traded in negative territory showing losses between 0.5% and 1.0%. The closely watched BOJ Tankan large manufacturing index rose from 22 to 25, the highest level in 11 years. Other sub-indices also suggest an improvement in the broader economic performance including a tightening labour market and tentative signs of price rises. However, it didn't change market expectations that the BOJ will maintain its ultra-easy monetary policy in the foreseeable future. USD/JPY held a tight range close to/slightly above 112, near the post-Fed low. Uncertainty on the fate of the US tax bill maybe played a role. EUR/USD traded sideways in the 1.1785 area.
There was no high profile economic news to guide trading in EUR/USD or USD/JPY today. EUR/USD held an extremely tight sideways range roughly between 1.1780 and 1.1810. The subsequent messages from the Fed and/or the ECB were too diffuse to give clear directional guidance for USD or euro trading. The USD/German interest rate differential reversed part of the narrowing since Wednesday (US CPI/Fed). Initially, it was not enough for the dollar to resume the 'tentative uptrend' from earlier this week. The US eco data (Empire manufacturing and November production data) came out slightly softer than expected. US equities opened strong giving some downside protection to the US currency. The ongoing political noise on the US tax bill remains a source of USD caution. That said, it looks that USD trading is gradually shifting in yearend modus. EUR/USD hovers around the 1.18 pivot (currently 1.1780). USD/JPY holds a tight range north of the 112 big figure (currently 112.30 area).
Sterling declines despite formal EU Brexit deal approval
There were no eco data in the UK today. Yesterday evening, sterling profited as EU leaders gave quite some verbal support to UK PM May with respect to the agreement on the first Brexit deal reached last week. Today, EU leaders gave formal green light for Brexit negotiations to move the a second stage. However, EU leaders warned that the negotiations on the new trade relationship and on a transition period might be very difficult. Even more, some issues on the divorce bill (Irish borders) will resurface. Sterling opened near the overnight 'ST top' against the euro and the dollar, but selling pressure mounted as the day proceeded. EUR/GBP trades in the 0.8840 area, reversing yesterday's decline. Cable trades in the 1.3325 area. For now, there is no indication that sterling will rise further just because Brexit negotiations move to a next stage.
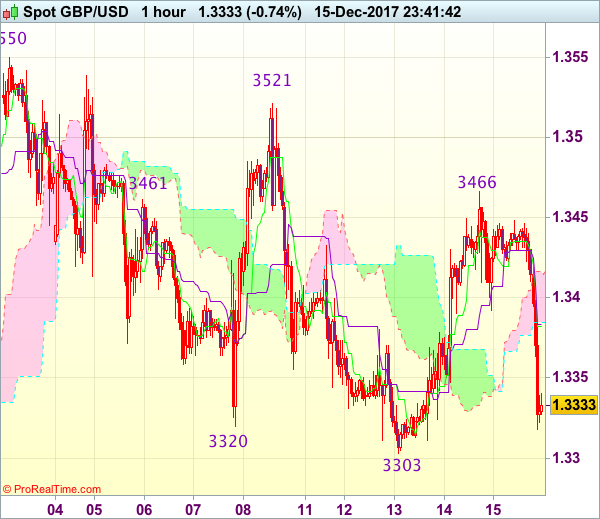
Trade Idea Wrap-up: GBP/USD – Sell at 1.3370
GBP/USD - 1.3311
Most recent candlesticks pattern : N/A
Trend : Sideways
Tenkan-Sen level : 1.3376
Kijun-Sen level : 1.3377
Ichimoku cloud top : 1.3416
Ichimoku cloud bottom : 1.3385
Original strategy :
Bought at 1.3350, stopped at 1.3315
Position : - Long at 1.3350
Target : -
Stop : - 1.3315
New strategy :
Sell at 1.3370, Target: 1.3270, Stop: 1.3405
Position : -
Target : -
Stop : -
Current cross-inspired selloff dampened our near term bullishness and signal the rebound from 1.3303 has ended at 1.3466, break of said support would confirm recent decline from 1.3550 top has resumed and may extend further weakness to 1.3280, then towards 1.3250, however, near term oversold condition should limit downside to previous support at 1.3221, bring recovery later.
In view of this, we are looking to sell cable on recovery as 1.3370-75 should limit upside and bring another decline. Above 1.3400 would defer and risk rebound to 1.3430-35 but said resistance at 1.3466 should remain intact and bring another decline later.
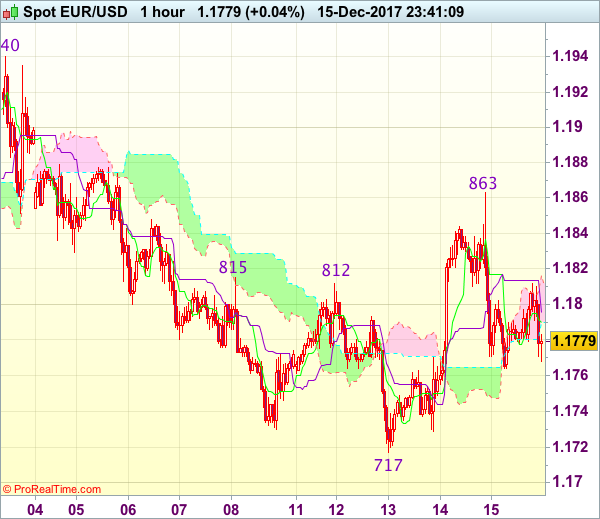
Trade Idea Wrap-up: EUR/USD – Stand aside
EUR/USD - 1.1774
Most recent candlesticks pattern : N/A
Trend : Near term down
Tenkan-Sen level : 1.1790
Kijun-Sen level : 1.1796
Ichimoku cloud top : 1.1816
Ichimoku cloud bottom : 1.1790
New strategy :
Stand aside
Position : -
Target : -
Stop : -
Despite yesterday brief bounce to 1.1863, lack of follow through buying and the subsequent sharp retreat suggest consolidation below this level would be seen and test of 1.1755-60 cannot be ruled out, however, reckon downside would be limited to 1.1730 and price should stay above this week’s low at 1.1717, bring another rebound later.
On the upside, whilst recovery to the Kijun-Sen (now at 1.1814) is likely, reckon upside would be limited to 1.1840 and said resistance at 1.1863 would hold. Only a break above this level would signal the rebound from 1.1717 is still in progress for further subsequent gain to 1.1880, then 1.1900 but price should falter well below resistance at 1.1940, bring retreat later. As near term outlook is mixed, would be prudent to stand aside for now.
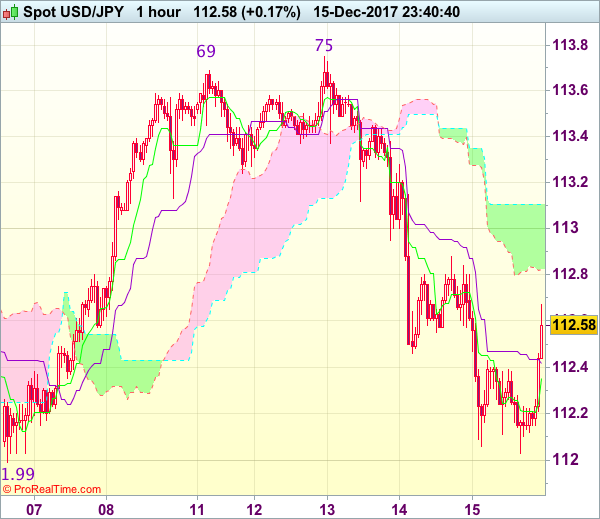
Trade Idea : USD/JPY – Stand aside
USD/JPY - 112.58
Most recent candlesticks pattern : N/A
Trend : Near term up
Tenkan-Sen level : 112.35
Kijun-Sen level : 112.42
Ichimoku cloud top : 113.11
Ichimoku cloud bottom : 112.82
New strategy :
Stand aside
Position : -
Target : -
Stop : -
As the greenback has rebounded after holding above previous support at 112.03, suggesting consolidation above indicated previous support at 111.99 would be seen and gain to the lower Kumo (now at 112.82) cannot be ruled out, however, reckon upside would be limited to 113.11-12 (current level of the upper Kumo and previous support) and bring another decline later.
On the downside, below 112.20-25 would bring another test of said support at 111.99 but break there is needed to retain bearishness and signal the rebound from 110.84 low has ended at 113.75, then the fall from there may extend weakness to 111.65-70 but reckon previous support at 111.41 would hold from here. As near term outlook is mixed, would be prudent to stand aside for now.
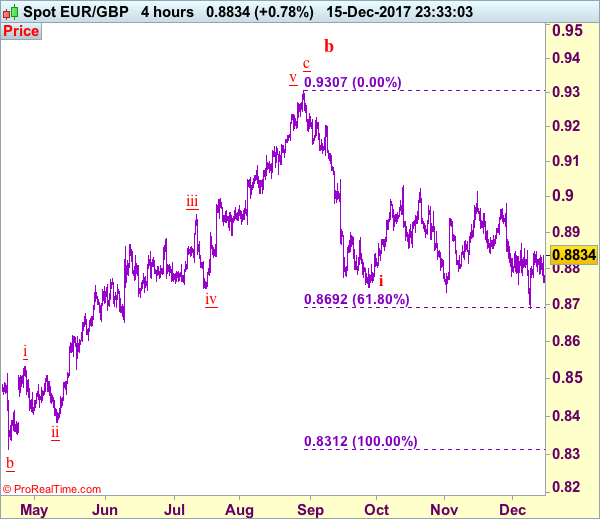
Trade Idea: EUR/GBP – Buy at 0.8810
EUR/GBP - 0.8834
Original strategy :
Buy at 0.8755, Target: 0.8855, Stop: 0.8720
Position : -
Target : -
Stop : -
New strategy :
Buy at 0.8810, Target: 0.8910, Stop: 0.8770
Position : -
Target : -
Stop : -
The single currency only slipped to 0.8760 (just missed our long entry at 0.8755) before finding renewed buying interest and the anticipated rally from there add credence to our view that low has possibly been formed at 0.8690 last week, consolidation with upside bias remains for a test of resistance at 0.8868, break above there would suggest the decline from 0.9015 has ended, bring further gain to 0.8890-00 and later towards 0.8930.
In view of this, we are still looking to buy euro on dips as 0.8800-10 should limit downside and bring another rebound. Below 0.8780 would risk retest of said support at 0.8760 but only break there would abort and signal top is formed instead, bring weakness to 0.8720-25 first.
Our preferred count is that, after forming a major top at 0.9805 (wave V), (A)-(B)-(C) correction is unfolding with (A) leg ended at 0.8400 (A: 0.8637, B: 0.9491 and 5-waver C ended at 0.8400. Wave (B) has ended at 0.9413 and impulsive wave (C) has either ended at 0.8067 or may extend one more fall to 0.8000 before prospect of another rally. Current breach of indicated resistance at 0.9043 confirms our view that the (C) leg has ended and bring stronger rebound towards 0.9150/54, then towards 0.9240/50.
Canadian Manufacturing Sales Fell Unexpectedly in October
Highlights:
- Manufacturing sales declined 0.4% with volume sales falling a larger 1.5%.
- A large drop in sales in the transportation sector - led by a pullback in motor vehicle sales - accounted for the bulk of the volumes drop.
- A build in inventories implies that production was not as weak as sales. We continue to assume GDP increased 0.1% in October and will rise 2.0% in Q4 as a whole.
Our Take:
The 0.4% dip in nominal manufacturing sales was despite an increase in prices. Sale volumes declined a larger 1.5% to almost entirely retrace increases over the prior two months. A large drop in the transportation sector - led by a 7.6% pullback in motor vehicle sales - accounted for the bulk of the drop in overall sale volumes. Motor vehicle sales were reportedly weak because of transitory production disruptions at some plants. A 1.1% drop in chemical sales was also surprisingly soft given an earlier reported 13% surge in chemical export volumes in October.
Challenges clearly remain in the manufacturing sector going forward, particularly given the possibility for a 'bad' outcome from ongoing NAFTA renegotiations. Nonetheless, there are also positives in terms of stronger growth in the U.S. industrial sector, which tends to import a lot from Canadian manufacturers, and a stronger domestic Canadian economy. Looking through monthly volatility, manufacturing sale volumes have been trending modestly higher, and were still up almost 3% on a year-over-year basis in October. In the very near-term, a build in inventories suggests that manufacturing production wasn't as weak as sales in October. The manufacturing component of GDP probably declined about half a percent in the month but offsetting strength in most services components should still allow for a modest increase in overall GDP in October to build on September's 0.2% increase.
GBPJPY Threatens Key 150 Level; Bearish Outlook
GBPJPY is clearly biased to the downside in the near term and has broken important support at 150.00. A daily close below this key level would strengthen the short term bearish tendency.
On the 4-hour chart, GBPJPY has also broken below the 200-period moving average which is located slightly below the 150.00 level.
The stochastic oscillator is indicating oversold conditions while the RSI has reached extreme levels. These signals suggest that GBPJPY could pause its decline at current levels before heading lower. The latest big bearish candle points to more softness in the market.
Under current conditions, GBPJPY will likely struggle to make a sustained recovery to the upside. Strong resistance is expected at 152.00. Before this level, there is soft resistance at 151.00 and near the 50-period moving average (151.25). Only a rise above 153.00 would shift the outlook to bullish.
The market holds a weak undertone for now and another leg lower cannot be ruled out. The next target would be 149.00 and then from here, major support at 148.00 comes into view. Below this area, the bigger picture becomes very bearish.