Sample Category Title
Forex Technical Analysis: EUR/USD, USD/JPY, GBP/USD
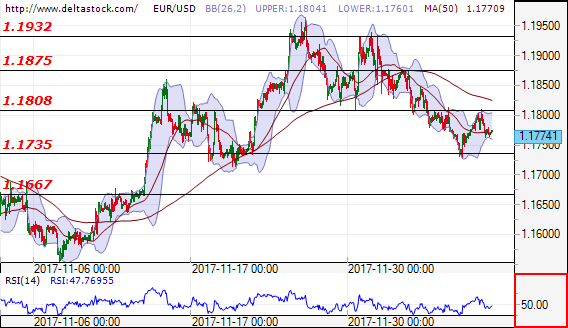
EUR/USD
Current level - 1.1774
After the unsuccessful breakthrough of the resistance level at 1.1808 the outlook is negative for test of the support level at 1.1735. In positive direction we may expect another test at 1.1808.
| Resistance | Support | ||
| intraday | intraweek | intraday | intraweek |
| 1.1808 | 1.1932 | 1.1735 | 1.1690 |
| 1.1875 | 1.2090 | 1.1667 | 1.1550 |
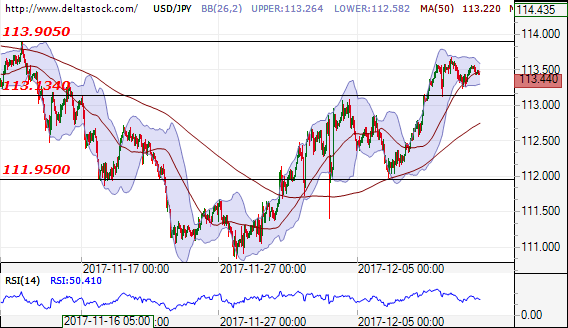
USD/JPY
Current level - 113.44
The forecast is positive for test of the resistance level at 113.90. The next resistance level will be at 114.48. In negative direction with breakthrough at 113.13, we may expect test at 111.95.
| Resistance | Support | ||
| intraday | intraweek | intraday | intraweek |
| 113.90 | 113.90 | 113.13 | 109.50 |
| 114.50 | 114.70 | 111.95 | 107.30 |
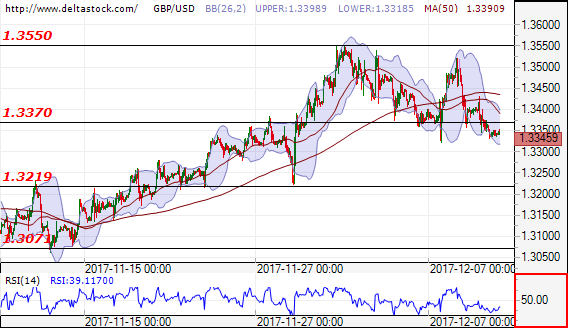
GBP/USD
Current level - 1.3345
The outlook is negative for test of the support level at 1.3219, after the successful breakthrough at 1.3370. In positive direction the next support will be at 1.3550.
| Resistance | Support | ||
| intraday | intraweek | intraday | intraweek |
| 1.3370 | 1.3460 | 1.3219 | 1.3219 |
| 1.3550 | 1.3660 | 1.3071 | 1.3020 |
USDCAD Cup And Handle Formation On Intraday Charts
The USD/CAD has formed a cup and handle formation, and the price is consolidating between Daily camarilla levels. Because the handle in this pattern formation usually has a downward slope, we might see a break below 1.2830 towards 1.2816 and 1.2779. However h1 momentum or 4h close above 1.2864 could target 1.2892, 1.2911 and 1.2939. Watch for a handle break and continuation towards mentioned targets.
USD/JPY Elliott Wave Analysis
USD/JPY - 113.40
USD/JPY – Wave V of larger degree circle V has possibly ended at 75.31 and major correction has commenced and already met indicated target at 125.00.
The greenback found renewed buying interest at 111.99 and has rallied again, suggesting the rebound from 110.84 is still in progress and may extend gain to 113.91 resistance, break there would signal the pullback from 114.74 has ended at 110.84, bring further rise to 114.30-35, then retest of said recent high which is likely to hold on first testing and price should falter below 115.00-10.
Our preferred count is that, triangle wave IV (with circle) ended at 101.45 and the circle wave V brought dollar down to the record low of 75.31 in 2011 and the subsequent rebound signal major correction has commenced with A leg ended at 84.19, followed by wave B at 77.14 and impulsive wave C is now unfolding (indicated upside target at 125.00 had been met) for gain towards 127.00 level. In the event dollar drops below support at 99.01, this would confirm medium term decline from 125.86 top (2015 high) has resumed for subsequent weakness to 98.00 and possibly 97.00.
Under this count, this wave C is unfolding as impulsive waves with (1) (2), 1 2 ended at 80.67, 79.07, 82.84 and 81.69 respectively, hence the extended wave 3 has ended at 103.74 and wave 4 correction of recent upmove should bring weakness to 92.57, then towards 90.88 but psychological support at 90.00 should limit downside and bring another rally later in wave 5, indicated target at 125.00 had been met and gain to 127.00 cannot be ruled out but reckon price would falter below 130.00.
On the downside, whilst initial pullback to 112.90-00 cannot be ruled out, reckon said support at 111.99 would limit downside and bring another rise later. Below 111.99 would risk test of support at 111.41 but a daily close below there is needed to signal the rebound from 110.84 has ended, then retest of this support would follow, a drop below this level would revive bearishness and extend the fall from 114.74 top to 110.50, then 110.00.
Recommendation: Buy at 112.00 for 114.00 with stop below 111.00.
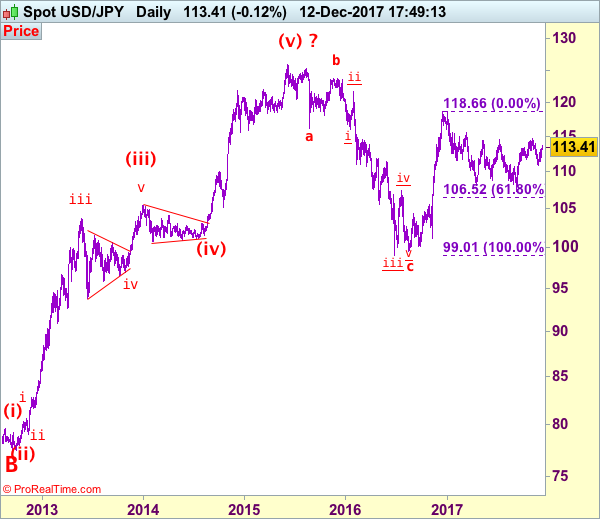
On the monthly chart, we have changed our preferred count that an impulsive wave is unfolding with major wave III with circle ended at 79.75, then followed by wave IV with circle and is labeled as a triangle with A: 147.64 (11 August, 1998), B: 101.25, C: 135.20, D: 101.67 and E leg ended at 124.14 to end the wave IV with circle. Hence, wave V with circle commenced from there and hit a record low of 75.31, however, the subsequent strong rebound signals this circle wave V has possibly ended there, hence gain to (indicated upside target at 122.00 and 125.00 had been met), the retreat from 125.86 suggests wave A of major correction has ended there and wave B correction back to 99.00, then 95.00 would be seen, however, reckon downside would be limited to 90.00, bring another rebound in wave C next year.

Technical Outlook: USDJPY – Corrective Dips To Precede Fresh Upside
The pair is in red in early Tuesday’s trading after Monday’s action ended in Doji candle, unable to sustain gains above daily cloud.
Additional negative signal comes from slow stochastic which turns south in deep overbought territory, suggesting corrective action before broader bulls resume.
Fresh easing probes below daily cloud top (113.51) and dips are expected to find support at 113.10 zone (Friday’s low / base of thick hourly cloud).
Dip-buying scenario remains favored for attack at next target at 113.81 (Fibo 76.4% of 114.73/110.83 descend) and probes above 114.00 barrier in extension.
Res: 113.68, 113.81, 114.45, 114.73
Sup: 113.25, 113.10, 112.75, 112.35
Technical Outlook: GBPUSD – UK CPI Data In Focus
Cable ticked higher on Tuesday after strong fall on Monday which generated bearish signal on close below 1.3354 (Fibo 38.2% of 1.3038/1.3549 ascend). Pound received support from political news on Tuesday, but focus is at UK inflation data. CPI is forecasted at 3.0% in Nov, unchanged from the previous month, but weaker than expected release could increase pressure on sterling and risk retest of 1.3330/19 (lows of Monday/07 Dec) and psychological 1.3300 support (also daily Kijun-sen), break of which will be strong bearish signal. Bullish scenario requires inflation data above forecast and lift above 10SMA /Monday's high (1.3430) for fresh bullish signal.
Res: 1.3363, 1.3400, 1.3430, 1.3445
Sup: 1.3330, 1.3300, 1.3254, 1.3233
Trade Idea: AUD/USD – Exit short entered at 0.7620
AUD/USD – 0.7560
Original strategy:
Sold at 0.7620, Target: 0.7470, Stop: 0.7660
Position: - Short at 0.7620
Target: - 0.7470
Stop:- 0.7660
New strategy :
Exit short entered at 0.7620
Position: - Short at 0.7620
Target: -
Stop:-
Aussie continued finding support at 0.7501 and has staged a strong rebound today, suggesting a temporary low has possibly been formed there and consolidation with mild upside bias is seen for gain to 0.7600, however, break there is needed to add credence to this view, bring retracement of recent decline to 0.7625-30, then towards resistance at 0.7654 which is likely to hold from here.
In view of this, would be prudent to stand aside for now. Below said support at 0.7501 would revive bearishness and extend recent decline to from 0.8125 top to 0.7470, however, oversold condition would limit downside to 0.7440 and price should stay above 0.7390-00.
On the 4-hour chart, recent upmove from 0.7329 is unfolding as an impulsive rise with wave 3 as well as smaller degree wave (iii) extending, only minor wave v of (iii) has ended at 0.8125, hence bullishness remains for this move to extend headway to 0.8200, then towards 0.8300, however, reckon upside would be limited to 0.8400 and the final wave 5 should falter below 0.8500, bring correction later.

EUR/CAD 1H Chart: Fails To Move Higher In Channel
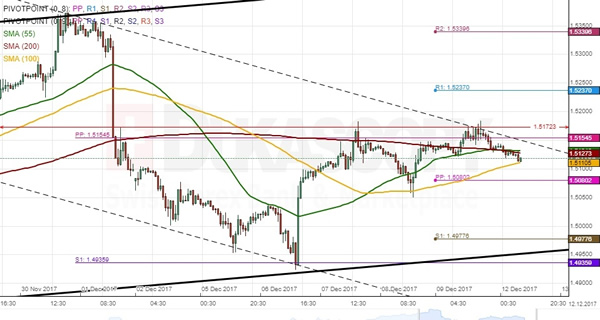
The common European currency has been trading in a neat channel up against the Loonie since September 1. The pair managed to test both boundaries during the past two weeks, thus forming a junior channel down. This short-term pattern, however, is unlikely to hold for long due to its steepness. After testing the monthly S1 at 1.4936 on December 6, the Euro tried to initiate a new wave up, but it failed to move past the 1.5172 mark on two separate occasions. It shows that the rate could still try to surpass this level within the following sessions. Given that the southern side is guarded by a significant support area, this might sent the pair for a period of consolidation. By and large, it is expected that the Euro breaches the aforementioned resistance this week and edges higher.
USD/NOK 1H Chart: Greenback Re-Tests Channel
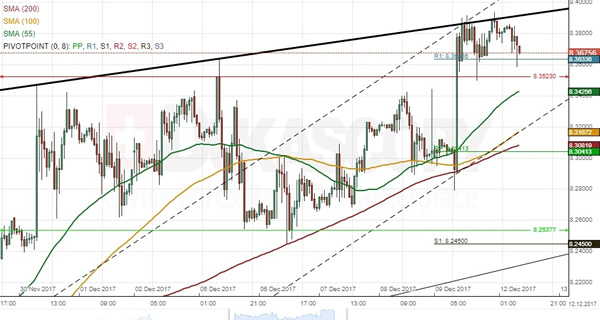
The US Dollar has been appreciating against the Norwegian Krone in a channel up for the last four months. The trading range within this pattern, however, shifted upwards when the rate failed to reach the bottom channel boundary three weeks ago. The same situation occurred last week. As apparent on the chart, the Greenback was trading between 8.2538 and 8.3523 since late November. A massive surge last week breached this range and allowed for a re-test of the upper channel boundary circa 8.39. Technical indicators suggest that the rate might either move lower or remain near 8.38 during the following day. The nearest resistance is the weekly R2 at 8.4225, while support is set by the weekly R1 and the upper trend-line at 1.3634 and 8.3523, respectively. It is likely that the US Dollar starts weakening during the second half of this week, thus approaching the 200– and 100-hour SMAs and the weekly PP circa 8.31.
EURUSD Analysis: Remains Steady
Yesterday's trading session ended exactly as expected. Initially, the Euro was climbing against the Dollar. However, once the currency rate has reached combined resistance formed by the weekly and monthly PP at 1.1806 as well as the upper boundary of a junior descending channel, it was forced to retreat back to the 55-hour SMA. As all eyes are turned to the upcoming Fed meeting, the pair is not expected to make significant moves today as well. In other words, it is likely to continue fluctuating between the above barrier from the top and the 38.2% Fibonacci retracement level located at 1.1760 from the bottom. A release of the American PPI data might push the rate a little bit lower. But even in that case it is expected to stay above the 1.1730 support zone.
GBPUSD Analysis: Slides To 1.3338
In result of the previous trading session the cable made a rebound from a combination of the 55-, 100- and 200-hour SMAs as well as the weekly PP at 1.3415 just as expected.
Even though traders are mainly focused on the upcoming decision on interest rate hike, there is also a need to take into account an effect from release of information on the UK inflation. In case of match with expectations, the Pound might temporarily jump back to the above resistance barrier. In the opposite case, bears are likely to push it down to the 1.3300 mark. So, depending on the released data, the currency rate might start tomorrow’s trading day either near the monthly PP at 1.3372 or the weekly S1 at 1.3290.