Sample Category Title
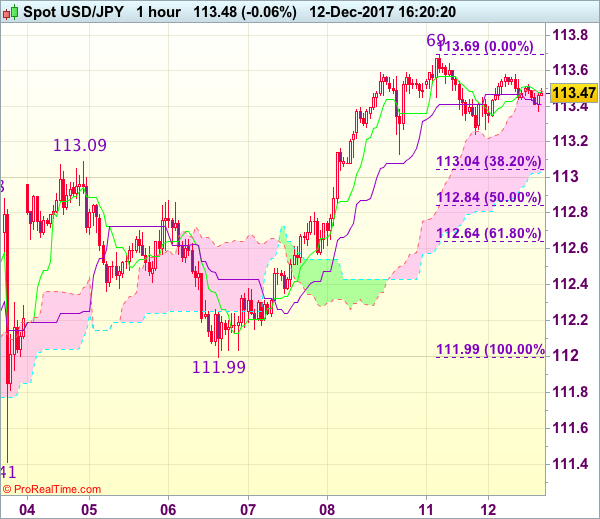
USDJPY Analysis: Exits From Falling Wedge Pattern
During yesterday's trading session the currency exchange rate made two attempts to break to the bottom towards the 50% retracement level located at 113.00.
However, as markets focused on tomorrow's Fed meeting, the pair failed to bypass even the 55-hour SMA that was backing up the lower trend-line of another rising wedge formation. And only in the early morning it managed to sneak below the 113.47 mark. Accordingly, until release of information on the American PPI the pair is expected to continue moving in southern direction and trying to reach the bottom edge of a new junior descending channel that lies slightly above the major support zone located between the 113.11 and 113.00 marks.
XAUUSD Analysis: Falls To 50% Fibo
In line with expectations, the falling 55-hour SMA did allow the bullion to recover against buck. As a result, the rate was forced to find support at the 50% Fibonacci retracement level located at 1,240.30. In early hours of this trading session bulls made another attempt to inch the price of yellow metal higher. But this endeavour is expected to fail as well due to combined resistance barrier formed by the above 55-hour SMA and the monthly S2 at 1,246.74. Accordingly, the bearish momentum is likely to continue at least until the Fed meeting that will happen tomorrow.
An aggregate of technical indicators supports this scenario via sending sell signal for the rest of the day.
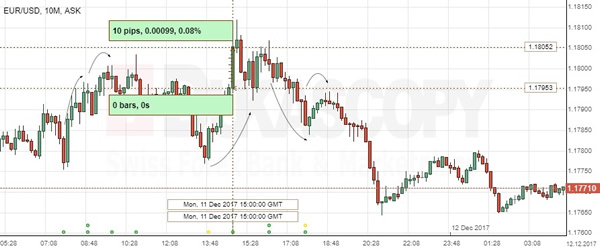
EUR/USD: JOLTS Job Openings
The Greenback depreciated against the Euro on a slightly weaker number of job openings for October reported on Monday. The EUR/USD exchange rate rose 10 base points to the intraday high at 1.1805. Though, the pair lost all gains to continue trading session nearing 1.1770.
The Labour Department stated that the US job openings cooled unexpectedly in the month of October from a record-high registered previosly. According to the JOLTS survey, the number of jobs expecting to be filled dropped 181K to 6.00M, following an upwardly revised 6.18M in the prior month. Meanwhile, the number of hirings grew to 5.55M, with the most of increase coming from hitel and restaurants, the health care industry, financial services and manufacturing.
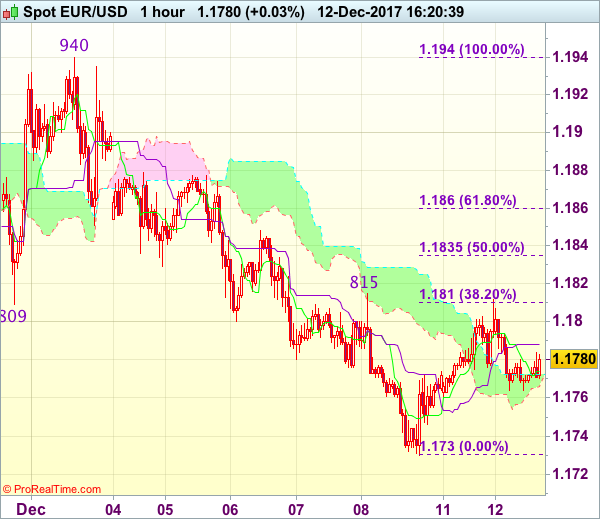
Technical Outlook: EURUSD – Choppy Trading Within The Cloud Ahead Of FOMC
The Euro remains constructive on Tuesday and attempts higher again after Monday's recovery stalled at 1.1810 pivot (Fibo 38.2% of 1.1940/1.1730 downleg) and subsequent pullback returned to key support at 1.1756, provided by 55SMA. The pair is holding in the middle of thick daily cloud (spanned between 1.1706 and 1.1833) with the action being supported by formation of 30/55 SMA bull-cross. Plethora of barriers between 1.1810 and 1.1823 (Fibo 38.2%/daily cloud top/converged 10/20SMA's) marks strong resistance zone, break of which is needed to signal recovery extension. Daily studies are bullishly aligned and support scenario, however, the pair is likely to stay in a choppy mode until FOMC meeting on Wednesday. Meantime, releases of ZEW data today (Germany 18.0 f/c vs 18.7 in Nov and EU 30.2f/c vs 30.9 Nov) would influence near-term action on surprise.
Res: 1.1810, 1.1823, 1.1835, 1.1860
Sup: 1.1760, 1.1730, 1.1706, 1.1650

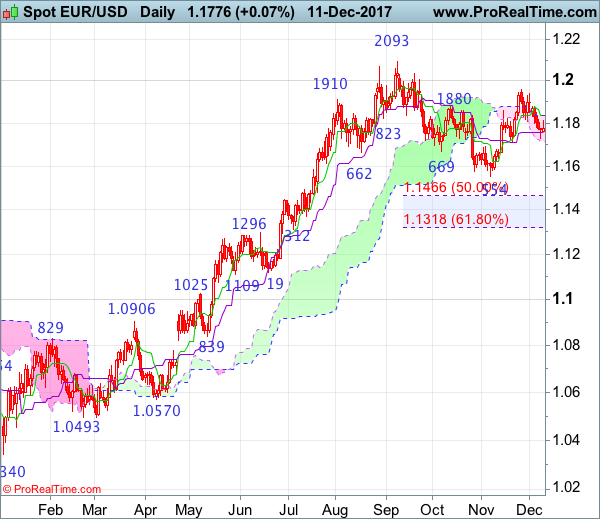
EUR/USD Candlesticks and Ichimoku Analysis
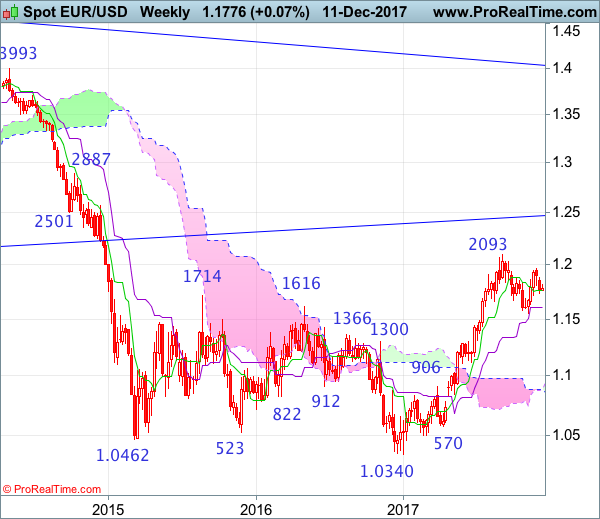
Weekly
• Last Candlesticks pattern: Shooting star
• Time of formation: 31 Jul 2017
• Trend bias: Near term up
Daily
• Last Candlesticks pattern: Shooting star
• Time of formation: 2 Aug 2017
• Trend bias: Up
EUR/USD – 1.1789
Although the single currency fell to as low as 1.1730 late last week, the quick rebound from there suggests consolidation above this level would be seen and initial upside risk remains for another bounce to the Tenkan-Sen (now at 1.1835), however, reckon resistance at 1.1877-79 would limit upside and bring another decline later, below said support at 1.1730 would signal the fall from 1.1961 top is still in progress and bring test of 1.1713 support. Once this level is penetrated, this would signal the rebound from 1.1554 has ended, bring further fall to 1.1650-60, then towards 1.1600 but said support at 1.1554 should remain intact.
On the upside, whilst recovery to the Tenkan-Sen (now at 1.1835) cannot be ruled out, reckon upside would be limited to 1.1900 and bring another decline to aforesaid downside targets. Above indicated resistance at 1.1940 would risk retest of recent high at 1.1961 but only break there would signal the rise from 1.1554 is still in progress and extend gain to 1.2005. Looking ahead, above there would confirm recent upmove has resumed for retest of 1.2093, break there would extend the rise from 1.0340 low to 1.12150-55 first.
Recommendation: Sell at 1.1880 for 1.1680 with stop above 1.1980.
On the weekly chart, as euro has retreated after faltering below resistance at 1.1961, retaining our view that further consolidation below this level would be seen and below 1.1730 would bring test of previous support at 1.1713 but break there is needed to signal the rebound from 1.1554 has ended, bring weakness to 1.1650-60, then towards said support at 1.1554 which is likely to hold from here. A drop below said support at 1.1554 would signal a temporary top has been formed at 1.2093, bring retracement of recent rise to 1.1500, then 1.1466 (50% Fibonacci retracement of 1.0839-1.2093) but reckon downside would be limited to 1.1400 and 1.1312-18 (previous support and 61.8% Fibonacci retracement) should hold, price should stay above previous minor resistance at 1.1296, bring another rebound.
On the upside, expect recovery to be limited to 1.1880-85 and resistance at 1.1940 should hold, bring another retreat. Above said resistance at 1.1961 would revive bullishness and signal early pullback from 1.2093 has ended at 1.1554, bring further gain to 1.2005, once this level is penetrated, this would confirm early rise from 1.0340 low has resumed for retest of 1.2093, above there would extend headway to 1.2150-55, then 1.2200-10 later.
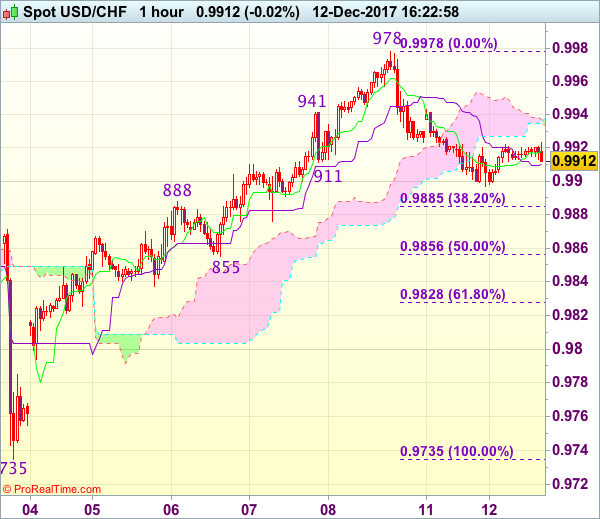
Trade Idea : USD/CHF – Buy at 0.9860
USD/CHF - 0.9896
Most recent candlesticks pattern : N/A
Trend : Near term up
Tenkan-Sen level : 0.9909
Kijun-Sen level : 0.9909
Ichimoku cloud top : 0.9937
Ichimoku cloud bottom : 0.9935
Original strategy :
Buy at 0.9860, Target: 0.9970, Stop: 0.9825
Position : -
Target : -
Stop : -
New strategy :
Buy at 0.9860, Target: 0.9970, Stop: 0.9825
Position : -
Target : -
Stop : -
As the greenback has slipped again in European morning, retaining our view that further consolidation below resistance at 0.9780 would be seen and pullback to 0.9885 (38.2% Fibonacci retracement of 0.9735-0.9978) is likely, however, reckon 0.9855-60 (50% Fibonacci retracement) would hold and bring another rise later, above 0.9945-50 would suggest the retreat from 0.9978 has ended, bring retest of this level, break there would signal recent upmove has resumed and extend gain to 1.0000 but price should falter below recent high at 1.0038.
In view of this, would not chase this rise here and we are looking to buy dollar on subsequent pullback as 0.9855 support should contain downside. Only below 0.9825-30 (61.8% Fibonacci retracement of 0.9735-0.9978) would abort and signal top has been formed, bring further fall to 0.9800.
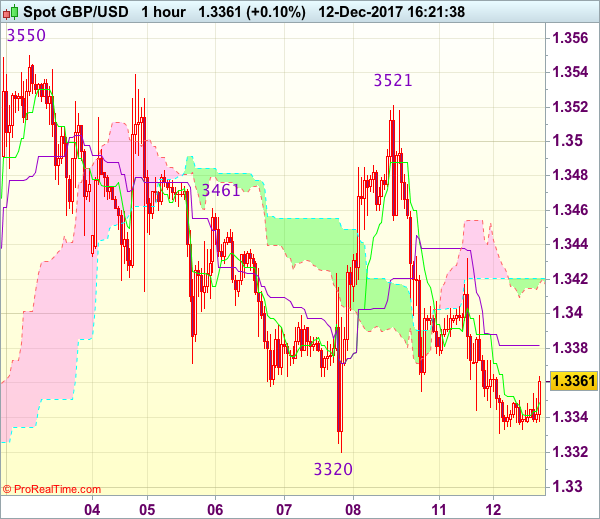
Trade Idea : GBP/USD – Stand aside
GBP/USD - 1.3362
Most recent candlesticks pattern : N/A
Trend : Sideways
Tenkan-Sen level : 1.3349
Kijun-Sen level : 1.3382
Ichimoku cloud top : 1.3421
Ichimoku cloud bottom : 1.3418
New strategy :
Stand aside
Position : -
Target : -
Stop : -
Although cable’s retreat from 1.3521 has kept sterling under pressure and near term downside risk remains for weakness towards 1.3320 support, however, as outlook remains consolidative, reckon downside would be limited and further choppy trading would take place. Only a drop below this level would revive bearishness and signal top has been formed at 1.3550 earlier, bring retracement of recent rise to 1.3290-00 first.
On the upside, expect recovery to be limited to 1.3400 and the Ichimoku (now at 1.3418-21) should hold, bring another decline later. Above resistance at 1.3432 would bring a stronger rebound to 1.3475–80 but still reckon resistance at 1.3521 would hold from here, bring retreat later. As near term outlook is mixed, would be prudent to stand aside for now.
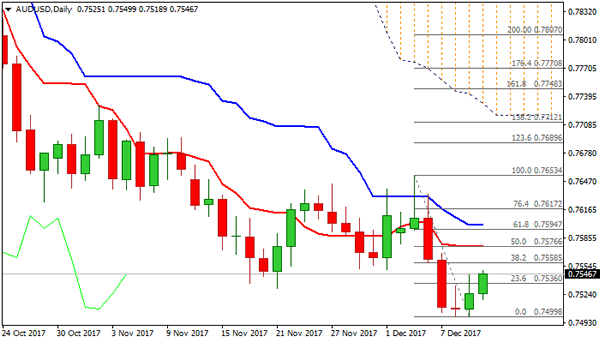
Technical Outlook: AUDUSD Extends Recovery Despite Weak Australian Data
The Australian dollar extended recovery on Tuesday and pressuring pivotal barrier at 0.7560 (falling 10SMA/Fibo 38.2% of 0.7653/0.7499 downleg).
The Aussie rose despite weaker than expected Australian data released on Tuesday, showing the business confidence fell in November and hit the lowest since August, while House Price Index was well below expectations in Q3 and at the lowest level since Q1 2016.
Weaker sentiment of US dollar ahead of tomorrow's FOMC policy meeting was the main driver of antipodean currencies in past two sessions.
Completion of Doji reversal pattern on Monday and Tuesday's fresh extension higher signal further recovery on break above 0.7560 pivot.
Bullish hourly studies are supportive, however, negative daily techs see risk of limited correction before larger bears resume.
Next pivotal barriers lay at 0.7576 (daily Tenkan-sen) and 0.7600 (daily Kijun-sen) and sustained break here would neutralize existing bearish threats for extended correction towards key near-term barrier at 0.7653 (05 Dec high).
Otherwise, near-term bias is expected to stay with bears on limited recovery scenario and keep key supports at 0.7500 (n/t base) and 0.7478 (trendline support) at risk.
Res: 0.7560, 0.7576, 0.7600, 0.7653
Sup: 0.7518, 0.7500, 0.7478, 0.7440
Trade Idea : EUR/USD – Sell at 1.1835
EUR/USD - 1.1788
Most recent candlesticks pattern : N/A
Trend : Near term down
Tenkan-Sen level : 1.1777
Kijun-Sen level : 1.1788
Ichimoku cloud top : 1.1773
Ichimoku cloud bottom : 1.1766
Original strategy :
Sell at 1.1835, Target: 1.1735, Stop: 1.1870
Position : -
Target : -
Stop : -
New strategy :
Sell at 1.1835, Target: 1.1735, Stop: 1.1870
Position : -
Target : -
Stop : -
Although the single currency retreated after meeting resistance at 1.1812, recon 1.1755-60 would limit downside and near term upside risk remains for another corrective bounce to said resistance, then towards 1.1835 (50% Fibonacci retracement of 1.1940-1.1730), however, reckon upside would be limited and bring retreat later, below 1.1755-60 would bring retest of 1.1730 but break of this support is needed to confirm recent decline has resumed and extend weakness to previous key support at 1.1713. Looking ahead, only break there would retain bearishness for subsequent decline towards 1.1660-70.
In view of this, we are looking to sell euro on further subsequent recovery as said resistance at 1.1815 should limit upside and bring another decline. Above 1.1845-50 would defer and suggest low is formed, bring a stronger rebound to 1.1875-80 first.
Trade Idea : USD/JPY – Buy at 112.90
USD/JPY - 113.45
Most recent candlesticks pattern : N/A
Trend : Near term up
Tenkan-Sen level : 113.48
Kijun-Sen level : 113.41
Ichimoku cloud top : 113.49
Ichimoku cloud bottom : 113.03
Original strategy :
Buy at 112.90, Target: 114.00, Stop: 112.55
Position : -
Target : -
Stop : -
New strategy :
Buy at 112.90, Target: 114.00, Stop: 112.55
Position : -
Target : -
Stop : -
Dollar’s retreat after rising to 113.69 yesterday has retained our view that consolidation below this level would be seen and pullback to 113.00-05 (38.2% Fibonacci retracement of 111.99-113.69), however, reckon 112.80-85 (50% Fibonacci retracement) would hold and bring another rise later, above said resistance at 113.69 would extend recent rise from 110.84 low to resistance area at 113.91-114.07 but a sustained breach above this region is needed to signal early uptrend has resumed for headway to 114.34.
In view of this, would not chase this rise here and would be prudent to buy dollar again on pullback as 112.90-00 should limit downside and bring another rise later. Below 112.80-85 (50% Fibonacci retracement of 111.99-113.69) would defer and risk test of 112.55-60 but only break of latter level would signal top is formed instead, bring subsequent fall to 112.20-25.