Sample Category Title
Euro Trading A Tad Lower, Ahead Of The ZEW Economic Sentiment Survey
For the 24 hours to 23:00 GMT, the EUR slightly declined against the USD and closed at 1.1773.
On the macro front, Italy’s seasonally adjusted retail sales unexpectedly eased 1.0% on a monthly basis in October, dipping to its lowest in over a year and compared to market expectations for a fall of 0.1%. In the previous month, retail sales had recorded a revised rise of 0.8%.
In the US, data revealed that JOLTs job openings fell more-than-expected to a level of 5996.0K in October, compared to a revised level of 6177.0K in the previous month. Markets were anticipating for a drop to a level of 6135.0K.
In the Asian session, at GMT0400, the pair is trading at 1.1769, with the EUR trading marginally lower against the USD from yesterday’s close.
The pair is expected to find support at 1.1751, and a fall through could take it to the next support level of 1.1734. The pair is expected to find its first resistance at 1.1799, and a rise through could take it to the next resistance level of 1.1830.
Trading trend in the Euro today is expected to be determined by the release of the ZEW economic sentiment index for December across the Euro-zone, scheduled in a few hours. Moreover, the US NFIB small business optimism index and monthly budget statement, both for November, due to release later in the day, will be on investors’ radar.
The currency pair is trading below its 20 Hr moving average and showing convergence with its 50 Hr moving average.

Pound Trading A Tad Lower, Ahead Of Key Inflation Data In The UK
.
For the 24 hours to 23:00 GMT, the GBP declined 0.39% against the USD and closed at 1.3343.
In the Asian session, at GMT0400, the pair is trading at 1.3339, with the GBP trading slightly lower against the USD from yesterday’s close.
The pair is expected to find support at 1.3303, and a fall through could take it to the next support level of 1.3267. The pair is expected to find its first resistance at 1.3403, and a rise through could take it to the next resistance level of 1.3467.
Going ahead, market participants would direct their attention to UK’s crucial consumer price inflation figures for November, due to release in a few hours.
The currency pair is trading below its 20 Hr and 50 Hr moving averages.

Japan’s Tertiary Industry Index Sharply Rebounded In October
For the 24 hours to 23:00 GMT, the USD declined 0.08% against the JPY and closed at 113.54.
In the Asian session, at GMT0400, the pair is trading at 113.51, with the USD trading marginally lower against the JPY from yesterday's close.
Early morning data showed that Japan's tertiary industry index rebounded 0.3% on a monthly basis in October, beating market expectations for a rise of 0.2%. In the prior month, the index had recorded a drop of 0.2%.
The pair is expected to find support at 113.29, and a fall through could take it to the next support level of 113.06. The pair is expected to find its first resistance at 113.69, and a rise through could take it to the next resistance level of 113.86.
Looking forward, Japan's machinery orders for October, scheduled to release overnight, will be eyed by investors.
The currency pair is showing convergence with its 20 Hr and 50 Hr moving averages.

Swiss Franc Trading Flat In The Asian Session
For the 24 hours to 23:00 GMT, the USD declined 0.07% against the CHF and closed at 0.9918.
In economic news, Switzerland’s total sight deposits edged down to a level of CHF575.9 billion in the week ended 08 December, compared to CHF576.8 billion in the previous week.
In the Asian session, at GMT0400, the pair is trading at 0.9918, with the USD trading flat against the USD from yesterday’s close.
The pair is expected to find support at 0.9902, and a fall through could take it to the next support level of 0.9885. The pair is expected to find its first resistance at 0.993, and a rise through could take it to the next resistance level of 0.9941.
With no macroeconomic releases in Switzerland today, investor sentiment would be governed by global macroeconomic events.
The currency pair is trading between its 20 Hr and 50 Hr moving averages.

Loonie Trading A Tad Higher In The Morning Session
For the 24 hours to 23:00 GMT, the USD marginally rose against the CAD and closed at 1.2857.
In the Asian session, at GMT0400, the pair is trading at 1.2853, with the USD trading slightly lower against the CAD from yesterday’s close.
The pair is expected to find support at 1.2833, and a fall through could take it to the next support level of 1.2813. The pair is expected to find its first resistance at 1.2871, and a rise through could take it to the next resistance level of 1.2889.
In the absence of key macroeconomic releases in Canada today, trading trend in the CAD is expected to be determined by global macroeconomic factors.
The currency pair is showing convergence with its 20 Hr and 50 Hr moving averages.

Elliott Wave View: Dow Future
Dow Future Short Term Elliott Wave view suggests that the decline to 23205 ended Intermediate wave (4). Intermediate wave (5) is in progress as an Ending Diagonal Elliott Wave structure where Minor wave 1 ended at 24536 and Minor wave 2 ended at 24073. The Index still needs to break above Minor wave (1) at 24536 to add validity to the view. Until then, a double correction in Minor wave 2 still can't be ruled out.
Near term, rally from 24073 low remains in progress as 5 waves and more upside is expected before Minute wave ((i)) ends. Index should then pullback in Minute wave ((ii)) in 3, 7, or 11 swing to correct cycle from 12/7 low (24073) before the rally resumes. We don't like selling the pullback and expect Index to find buyers in pullback in 3, 7, or 11 swing against 24073 low in the first degree, but more importantly against 11/15 low (23191).
YM_F Dow Future 1 Hour Elliott Wave Chart
AUD/USD Upsides Remain Limited By 0.7550-0.7575
Key Highlights
- The recent decline in the Aussie Dollar looks real below 0.7600 against the US Dollar.
- AUD/USD broke a key ascending channel at 0.7570 on the 4-hours chart, which is a strong bearish signal.
- Australia's House Price index in Q3 decreased 0.2% (QoQ), compared with the +0.5% forecast.
- Today's main highlight would be the UK Consumer Price Index for Nov 2017 (forecast +3.0%, versus previous +3.0%, YoY)
AUDUSD Technical Analysis
December 2017 brought a lot of weakness for the Aussie Dollar as AUD/USD declined below 0.7600. The pair is currently correcting higher, but upsides remain capped by 0.7550-0.7575.
There was a start of a major downside move from 0.7650 where the pair faced a strong resistance and the 200 simple moving average (green, 4-hour). The pair tumbled and broke a key ascending channel at 0.7570 on the 4-hours chart.
The pair is now trading well below 0.7600 and the 100 simple moving average (red, 4-hour). The recent low was formed at 0.7503 before a recovery was initiated. Buyers managed to push the pair a few pips higher, but they are likely to face many hurdles starting from 0.7540.
The mentioned 0.7540 is around the 23.6% Fib retracement level of the last drop from the 0.7653 high to 0.7503 low. The most important resistance on the upside is near 0.7575 and the 100 SMA. The stated 0.7575 resistance is the 50% Fib retracement level of the last drop from the 0.7653 high to 0.7503 low.
Therefore, any recoveries toward 0.7550 and 0.7575 will most likely face a strong selling interest. On the downside, a break of the 0.7500 support could accelerate decline towards 0.7440.
Australia's House Price Index
Today's Asian session saw the release of Australia's House Price index for Q3 2017. The result was on the lower side as there was a decline of 0.2% in the index (QoQ) whereas the market was looking for an increase of 0.5%. In terms of the yearly change, there was a rise of 8.3%, less than the last +10.2%.
The market is waiting patiently for the next fed interest rate decision, scheduled later this week. It could impact the greenback to a great extent and we can already see that the dollar pairs such as EUR/USD gained bullish momentum due to profit taking. There was an impact on USD/JPY as well, which corrected lower from the 113.70 swing high, but remains supported above 112.80.
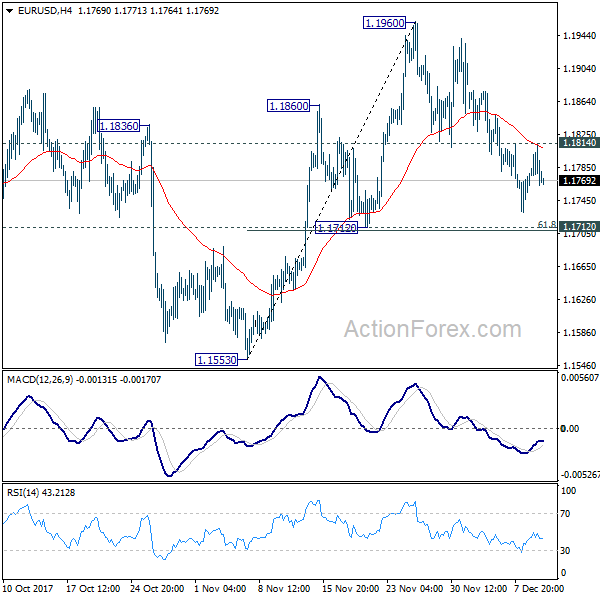
EUR/USD Daily Outlook
Daily Pivots: (S1) 1.1750; (P) 1.1780 (R1) 1.1799; More....
Intraday bias in EUR/USD remains neutral at this point. Focus stays on 1.1712 cluster support (61.8% retracement of 1.1553 to 1.1960 at 1.1708). Decisive break there will indicate that rebound from 1.1553 has completed at 1.1960. In that case, deeper fall would be seen to 1.1553 and possibly below to extend the decline from 1.2091. Meanwhile, with 1.1712 support intact, break of 1.1814 minor resistance will retain near term bullishness. And in that case, intraday bias will be turned back to the upside for 1.1960. Break will target 1.2091 high.
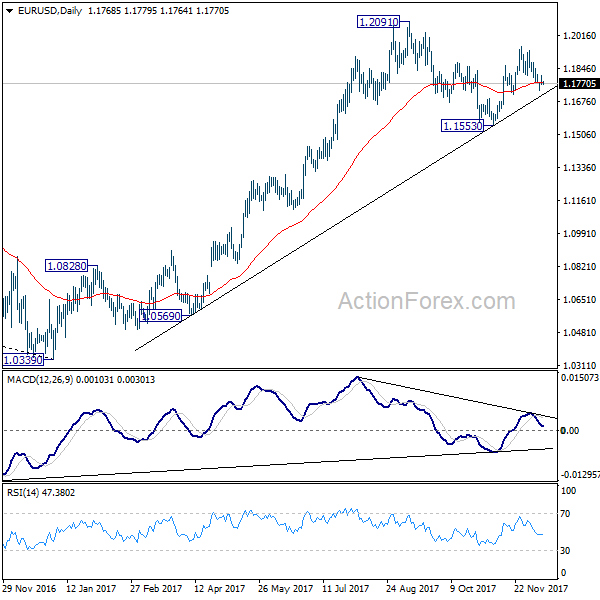
In the bigger picture, rise from 1.0339 medium term bottom is seen as a corrective move for the moment. Therefore, in case of another rally, we'd be expect 38.2% retracement of 1.6039 (2008 high) to 1.0339 (2017 low) at 1.2516 to limit upside and bring reversal. Meanwhile, sustained trading below 55 week EMA (now at 1.1423) will suggest that such medium term rebound is completed and could then bring retest of 1.0339 low.
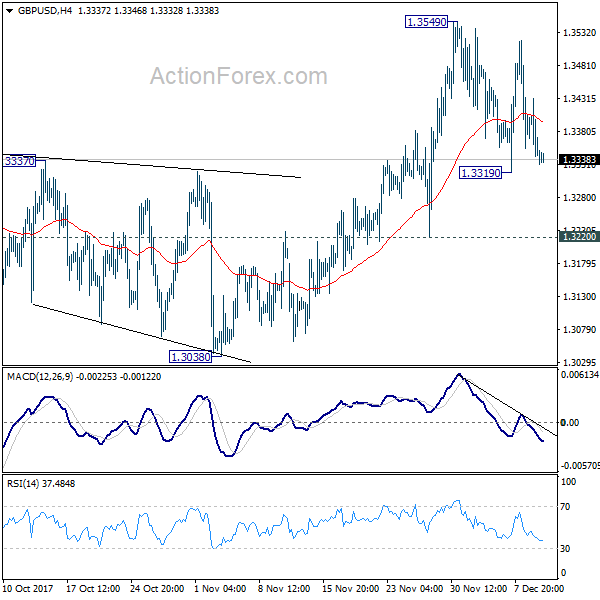
GBP/USD Daily Outlook
Daily Pivots: (S1) 1.3302; (P) 1.3366; (R1) 1.3403; More....
GBP/USD is staying in corrective trading below 1.3549 and intraday bias remains neutral first. As long as 1.3220 support holds, we'd continue to favor another rise. On the upside, break of 1.3549 will target 1.3651 high next. However, firm break of 1.3220 will turn near term outlook bearish for 1.3038 key support level.
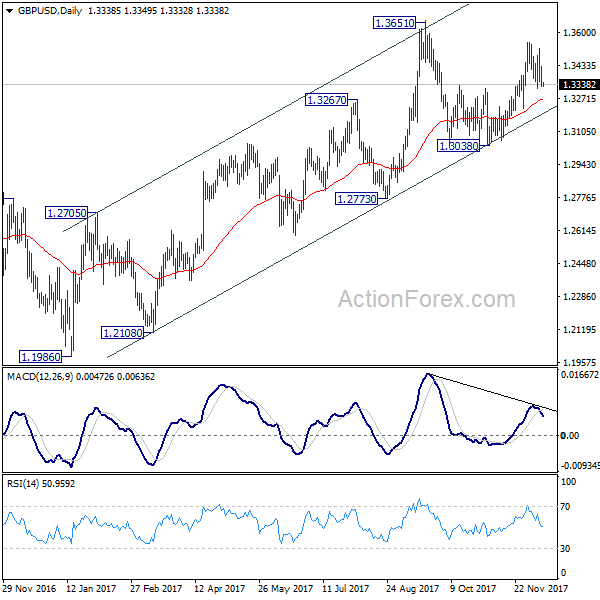
In the bigger picture, while the medium term rebound from 1.1946 low was strong, it's limited below 1.3835 key support turned resistance. As long as 1.3835 holds, we'd view such rebound as a correction. That is, we'd expect another leg in the long term down trend through 1.1946 low. However, sustained break of 1.3835 should at least send GBP/USD to 38.2% retracement of 2.1161 (2007 high) to 1.1946 (2016 low) at 1.5466.
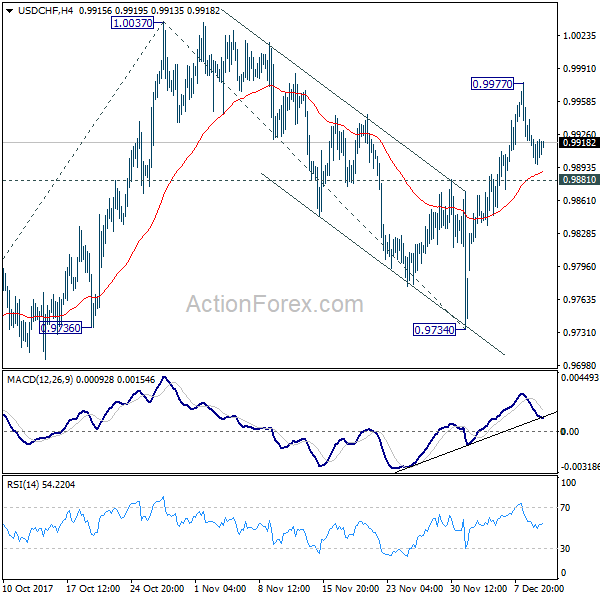
USD/CHF Daily Outlook
Daily Pivots: (S1) 0.9897; (P) 0.9919; (R1) 0.9942; More....
Intraday bias in USD/CHF remains neutral for consolidation below 0.9977 temporary top. We'd holding on to the view that correction from 1.0037 has completed at 0.9734 already. Also, rise from 0.9420 might be resuming. On the upside, above 0.9977 will target 1.0037 high first. Break will extend the rise from 0.9420 to 61.8% projection of 0.9420 to 0.9734 from 1.0047 at 1.0115 next. Nevertheless, firm break of 0.9881 support will dampen this immediate bullish case and turn bias to the downside for 0.9734 instead.
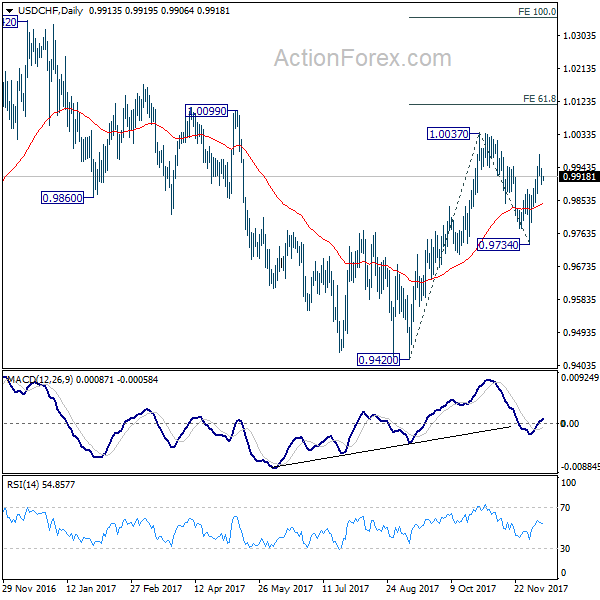
In the bigger picture, range trading continues between 0.9420/1.0342. At this point, 0.9420 appears to be a strong support level. Therefore, in case of decline attempt, we don't expect a firm break of this level. Nonetheless, strong break of 1.0342 is also needed to confirm upside momentum. Otherwise, medium term outlook will stay neutral.