Sample Category Title
USD/JPY Bullish Consolidation At 38.2 Fib
The USD/JPY made a diving board pattern straight from 111.70 zone and it is consolidating now at 38.2 of the previous swing low. The price is supported by 38.2, D L3, W H4 and double bottom within 112.30-40 zone. This accounts for the POC zone. If the price bounces from the zone, targets could be 112.77 and 113.14. Have in mind that Friday is generally a profit taking day, so we might see some volatility. It doesn't hurt to protect profits by applying profit stop when volatility is higher than usual and on Fridays.
W L3 - Weekly Camarilla Pivot (Weekly Interim Support)
W H3 - Weekly Camarilla Pivot (Weekly Interim Resistance)
W H4 - Weekly Camarilla Pivot (Strong Weekly Resistance)
D H4 - Daily Camarilla Pivot (Very Strong Daily Resistance)
D L3 – Daily Camarilla Pivot (Daily Support)
D L4 – Daily H4 Camarilla (Very Strong Daily Support)
POC - Point Of Confluence (The zone where we expect price to react aka entry zone)
Technical Outlook: Spot GOLD Bounces On Weaker Dollar But Sentiment Remains Negative
Spot Gold edged higher on Friday following steep two-day fall when the yellow metal fell to $1270, down nearly 1.5%. Softer dollar on Friday inflated metal's price, with limited recovery expected as sentiment remains negative and tech on daily chart techs remaining in bearish setup. Thickening daily cloud continues to weigh (cloud base lies at $1283, reinforced by 20SMA and expected to limit extended corrective action). Bear-leg from repeated upside rejection under $1300 barrier is expected to attack targets at $1266 (200SMA) and $1263 (27 Oct low). Conversely, stronger recovery could be expected on penetration and close in the cloud.
Res: 1278, 1281, 1283, 1288
Sup: 1273, 1270, 1266, 1263
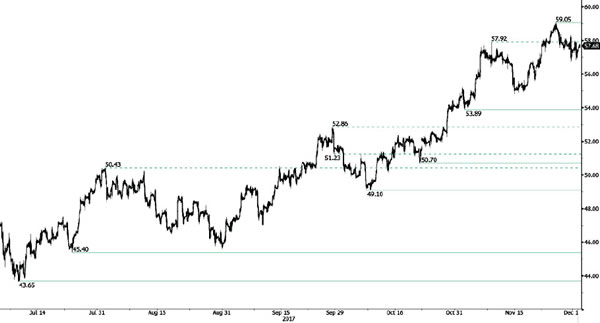
CRUDE OIL Ready For Another Leg Higher
Crude oil has finished its consolidation and is now ready to challenge the 60-dollar level. Expected to show continued increase. Support is given at a distance at 54.81 (14/11/2017 low)
In the long-term, crude oil has recovered after its sharp decline last year. However, we consider that further weakness are very likely. For the time being the pair lies in an upside momentum. Strong support lies at 35.24 (05/04/2016) while resistance can now be found at 55.24 (03/01/2017 high).
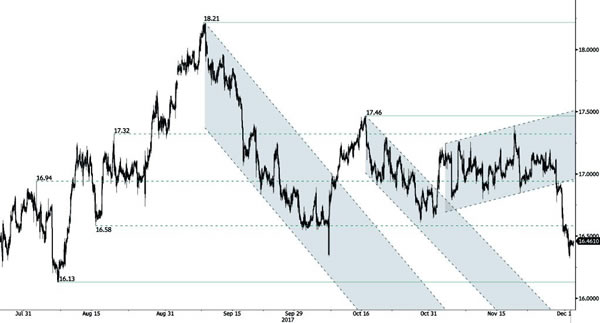
SILVER Collapsing
Silver is heading lower. Hourly support can be found at 16.60 (27/10/2017 low). Hourly resistance is given at 17.46 (13/10/2017 high). Additional support can be found at 16.13 (06/10/2017 low).
In the long-term, the trend is rater negative. Further downsides are very likely. Resistance is located at 25.11 (28/08/2013 high). Strong support can be found at 11.75 (20/04/2009).
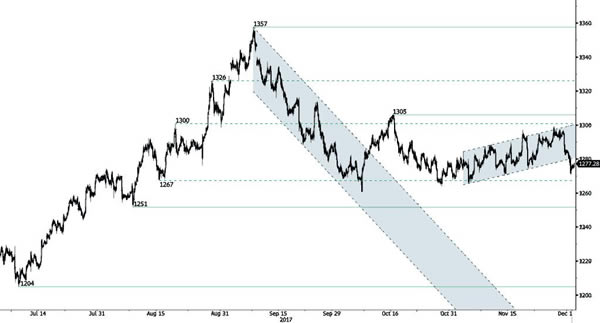
GOLD Bouncing Lower
Gold is pushing lower. The technical structure confirms the end of the consolidation phase. Support lies at a distance at 1251 (08/08/2017 high). Resistance is located at 1288 (20/10/2017).
In the long-term, the technical structure suggests that there is a growing upside momentum. A break of 1392 (17/03/2014) is necessary ton confirm it, A major support can be found at 1045 (05/02/2010 low).
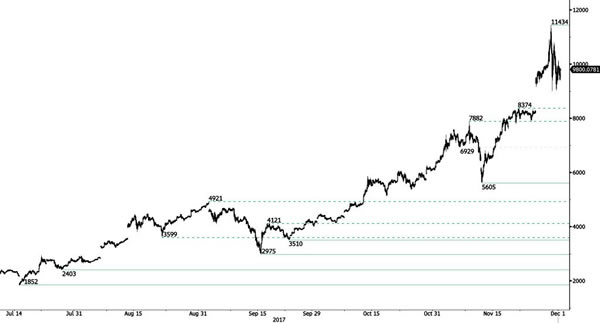
BITCOIN Consolidating Below 10k
Bitcoin is now consolidating around 10k. The technical structure shows a tremendous positive short-term momentum. Hourly support is located at 5605 (13/11/2017 low). Strong support stands very far at 2975 (22/08/2017 low). In the shortterm, the digital currency should continue rising above 10k.
In the long-term, the digital currency has had an exponential growth. There are decent likelihood that the asset will reach $40'000 in 2018.
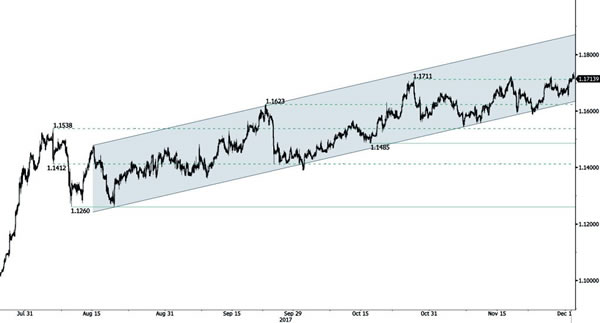
EUR/CHF Continued Increase
EUR/CHF continues to push towards resistance area above 1.17 and support given at 1.1610 (27/10/2017 low). Expected to show continued increase.
In the longer term, the technical structure has reversed. Strong resistance is given at 1.20 (level before the unpeg). Yet, the ECB's QE programme is likely to cause persistent selling pressures on the euro, which should weigh on EUR/CHF. Supports can be found at 1.0184 (28/01/2015 low) and 1.0082 (27/01/2015 low).
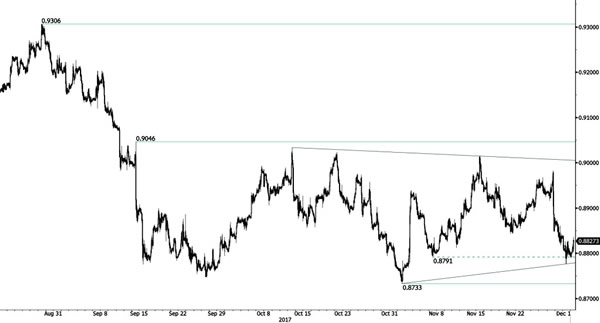
EUR/GBP Starts To Bounce Back
EUR/GBP has collapsed unexpectedly despite the technical structure suggests further shortterm bullish momentum. The pair has broken hourly support at 0.8791 (07/11/2017 low). Resistance is located at 0.8943 (27/11/2017 high).
In the long-term, the pair has largely recovered from recent lows in 2015. The technical structure suggests a growing upside momentum. The pair is trading above from its 200 DMA. Strong resistance can be found at 0.9500 (psychological level).
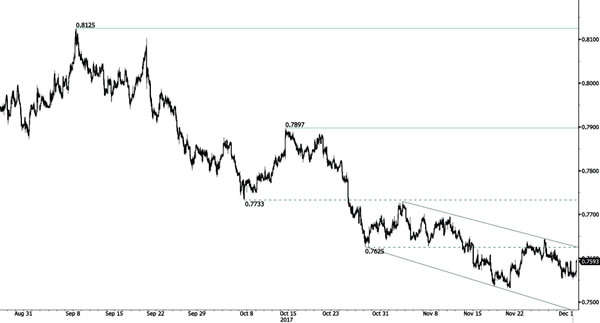
AUD/USD Riding Downtrend Channel
AUD/USD is ready to go even lower showing that downside pressures are still lively. Hourly resistance is given at a distance at 0.7897 (13/10/2017 high). Expected to show renewed pressures towards key support at 0.7535 (22/06/2017 low).
In the long-term, the trend is turning positive. Key supports stands at 0.6009 (31/10/2008 low) . A break of the key resistance at 0.8164 (14/05/2015 high) is needed to invalidate our long-term bearish view.
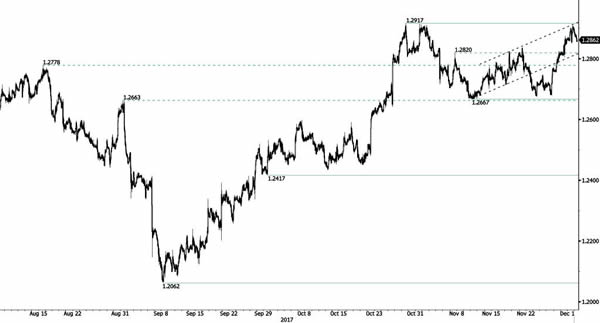
USD/CAD Bouncing Lower On Resistance At 1.2917
USD/CAD is approaching hourly resistance at 1.2917 ( 27/10/2017 high). Hourly support lies at 1.2667 (10/11/2017 low). Expected to show bearish pressures.
In the longer term, the pair has broken longterm support that can be found at 1.2461 (16/03/2015 low). Strong resistance is given at 1.4690 (22/01/2016 high). The pair is likely to head further lower.