Sample Category Title
Weekly Focus: Weakening Nordic Housing Markets in Focus
Market movers ahead
- In the US, we expect to see a catching up effect for non-farm payrolls in November. We expect an increase of 195,000 driven mainly by the service sector.
- Brexit remains in the spotlight, as the EU says an agreement on phase 1 must be reached on Monday at the latest in order to assess whether 'sufficient progress' has been made in the negotiations' phase 1 to move to phase 2 (future relationship).
- In all Scandinavian countries, we have interesting data out on housing markets. Sweden and Norway in particular draw our attention following recent weakening. We expect to see declining house prices in both countries.
- In Norges Bank's regional survey, we expect to see the aggregated output index unchanged at around 1.1.
Global macro and market themes
- US curve flattening continues; and we look at possible explanations.
- We believe the factors that have driven the flattening, including expected market pricing of more Fed hikes in 2018, in a low inflation environment will continue to flatten the US curve over the next couple of quarters.
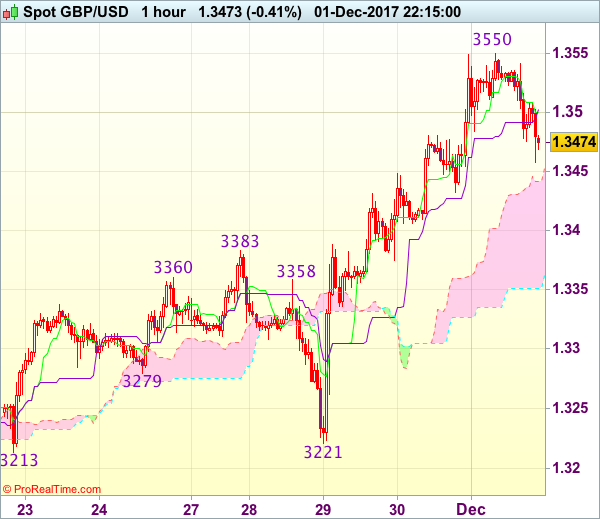
Trade Idea Wrap-up: GBP/USD – Buy at 1.3410
GBP/USD - 1.3472
Most recent candlesticks pattern : N/A
Trend : Near term up
Tenkan-Sen level : 1.3500
Kijun-Sen level : 1.3502
Ichimoku cloud top : 1.3432
Ichimoku cloud bottom : 1.3351
Original strategy :
Buy at 1.3440, Target: 1.3560, Stop: 1.3405
Position : -
Target : -
Stop : -
New strategy :
Buy at 1.3410, Target: 1.3540, Stop: 1.3375
Position : -
Target : -
Stop : -
As cable has retreated after meeting resistance at 1.3550, suggesting consolidation below this level would be seen and pullback to 1.3435-40 is likely, however, reckon 1.3400-10 would limit downside and bring another rise later, above 1.3505-10 would bring retest of 1.3550 but break there is needed to confirm recent rise has resumed for headway to 1.3570-75 and later towards 1.3600.
In view of this, would not chase this rise here and would be prudent to buy sterling on subsequent pullback as 1.3400-05 would limit downside and bring another rise. Below 1.3374 support would abort and signal top has been formed, bring further fall to 1.3340-45.
Canadian Job Market Unstoppable in November, Adding 79.5k Jobs
The Canadian labour market added to its winning streak last month, adding a whopping 79.5k jobs in November and marking the 12th straight month of employment gains. Strong hiring and a largely unchanged labour force led the unemployment rate to tumble to 5.9% from 6.3% in October.
Part-time jobs led the gains, up 49.9k, but full-time employment also increased robustly, rising 29.6k. Full-time jobs are up 3% year-on-year - its fastest pace in fifteen years.
Job gains were concentrated in the private sector (+72.4k), with the public sector kicking in an additional 10.6k.
Both goods and service-producing industries added positions at a solid clip. Goods industry jobs were up 37.4k, led by manufacturing, which added 30.4k, with construction kicking in a solid 16.8k. Services industries added 42.1k, with trade industries accounting for nearly all of the gains, up 38.8k.
Regionally, Ontario accounted for half the gains, up 43.2k, pushing the unemployment rate in the province to 5.5% (from 5.9%). Quebec also added a healthy 16.2k jobs, leading the unemployment to a new record-low of 5.4% (from 6.1% in October). Alberta also saw a significant drop in its unemployment rate to 7.3% (from 7.8%).
The hourly wage rate accelerated to 2.7% on a year-on-year basis from 2.4% in October. The only fly in the ointment was a deceleration in hours worked to 1.0% (y/y) from 2.7%. However, much of this was a base year effect, with a surge in hours worked in November 2016.
Key Implications
The Canadian labor market appears unstoppable at this point, with a twelfth consecutive month of job gains. During the last 40 years the unemployment rate has only been (marginally) lower in one month - December 2007 when it hit 5.8%.
With strength concentrated in full-time work, there is little doubt that the economy is operating at full capacity and pushing into excess demand territory. This notion is corroborated by the acceleration in wage growth. It's hard to fathom that just a few months ago analysts (ourselves included) were decrying its weakness. The path up from its nadir of 0.6% in April has been rocket-like.
The strength in the labor market will not go unnoticed by the Bank of Canada. Risks to the outlook notwithstanding, the broad-based strength in jobs and wage growth suggest that the Bank of Canada should continue to normalize monetary policy. The Bank of Canada may choose to hold off next week, but the next rate hike is likely not more than a few months away.
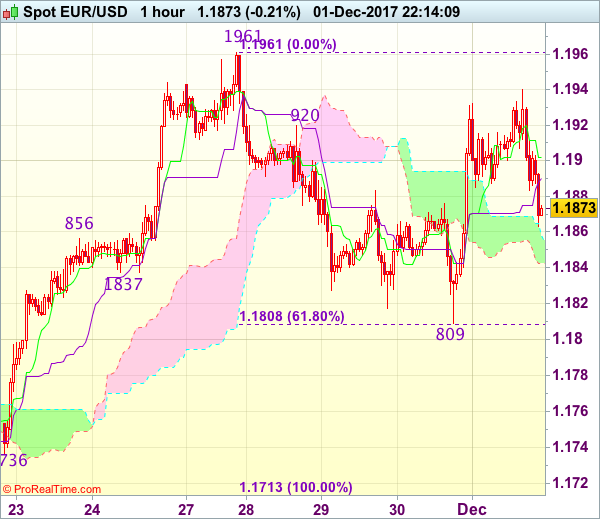
Trade Idea Wrap-up: EUR/USD – Hold long entered at 1.1865
EUR/USD - 1.1866
Most recent candlesticks pattern : N/A
Trend : Near term up
Tenkan-Sen level : 1.1902
Kijun-Sen level : 1.1890
Ichimoku cloud top : 1.1858
Ichimoku cloud bottom : 1.1843
Original strategy :
Bought at 1.1865, Target: 1.1965, Stop: 1.1855
Position : - Long at 1.1865
Target : - 1.1965
Stop : - 1.1855
New strategy :
Hold long entered at 1.1865, Target: 1.1965, Stop: 1.1855
Position : - Long at 1.1865
Target : - 1.1965
Stop : - 1.1855
As the single currency found decent demand at 1.1809 yesterday and has staged a strong rebound, price broke above previous resistance at 1.1920, adding credence to our view that the pullback from 1.1961 has ended there, hence bullishness remains for a retest of this level, however, break there is needed to confirm recent upmove has resumed for headway to 1.1990-00 which is likely to hold from here.
In view of this, we are holding on to our long position entered at 1.1865. Below 1.1855-60 would abort and prolong consolidation and risk weakness to 1.1835-40, having said that, said support at 1.1809 should remain intact, bring rebound later.
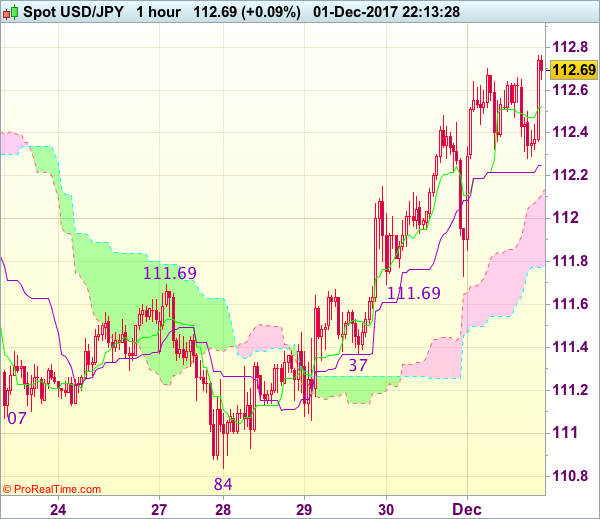
Trade Idea Wrap-up: USD/JPY – Buy at 112.00
USD/JPY - 112.67
Most recent candlesticks pattern : N/A
Trend : Near term up
Tenkan-Sen level : 112.52
Kijun-Sen level : 112.25
Ichimoku cloud top : 112.11
Ichimoku cloud bottom : 111.77
Original strategy :
Buy at 112.00, Target: 113.00, Stop: 111.65
Position : -
Target : -
Stop : -
New strategy :
Buy at 112.00, Target: 113.00, Stop: 111.65
Position : -
Target : -
Stop : -
As the greenback has surged again after holding above indicated support at 111.69 (just missed our long entry at 111.70) and bullishness remains for the rise from 110.84 low to extend gain to 112.72 resistance, break there would bring subsequent rise to previous support at 113.09, however, near term overbought condition should limit upside and resistance at 113.33 should hold from here.
In view of this, we are still looking to buy dollar on pullback as 112.00 should limit downside. Only break of said support at 111.69 would abort and signal top is formed, bring weakness to 111.50, then test of support at 111.37.
EUR/USD Mid-Day Outlook
Daily Pivots: (S1) 1.1830; (P) 1.1881 (R1) 1.1953; More....
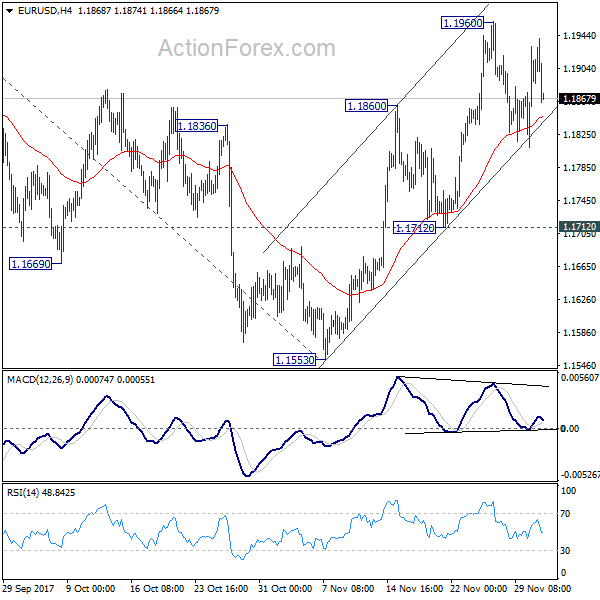
EUR/USD is still bounded in range below 1.1960 and intraday bias remains neutral first. With 1.1712 support intact, rise from 1.1553 is expected to resume later. Break of 1.1960 will turn bias to the upside for retesting 1.2091 high first. Break there will resume medium term up trend from 1.0339 and target 61.8% projection of 1.0569 to 1.2091 from 1.1553 at 1.2494, which is close to 1.2516 long term fibonacci level. We'd expect strong resistance from there to bring reversal. On the downside, break of 1.1712 will indicate completion of the rise from 1.1553 and turn near term outlook bearish.
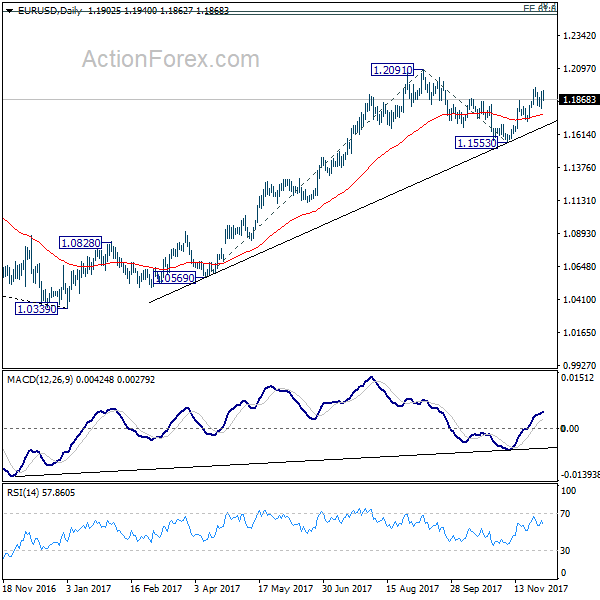
In the bigger picture, rise from 1.0339 medium term bottom is seen as a corrective move for the moment. Therefore, in case of another rally, we'd be expect 38.2% retracement of 1.6039 (2008 high) to 1.0339 (2017 low) at 1.2516 to limit upside and bring reversal. Meanwhile, sustained trading below 55 week EMA (now at 1.1393) will suggest that such medium term rebound is completed and could then bring retest of 1.0339 low.
GBP/USD Mid-Day Outlook
Daily Pivots: (S1) 1.3438; (P) 1.3493; (R1) 1.3583; More....
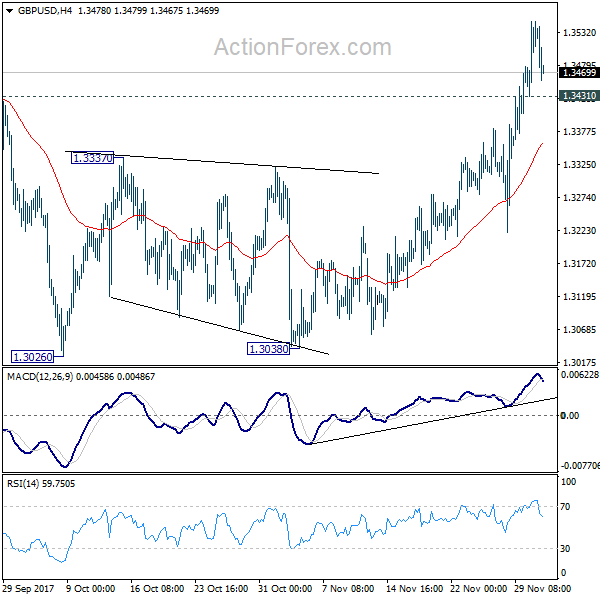
With 1.3431 minor support intact, intraday bias in GBP/USD remains on the upside for 1.3651 high. Break there will resume medium term rally from 1.1946 to 1.3835 key resistance. On the downside, below 1.3382 minor support will turn bias neutral and bring retreat before staging another rally.
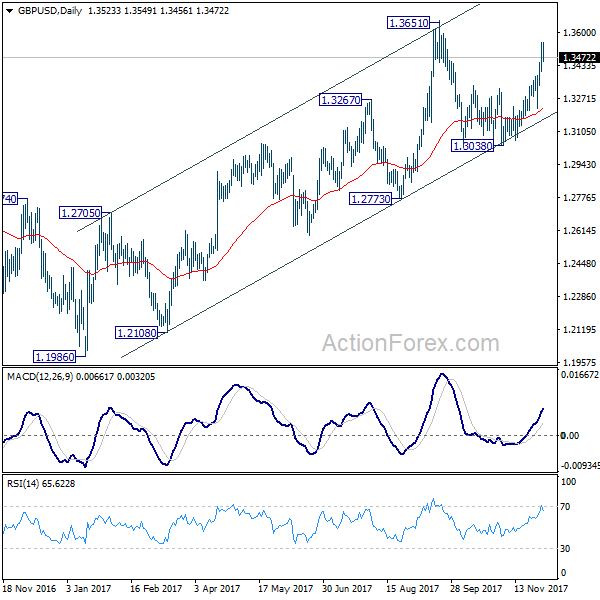
In the bigger picture, as noted before, GBP/USD hit strong resistance from the long term falling trend line. Nonetheless, subsequent fall was contained by 55 week EMA (now at 1.3069). Outlook is a bit mixed. For the moment, as long as 1.3835 support turned resistance holds, medium term rise from 1.1946 are viewed as a corrective pattern. That is, we'd expect another leg in the long term down trend through 1.1946 low. However, sustained break of 1.3835 should at least send GBP/USD to 38.2% retracement of 2.1161 (2007 high) to 1.1946 (2016 low) at 1.5466.
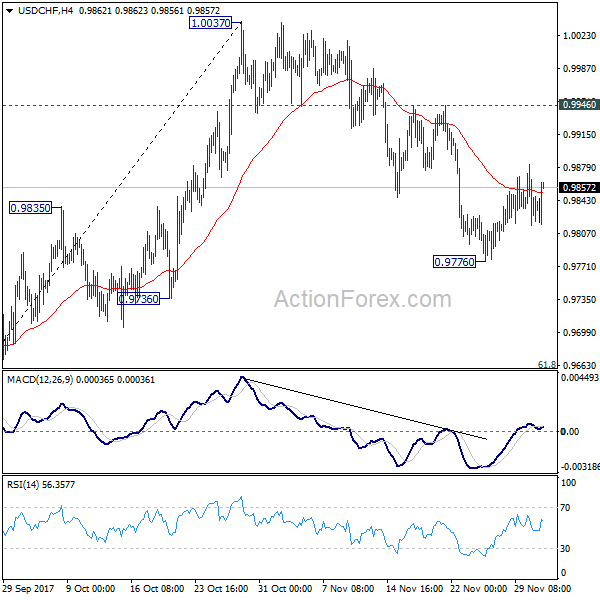
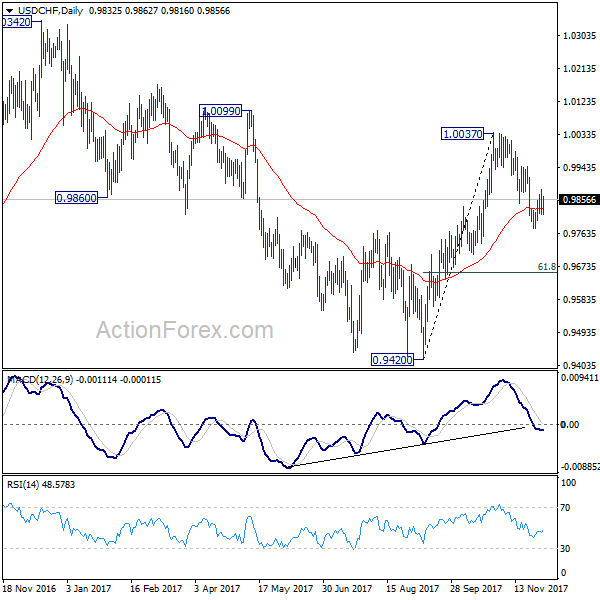
USD/CHF Mid-Day Outlook
Daily Pivots: (S1) 0.9806; (P) 0.9844; (R1) 0.9872; More....
Intraday bias in USD/CHF remains neutral as recovery from 0.9776 is limited well below 0.9446 resistance. Another fall is in favor and break of 0.9776 will target 61.8% retracement of 0.9420 to 1.0037 at 0.9656. We'll look for bottoming again below 0.9656 and above 0.9420. On the upside, break of 0.9946 resistance will indicate that the decline from 1.0037 has completed and bring retest of this resistance.
In the bigger picture, range trading continues between 0.9420/1.0342. At this point, 0.9420 appears to be a strong support level. Therefore, in case of decline attempt, we don't expect a firm break of this level. Nonetheless, strong break of 1.0342 is also needed to confirm upside momentum. Otherwise, medium term outlook will stay neutral.
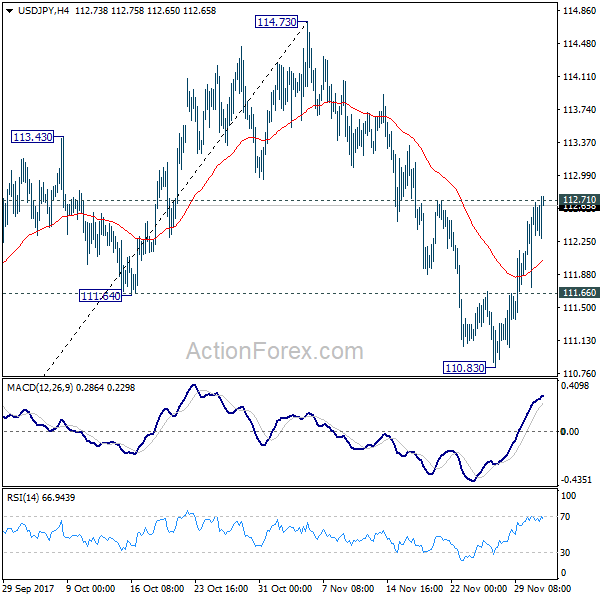
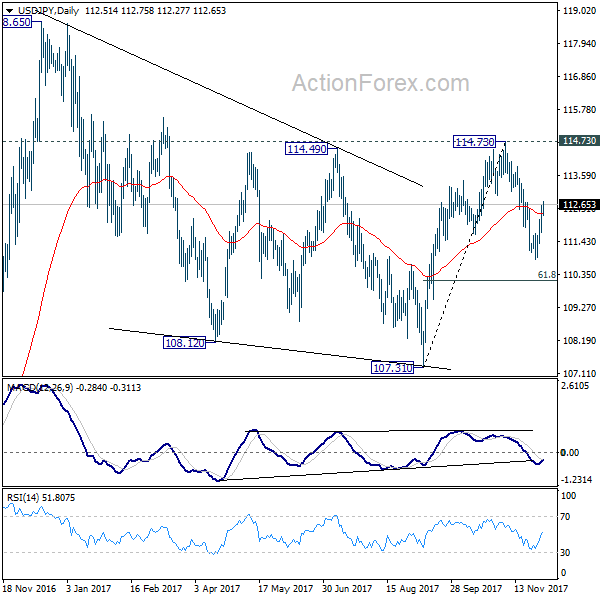
USD/JPY Mid-Day Outlook
Daily Pivots: (S1) 111.96; (P) 112.30; (R1) 112.86; More...
Intraday bias in USD/JPY remains neutral with focus on 112.71 resistance. Sustained break there should confirm completion of pull back from 114.73. In that case, intraday bias will be turned back to the upside for retesting 114.73 resistance. On the downside, below 111.66 minor support will turn bias to the downside and likely resume fall from 112.71 through 110.83. But in that case, we'd expect strong support below 61.8% retracement of 107.31 to 114.73 at 110.14 to bring rebound.
In the bigger picture, as long as 107.31 support holds, medium term rise from 98.97 (2016 low) is not completed yet. And another rise is in favor. Break of 114.73 resistance will target a test on 118.65 high first. However, break of 107.31 will dampen this will and extend the medium term fall back to 98.97 low.
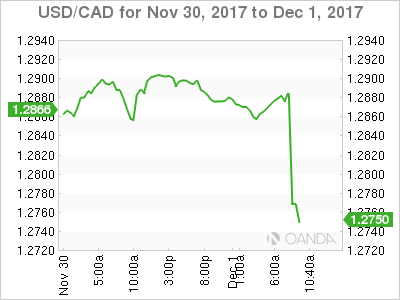
USD/CAD – Loonie rocks on Canadian Job Report
- CAN Nov jobs: +79.5k (exp. +10k, last +35.3k)
- Unemployment: +5.9% (exp. +6.2%, last +6.3%)
- Full-Time Jobs +29,600; Part-Time +49,900
The Canadian labor market continues to defy expectations, as the economy recorded the biggest one-month job gain in nearly six years while the unemployment rate dropped below the psychological +6% benchmark.
The Canadian economy added a net +79,500 in November on a seasonally adjusted basis (the best one-month print since April 2012).
The market consensus was for a 10,000-job advance, according to economists at Royal Bank of Canada.
The unemployment rate fell to +5.9% from a +6.3% level in October - the lowest unemployment rate in nearly a decade.
Wage growth also accelerated, with average hourly pay rising at its fastest pace in 19-months, up +2.8% y/y.
The loonie is up +0.85% outright, trading at C$1.2769.
Food for thought: Canadian minimum wages goes up in January 2018, will some of the short-term job gains be reversed?