Sample Category Title
EURUSD – Targeting Further Bull Pressure, Eyes 1.1960 Zone
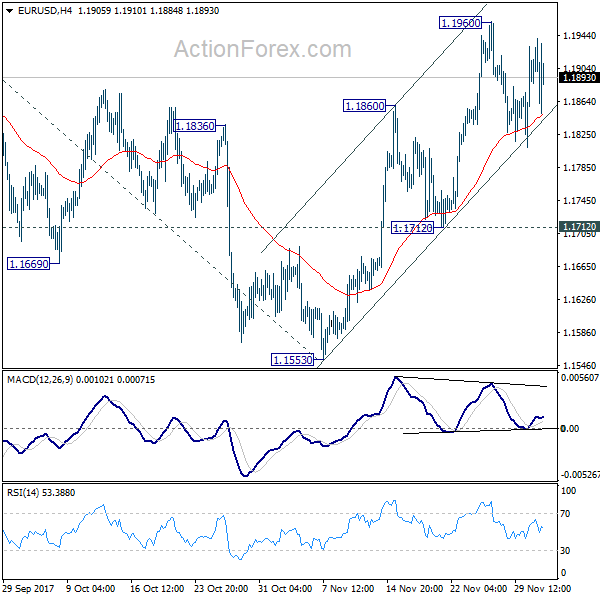
EURUSD - The pair faces further upside as it looks for more strength. Resistance comes in at 1.1950 level with a cut through here opening the door for more upside towards the 1.2000 level. Further up, resistance lies at the 1.2050 level where a break will expose the 1.2100 level. Conversely, support lies at the 1.1850 level where a violation will aim at the 1.1800 level. A break of here will aim at the 1.1750 level. Below here will open the door for more weakness towards the 1.1700. All in all, EURUSD faces further downside threats.
EUR/USD Weekly Outlook
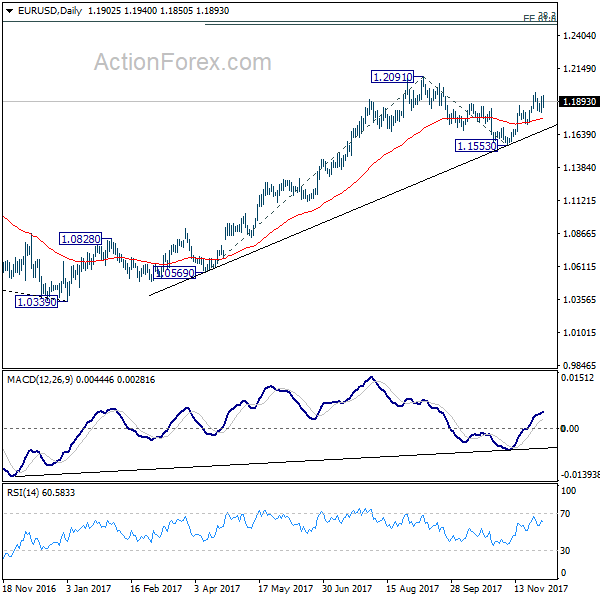
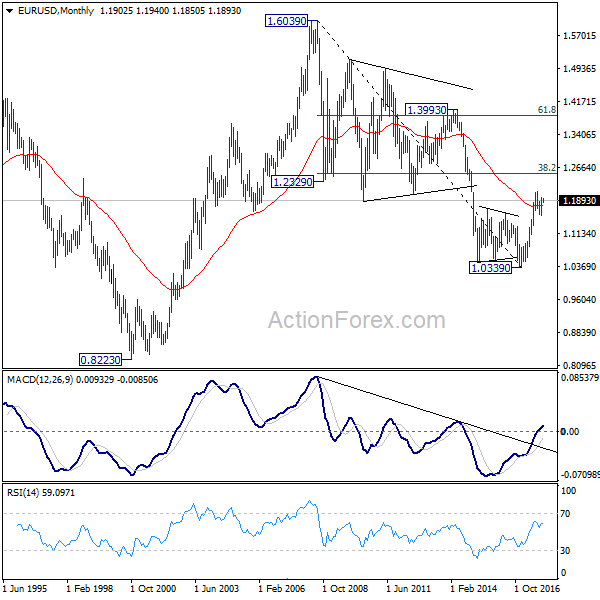
EUR/USD edged higher to 1.1960 last week but turned into sideway trading since then. Initial bias remains neutral this week first. As long as 1.1712 support holds, another rally is in favor. Above 1.1960 will target 1.2091 high first. Break will extend the medium term up trend from 1.0339 to 61.8% projection of 1.0569 to 1.2091 from 1.1553 at 1.2494, which is close to 1.2516 long term fibonacci level. On the downside, break of 1.1712 will indicate completion of the rise from 1.1553 and turn near term outlook bearish.
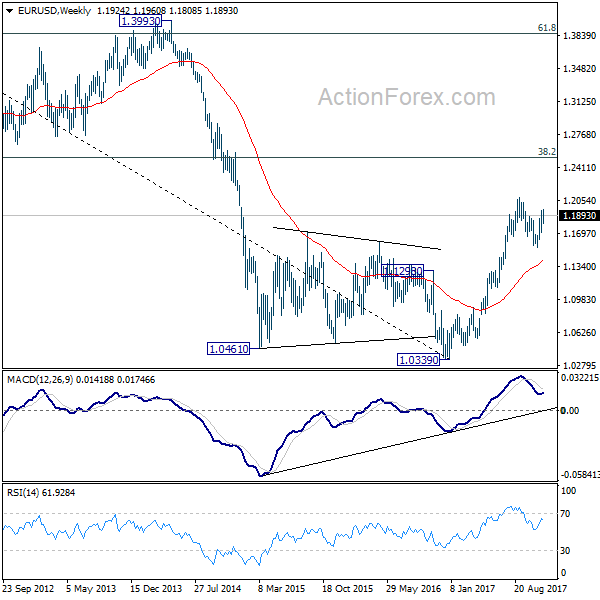
In the bigger picture, rise from 1.0339 medium term bottom is seen as a corrective move for the moment. Therefore, in case of another rally, we'd be expect 38.2% retracement of 1.6039 (2008 high) to 1.0339 (2017 low) at 1.2516 to limit upside and bring reversal. Meanwhile, sustained trading below 55 week EMA (now at 1.1410) will suggest that such medium term rebound is completed and could then bring retest of 1.0339 low.
In the long term picture, 1.0339 is now seen as an important bottom as the down trend from 1.6039 (2008 high) could have completed. It's still early to decide whether price action form 1.0339 is developing into a corrective or impulsive move. On the upside, strong resistance could be seen from 38.2% retracement of 1.6039 to 1.0339 at 1.2516. On the downside, we're not anticipating a break of 1.0339 in near to medium term.
USD/JPY Weekly Outlook
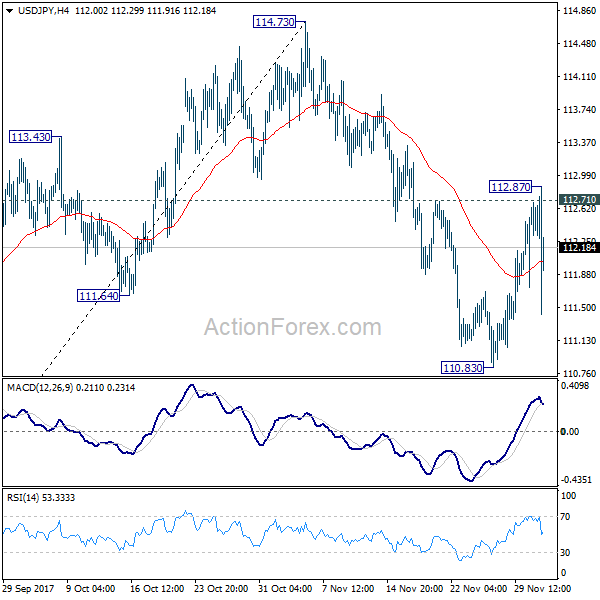
USD/JPY rebounded strongly to 112.87 last week but failed to sustain above 112.71 resistance a and dropped sharply since then. Initial bias is neutral this week first. On the upside, break of 112.87 should confirm completion of the pull back from 114.73 at 110.83. Intraday bias should then be turned back to the upside for retesting 114.73. On the downside, in case of another fall, we'd look for bottoming again below 61.8% retracement of 107.31 to 114.73 at 110.14.
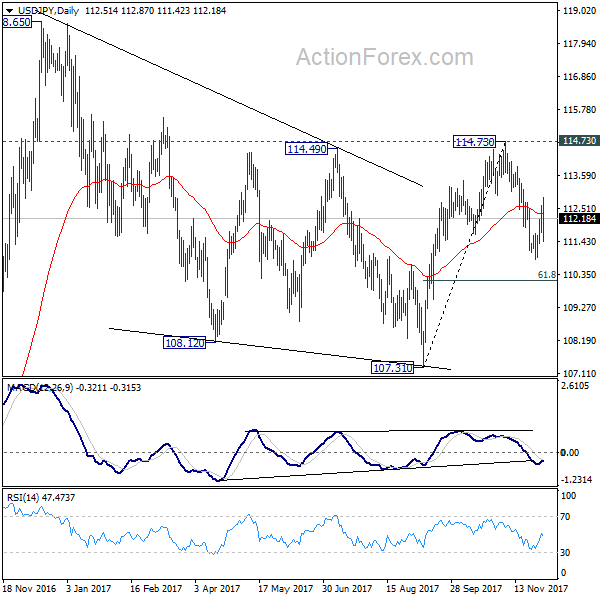
In the bigger picture, we're holding on to the view that correction from 118.65 is completed a 107.31. And medium term rise from 98.97 (2016 low) is resuming. Sustained break of 114.73 should affirm our view and send USD/JPY through 118.65. However, break of 107.31 will dampen this will and extend the medium term fall back to 98.97 low.
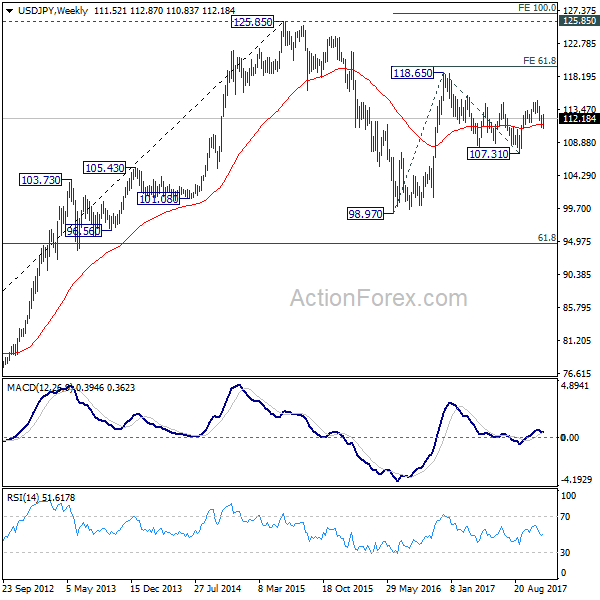
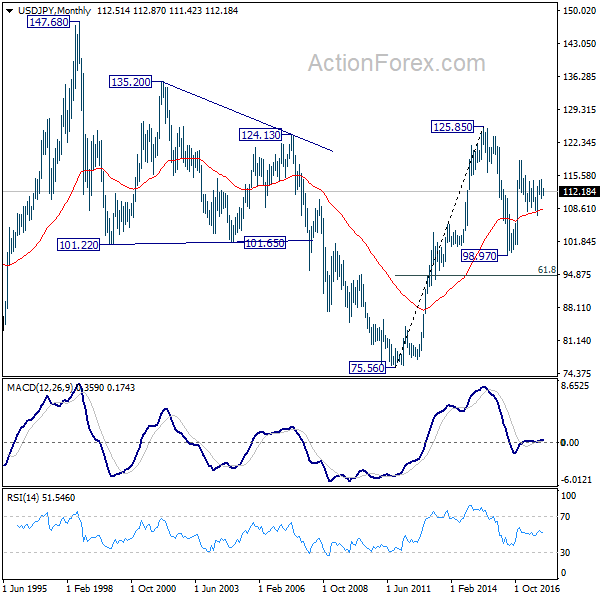
In the long term picture, the rise from 75.56 (2011 low) long term bottom to 125.85 top is viewed as an impulsive move, no change in this view. Price actions from 125.85 are seen as a corrective move which could still extend. In case of deeper fall, downside should be contained by 61.8% retracement of 75.56 to 125.85 at 94.77. Up trend from 75.56 is expected to resume at a later stage for above 135.20/147.68 resistance zone.
GBP/USD Weekly Outlook
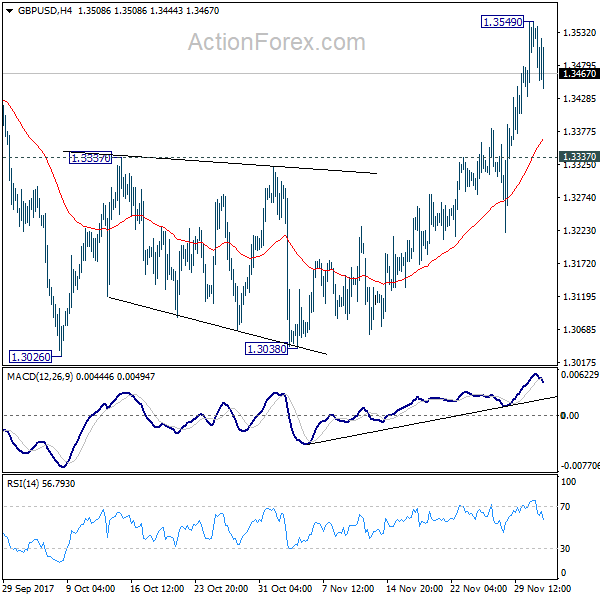
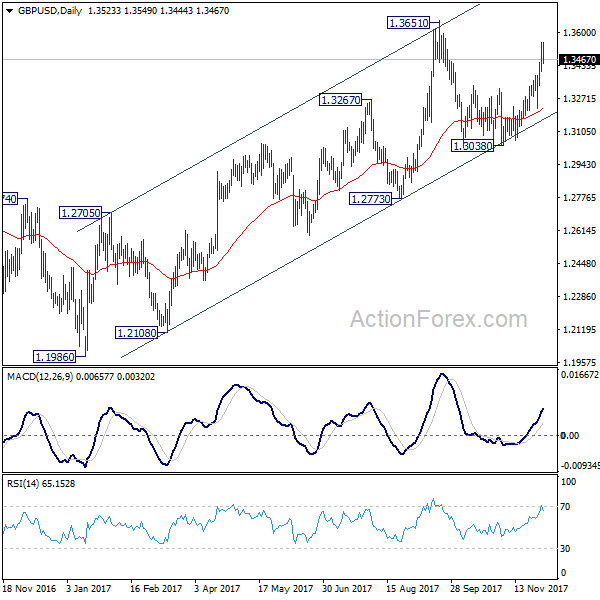
GBP/USD rose to as high as 1.3549 last week, formed a temporary top there and retreated. Initial bias is neutral this week first. But retreat should be contained by 1.3337 resistance turned support to bring another rise. Above 1.3549 will target 1.3651 and above. However, decisive break of 1.3337 will argue that rise from 1.3038 has complete d and turn bias back to the downside for this support.
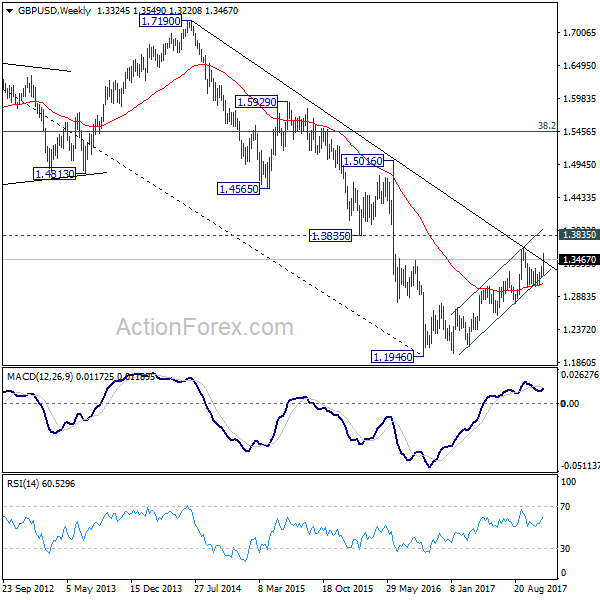
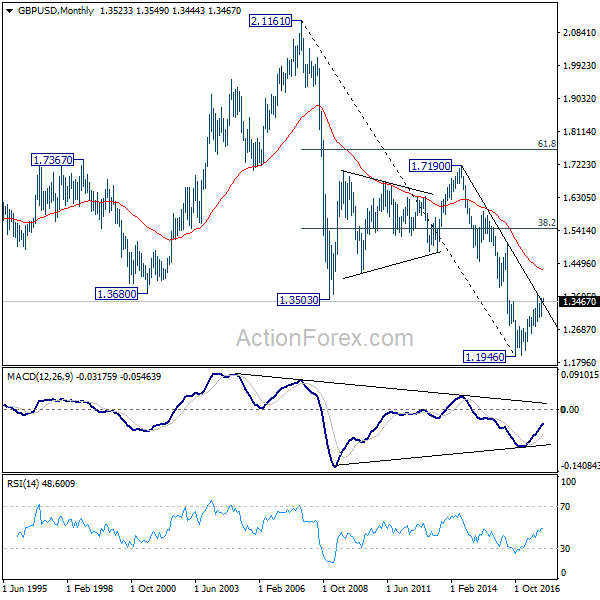
In the bigger picture, while the medium term rebound from 1.1946 low is strong, it's still limited below 1.3835 key support turned resistance. As long as 1.3835 holds, we'd view such rebound as a correction. That is, we'd expect another leg in the long term down trend through 1.1946 low. However, sustained break of 1.3835 should at least send GBP/USD to 38.2% retracement of 2.1161 (2007 high) to 1.1946 (2016 low) at 1.5466.
In the longer term picture, long the outlook is turned a bit mixed as GBP/USD failed to sustain above long term falling tend line resistance, nor 1.3835 key resistance. We'll stay neutral first and assess the outlook again and price actions unfold.
USD/CHF Weekly Outlook
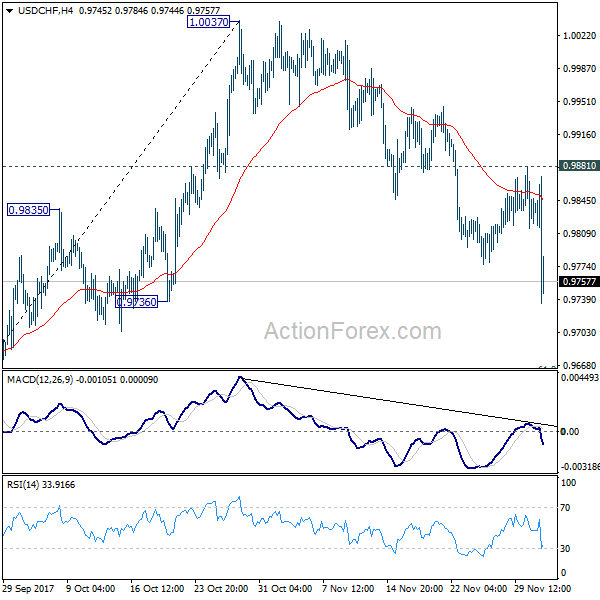
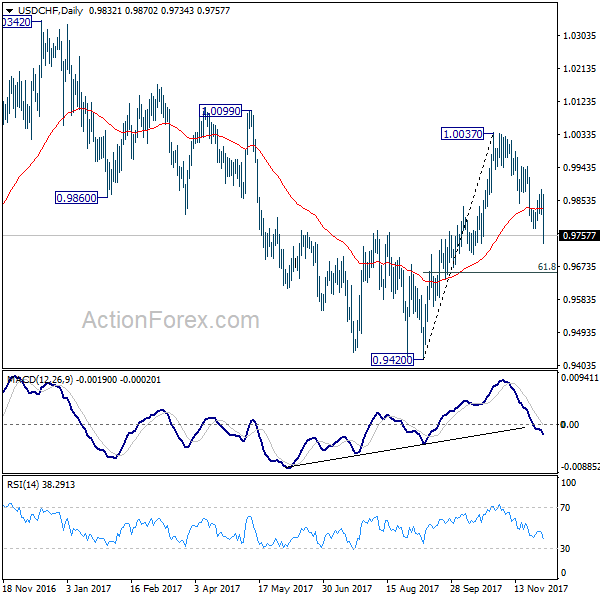
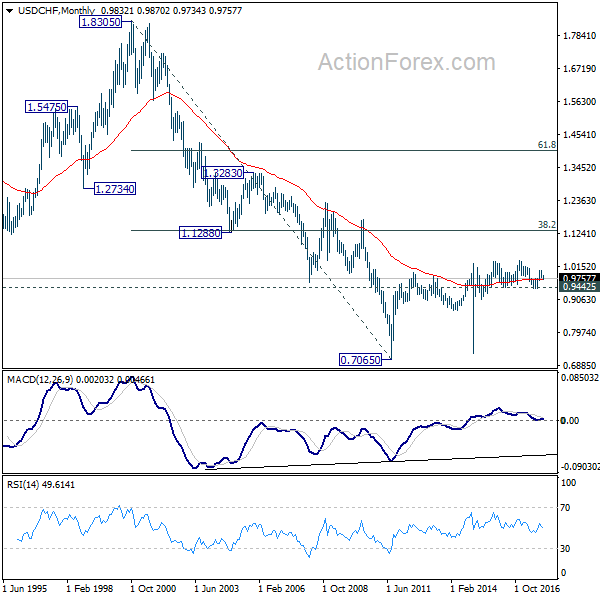
USD/CHF's decline from 1.0037 extended to as low as 0.9734 last week. Initial bias stays on the downside this week for 61.8% retracement of 0.9420 to 1.0037 at 0.9656. We'll look for bottoming again below 0.9656 and above 0.9420. On the upside, break of 0.9881 resistance will now indicate completion of the decline. And intraday bias will be turned back to the upside for 1.0037.
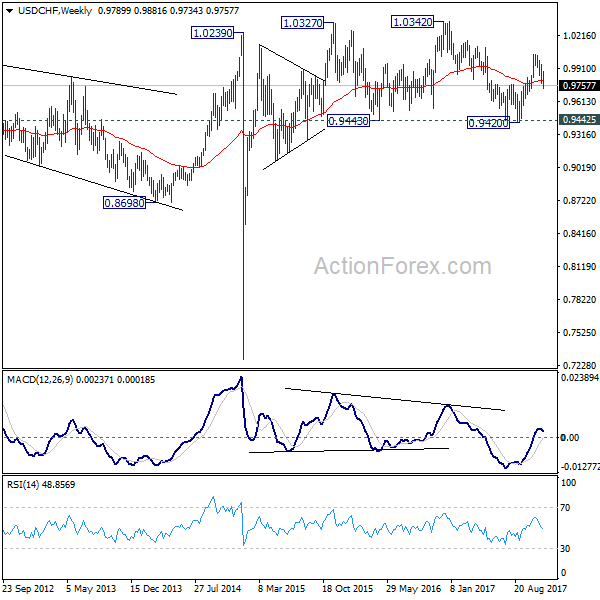
In the bigger picture, range trading continues between 0.9420/1.0342. At this point, 0.9420 appears to be a strong support level. Therefore, in case of decline attempt, we don't expect a firm break of this level. Nonetheless, strong break of 1.0342 is also needed to confirm upside momentum. Otherwise, medium term outlook will stay neutral.
In the long term picture, while upside momentum is unconvincing, with 0.9443 key support intact, rise from 0.7065 (2011 low) is still expected to continue. Break of 1.0342 will target 38.2% retracement of 1.8305 (2000 high) to 0.7065 at 1.1359.
AUD/USD Weekly Outlook
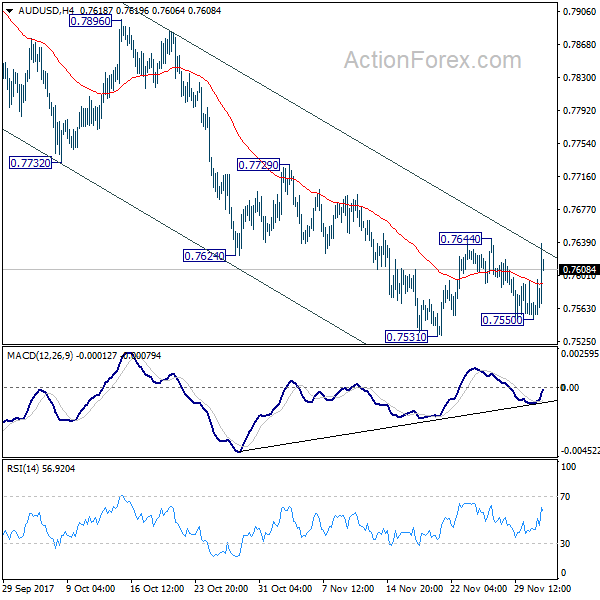
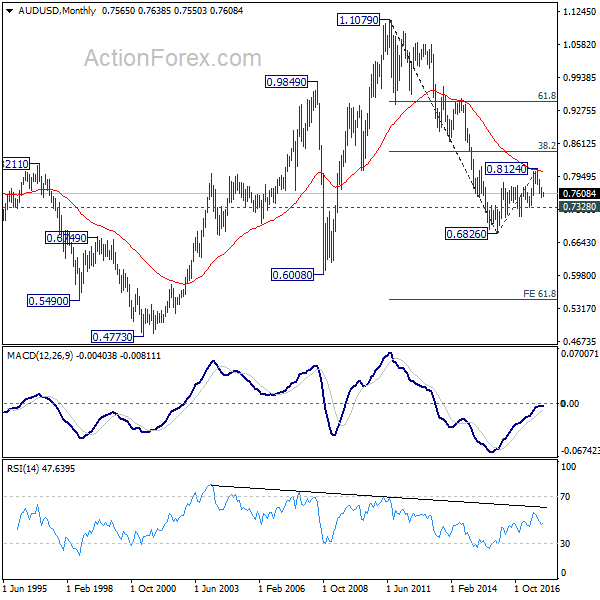
AUD/USD rebounded ahead of 0.7531 low last week and outlook is unchanged. Consolidation from 0.7531 is still in progress and initial bias stays neutral this week first. As long as 0.7729 resistance holds, near term outlook remains bearish and further decline is expected. Break of 0.7531 will resume whole decline from 0.8124 and target next key cluster level at 0.7322/8. Nonetheless, break of 0.7729 will indicate near term reversal, with bearish divergence condition in 4 hour MACD. And stronger rebound would be seen back to 0.7896 resistance and above.
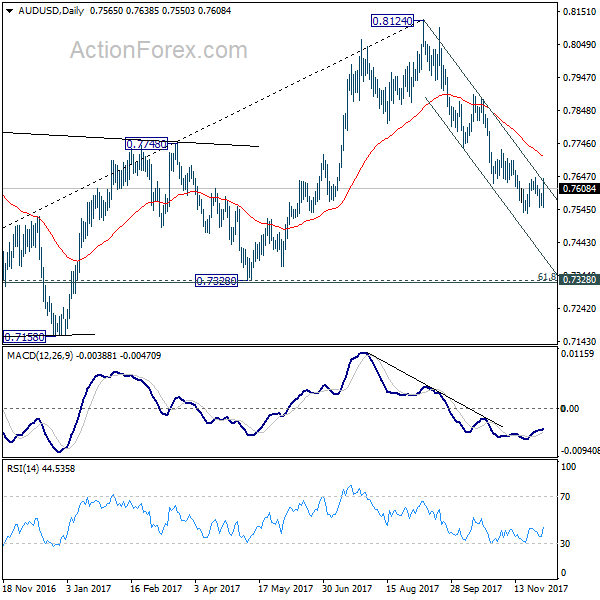
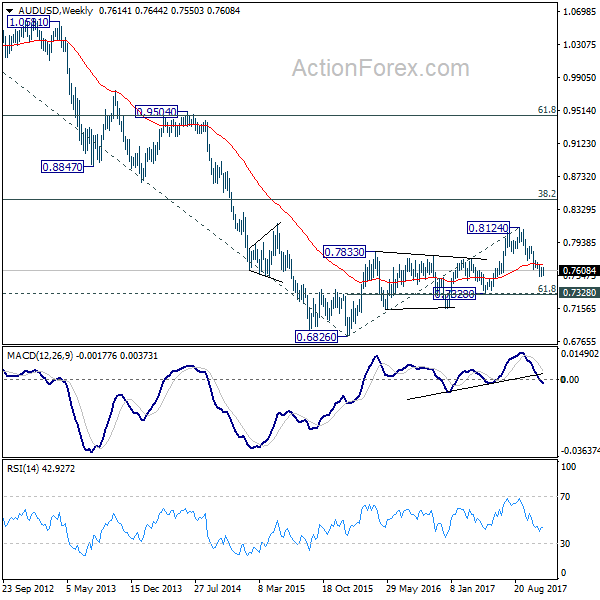
In the bigger picture, corrective rise from 0.6826 medium term bottom is likely completed at 0.8124, after hitting 55 month EMA (now at 0.8033). Decisive break of 0.7328 key cluster support (61.8% retracement 0.6826 to 0.8124 at 0.7322) will confirm. And in that case, long term down trend from 1.1079 (2011 high) will likely be resuming. Break of 0.6826 will target 61.8% projection of 1.1079 to 0.6826 from 0.8124 at 0.5496. This will now be the favored case as long as 0.7729 near term resistance holds.
In the longer term picture, 0.6826 is seen as a long term bottom. Rise from there could either reverse the down trend from 1.1079, or just develop into a corrective pattern. At this point, we're favoring the latter. And, as long as 38.2% retracement of 1.1079 to 0.6826 at 0.8451 holds, we'd anticipate another decline through 0.6826 at a later stage. But strong support should be seen between 0.4773 (2001 low) and 0.6008 (2008 low).
USD/CAD Weekly Outlook
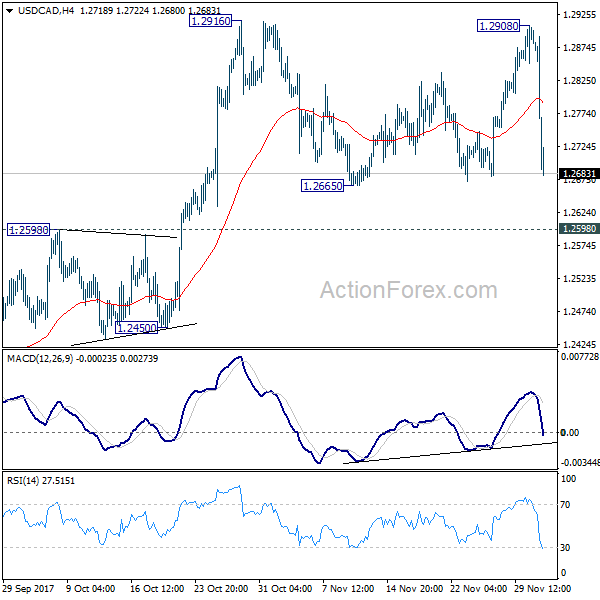
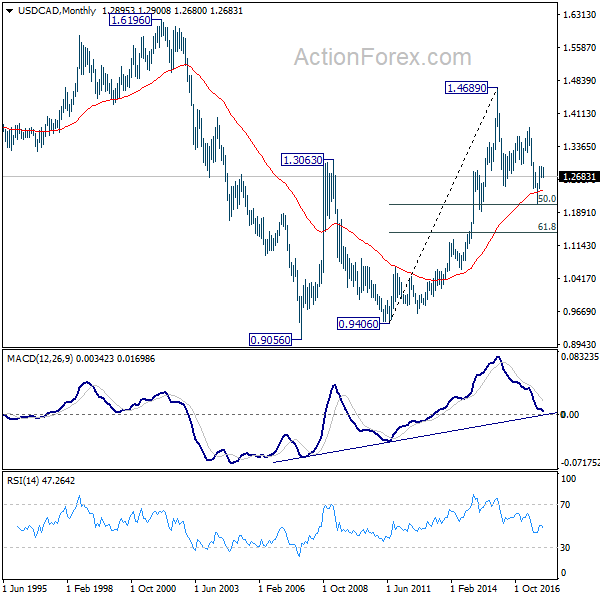
USD/CAD rose to 1.2908 last week but failed to break through 1.2916 resistance and dropped sharply to close. Initial bias stays neutral this week first. As long as 1.2598 resistance turned support holds, we'll treat price actions from 1.2916 as consolidation. And, rebound from 1.2061 would resume later. Break of 1.2916 will target 1.3065 medium term fibonacci level next. However, sustained break of 1.2598 will argue that rebound from 1.2061 has completed after hitting 55 week EMA (now at 1.2888). Near term outlook will be turned bearish in this case.
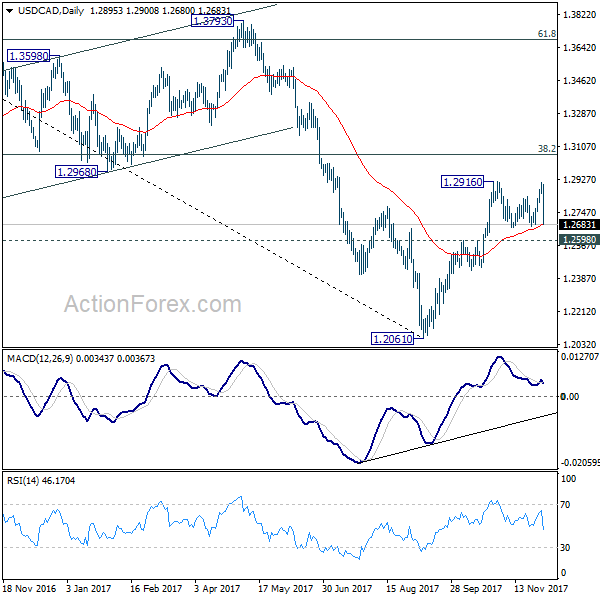
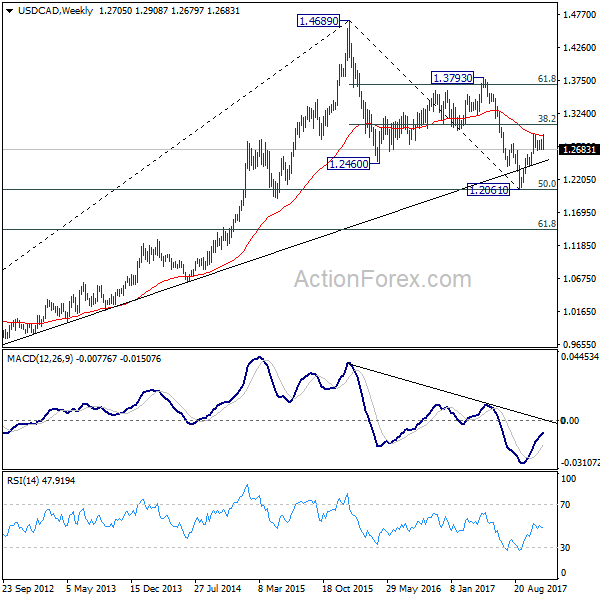
In the bigger picture, USD/CAD should have defended 50% retracement of 0.9406 (2011 low) to 1.4689 (2016 high) at 1.2048. And with 1.2048 intact, we'd favor the case that fall from 1.4689 is a correction. Rise from 1.2061 medium term bottom should now target 38.2% retracement of 1.4689 to 1.2061 at 1.3065. Firm break there will target 1.3793 key resistance next (61.8% retracement at 1.3685). We'll now hold on to this bullish view as long as 1.2450 support holds.
In the longer term picture, current development argues that correction from 1.4689 has completed with three waves down to 1.2061 already. And larger up trend from 0.9056 (2007 low) is still in progress. Firm break of 1.3794 resistance should now indicate up trend resumption through 1.4689 high.
Dollar to Take the Spotlight Back as Senate Passed Tax Bill
Dollar took a back seat last week as traders were cautious ahead of the Senate's vote on the tax bill. Sterling took lead instead as boosted by positive Brexit news, as UK and EU seemed to have agreed on the divorce bill and Irish border. Canadian Dollar followed as the second strongest as stellar employment data raised the chance of more BoC hike next year. Meanwhile, Yen ended as the weakest one. It's followed by Euro, despite solid Eurozone data. Now, with the tax bill finally passed in Senate on Saturday, the greenback would likely come back to spotlight this week, with non-farm payroll also featured.
Senate passed tax bill after marathon session
After marathon debate and numerous amendments, Senate Republicans finally passed their version of the tax bill on Saturday, by 51-49 vote. Bob Corker was the only Republican who dissented. Even Rob Johnson, the first one openly objected the bill, and Susan Collins, the one who was forever unsure, voted for the bill after getting something they wanted. Republicans will now move on to reconcile the versions of House and Senate, starting as soon as Monday. The party targets to put the legislation for President Donald Trump's signature by the end of the year.
To summarize some key points of the versions, both bills would cut corporate tax rate to 20% from 35%. House version will start that corporate tax cut in 2018 while Senate version will start in 2019. Senate version will only provide temporary tax relief to individuals, ending the cut in 2026. Meanwhile, both bills would ad more than USD 1.4T in federal deficit over a decade.
US equities survived Russian Probe jitter, closed strong
The optimism on the tax bill pushed major US equity indices to record high last week. DOW reached as high as 24327.82 before closing at 24321.59. S&P 500 reached as high as 2657.74 before closing at 2642.22. NASDAQ also reached 6914.19 before closing at 6847.59. There are two key points to note regarding the stock markets. Firstly, NASDAQ clearly underperformed as investor fled from tech to banking after Fed Chair nominee Jerome Powell said current banking regulations were "tough enough" and hinted his preference on easing them.
Secondly, stocks suffered sharp intraday selloff on Friday on news that the Russian probe is getting closer and closer to the White House. Former national security adviser Michael pleaded guilty confessed lying to FBI regarding his contacts with Russian Ambassador Sergey Kislyak. And there could be a possibly testimony of Flynn against Trump ahead. In any case, it's very likely that the Russian Probe would widen further. The news sent DOW to as low as 23921.90 on Friday before ending at 24231.59, down just -0.17%.
The strong rebound in DOW has indeed showed much resilience in the index. And the intraday dip was merely a knee jerk reactions. We'd pointed out in prior report that after a year of working with Trump, the Republicans finally found their way. And that is, ignore his political outcries and carry on business as usual. The development of the tax bills showed that House and Senate Republicans were working on their own. So, news about the Russian Probe could cause some jitters in the markets but unlikely a trend change.
DOW heading to 24642 as up trend extends
DOW's strong breakout last week indicates that the long term up trend is picking up solid momentum again. Near term outlook will stay bullish as long as 23602.12 resistance turned support holds. Next target is 161.8% projection of 20379.55 to 22179.11 from 21731.12 at 24642.80. We'll be cautious on near term topping there. But break will pave the way to 200% projection at 25330.34 next.
TNX stays near term bullish
Similar jitter was seen in 10 year yield on Friday, when it dipped to as low as 2.315 but closed at 2.362. TNX is so far holding on to 55 day EMA, and well above 2.273 key support. Thus, it's maintaining near term bullish outlook. For the moment, we'd expect the TNX to resume the rebound from 2.034 through 2.475 to 2.621 key resistance later. The development in stocks and yield would provide the needed support for Dollar index to rebound.
DXY could be finishing pull back soon
It's too early to say whether DXY's pull back from 95.15 has completed after drawing support from 61.8% retracement of 91.01 to 95.15 at 92.59. But we'd maintain that 91.91/3 cluster support is a key support region (38.2% retracement of 72.69 to 103.82 at 91.93). At this point, we'd favor downside to be contained well above 91.01 low. Break of 94.16 resistance should then resume the rebound from 91.01 through 95.15.
DAX showed its vulnerable
Development of Euro will be a crucial factor on the fate of the Dollar index. Before looking ahead the common currency, we'd like to point out that European stocks were surprisingly weak in spite of positive economic data. Some might attribute Friday's sharp fall in DAX to the news regarding Russian Probe in the US. But after all, prior range trading and the sharp downside breakout does show much vulnerability. Such vulnerability might be due to uncertainty over German coalition talks. Or it could be due to the concerns over the large swing in Eonia which could be due to market stress. We're uncertain on the reason yet but the development is worth close attention.
Euro struggled despite positive data
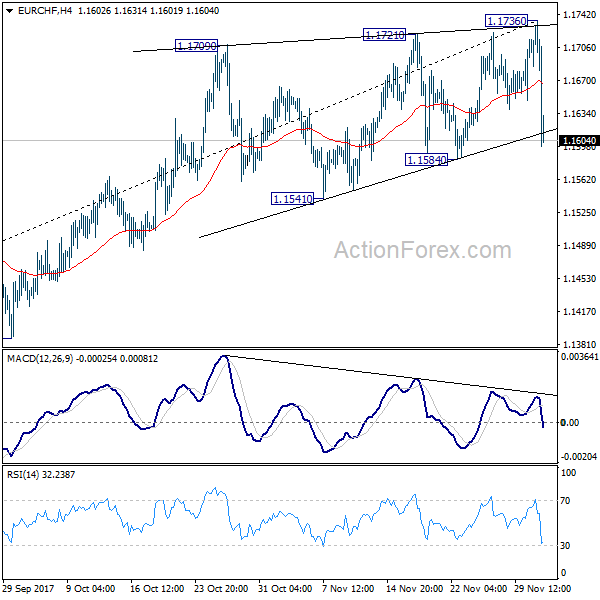
While Euro is maintaining near term bullishness against Dollar, Yen, Swiss Franc and Aussie, momentum is getting more unconvincing after the last up swing. In particular, bearish divergence is clearly seen in 4 hour MACD in EUR/CHF with recent price action in terminal triangle shape. Near term reversal could be around the corner.
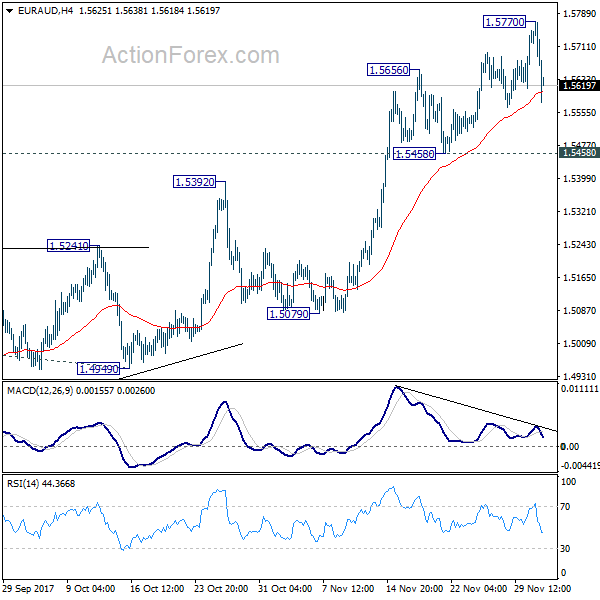
EUR/AUD could have formed a short term top at 1.5770 and deeper fall would be seen back to 1.5458 support and below. The cross might only get enough support near to 1.5226 key level.
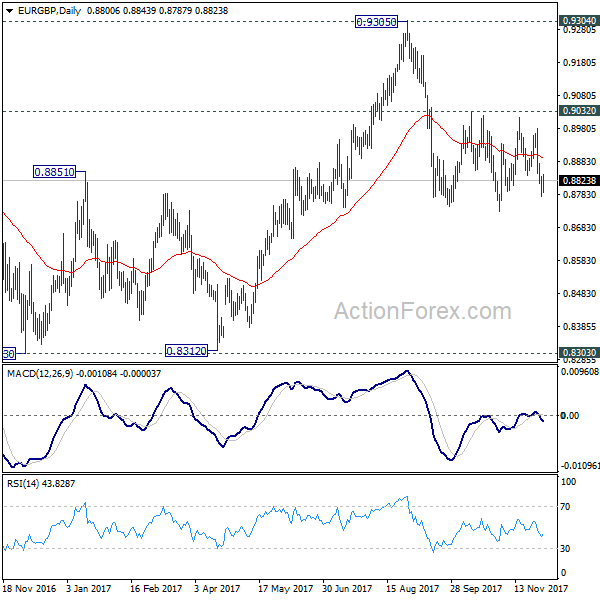
EUR/GBP has been range trading since September. Technically, consolidative price actions indicate fall from 0.9305 is not completed yet. Fundamentally, recent breakthrough in Brexit negotiations suggest that there could finally be a breakthrough in the December EU summit to move on to trade negotiations. In that case, EUR/GBP could finally resume the fall from 0.9305 towards next key level at 0.8303.
EUR/JPY failed to sustain above long term fibonacci level of 61.8% retracement of 149.76 to 109.03 at 134.20 after multiple attempt. A break of 131.16 support will at least reversal the near term trend.
Trading strategy
Regarding trading strategies, there two options to consider. Canadian Dollar could be a candidate to buy as strong employment data revived hop for more BoC rate hike next year. AUD/CAD is a good one fundamentally on policy divergence but it's too close to 0.9591 support. CAD/JPY could also finished recent pull back from 91.62 but there China stock rout may not be completed yet. And there seems to be an underlying theme of flattening yield curve that would give Yen some support. And we'd prefer not to sell USD/CAD as Dollar could be boosted by passage of the tax bill.
Another option to consider is selling Euro. For example, EUR/CAD could have topped at 1.5371 after failing to sustain above 1.5279 resistance (2016 Nov high). But after climax selling on Friday, EUR/CAD could stage a brief recovery first. Selling EUR/GBP could on be consider on positive Brexit news. But then it could also have another up-leg as recent consolidation extends, before finally staging a downside breakout. Hence, patience is required in both short strategy. Considering the clearer technical picture, we'd try to sell EUR/GBP on recovery to 0.8880, around mid point of recent range, with a stop at 0.9050. 0.8300 will be put as the target first.
GBP/JPY Weekly Outlook
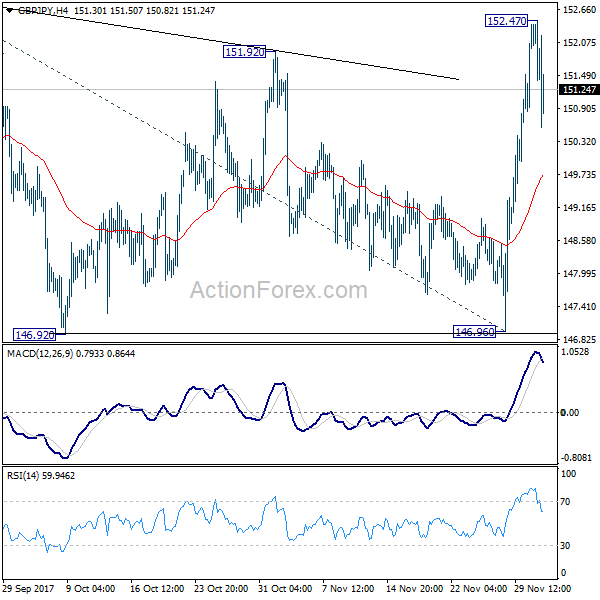
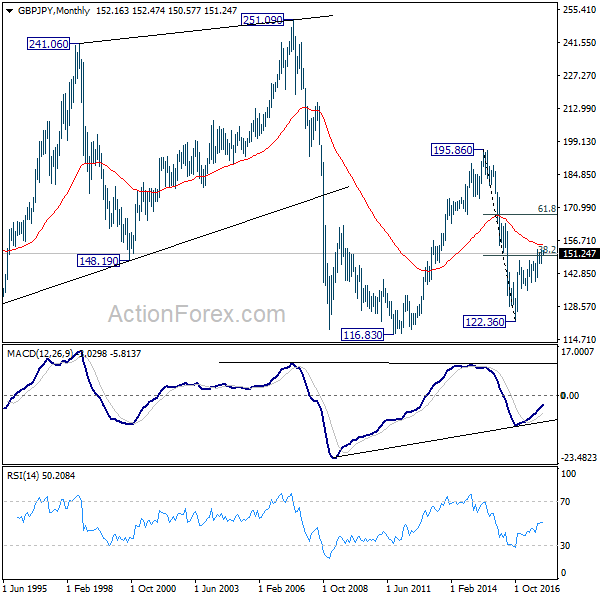
GBP/JPY rose to 152.47 last week but failed to take out 152.82 high and retreated. Initial bias is neutral this week first. At this point, we're favoring the case that consolidation from 152.82 has completed at 146.96 already. Break of 152.82 will resume medium term rally to 61.8% projection of 139.29 to 152.82 from 146.96 at 155.32. This will be the preferred case as long as 146.96 support holds.
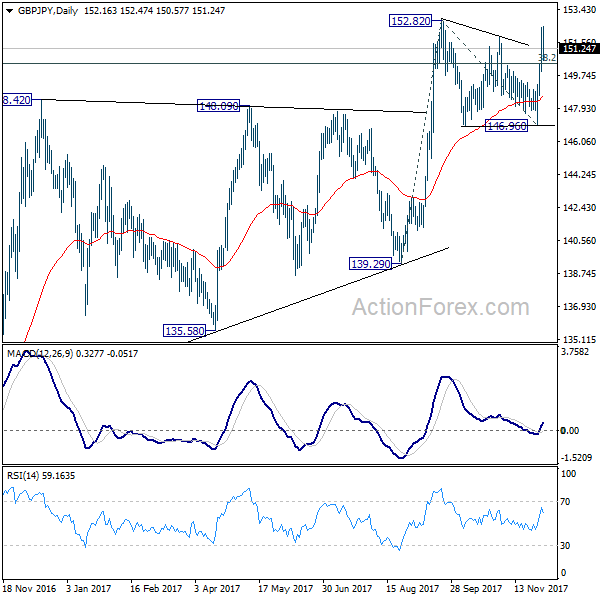
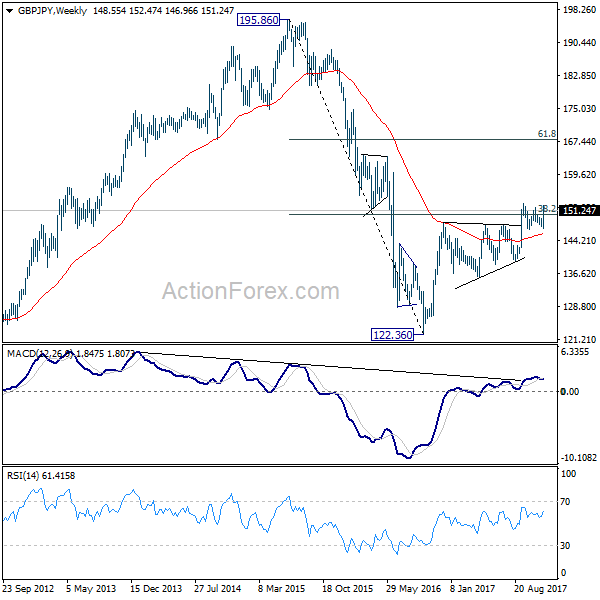
In the bigger picture, medium term rebound from 122.36 is still expected to resume after consolidation from 152.82 completes. Firm break of 38.2% retracement of 196.85 to 122.36 at 150.43 will carry long term bullish implications. In that case, GBP/JPY could target 61.8% retracement at 167.78. However, break of 46.96 support will indicate rejection from 150.43 key fibonacci level. And the three wave corrective structure of rebound from 122.36 will argue that larger down trend is resuming for a new low below 122.26.
In the longer term picture, current rebound argues that the down trend from 195.86 (2015 high) has already completed at 122.36. Focus is now on 55 month EMA (now at 154.76). Firm break there will suggest that rise form 122.36 is developing into a long term move that target 195.86 again. And, price actions from 116.83 (2011 low) is indeed a sideway pattern that could last more than a decade. However, firm break of 139.29 will suggests that the long term down trend is still in progress and could break 116.83 low ahead.
GBP/JPY Weekly Outlook
GBP/JPY rose to 152.47 last week but failed to take out 152.82 high and retreated. Initial bias is neutral this week first. At this point, we're favoring the case that consolidation from 152.82 has completed at 146.96 already. Break of 152.82 will resume medium term rally to 61.8% projection of 139.29 to 152.82 from 146.96 at 155.32. This will be the preferred case as long as 146.96 support holds.
In the bigger picture, medium term rebound from 122.36 is still expected to resume after consolidation from 152.82 completes. Firm break of 38.2% retracement of 196.85 to 122.36 at 150.43 will carry long term bullish implications. In that case, GBP/JPY could target 61.8% retracement at 167.78. However, break of 46.96 support will indicate rejection from 150.43 key fibonacci level. And the three wave corrective structure of rebound from 122.36 will argue that larger down trend is resuming for a new low below 122.26.
In the longer term picture, current rebound argues that the down trend from 195.86 (2015 high) has already completed at 122.36. Focus is now on 55 month EMA (now at 154.76). Firm break there will suggest that rise form 122.36 is developing into a long term move that target 195.86 again. And, price actions from 116.83 (2011 low) is indeed a sideway pattern that could last more than a decade. However, firm break of 139.29 will suggests that the long term down trend is still in progress and could break 116.83 low ahead.
EUR/JPY Weekly Outlook
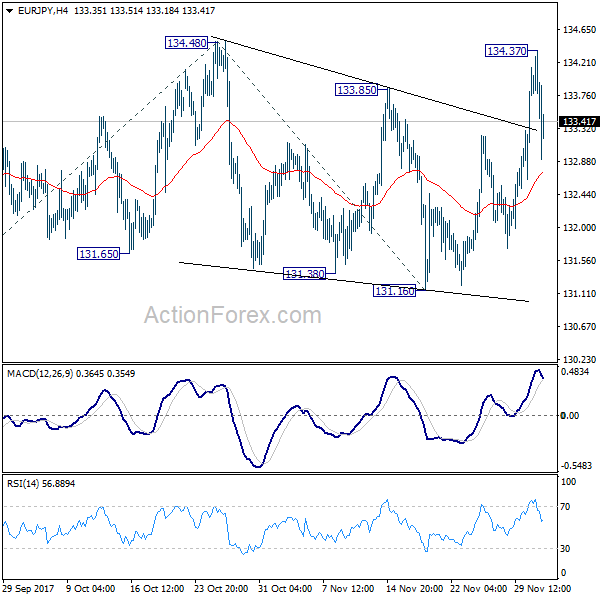
EUR/JPY rose to as high as 134.37 last week but failed to take out 134.48 high and retreated sharply. Initial bias is neutral this week first. For the momentum, we're favoring the case that medium term up trend is nearly ready to resume. Break of 134.48 will target 61.8% projection of 127.55 to 134.48 from 131.16 at 135.44 and then 100% projection at 138.09. However, firm break of 131.16 support will now indicate near term trend reversal and turn outlook bearish for 127.55 key support.
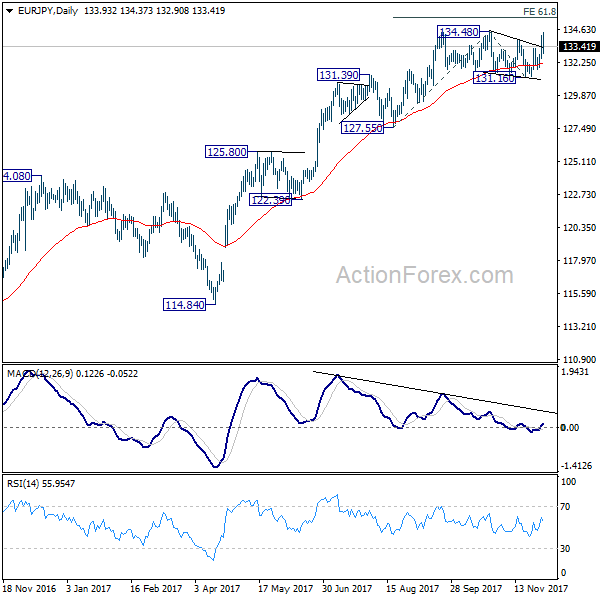
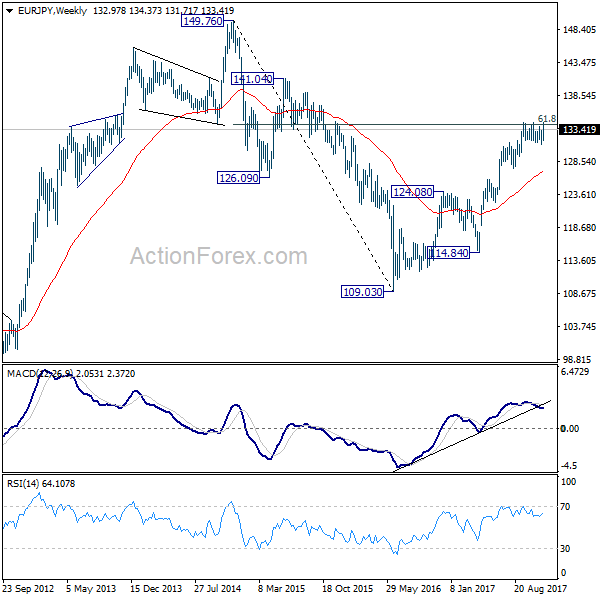
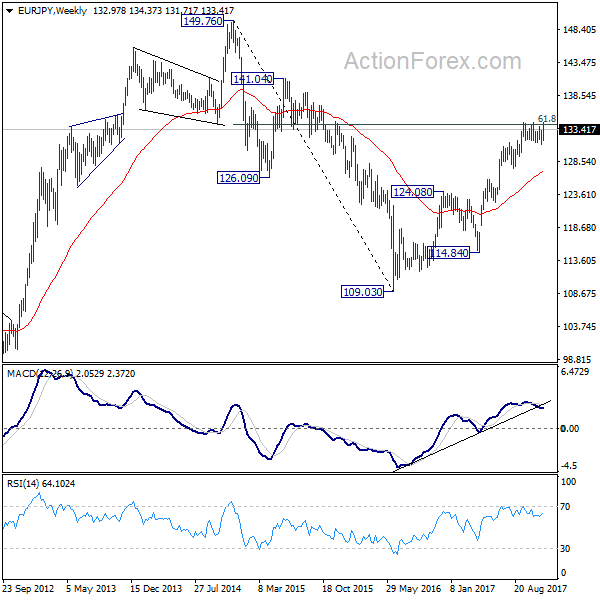
In the bigger picture, medium term rise from 109.03 (2016 low) is seen as at the same degree as the down trend from 149.76 (2014 high) to 109.03 (2016 low). 61.8% retracement of 149.76 to 109.03 at 134.20 is already met. Sustained break there will pave the way to key long term resistance zone at 141.04/149.76. However, break of 127.55 support will suggest medium term topping and will turn outlook bearish for deeper fall back to 114.84/124.08 support zone at least.
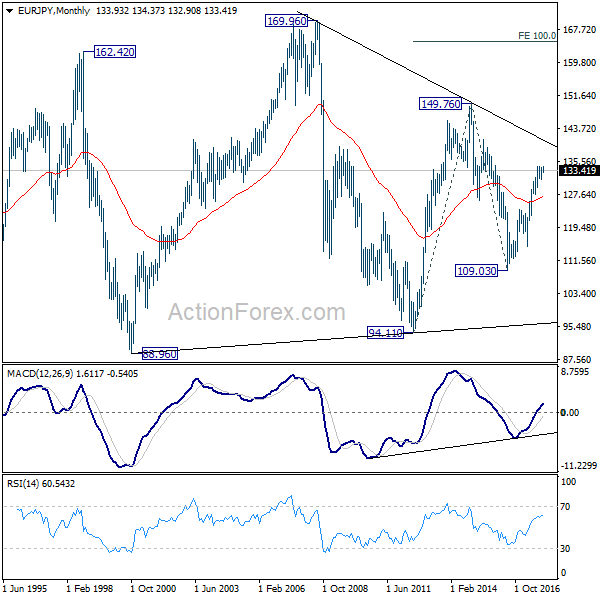
In the long term picture, at this point, there is no clear indication that rise from 109.03 is resuming that from 94.11. Hence, we'd be cautious on topping below 149.76 to extend range trading. Nonetheless, firm break of 149.76 will indicates strong underlying buying. In such case, EUR/JPY will target 100% projection of 94.11 to 149.76 from 109.03 at 164.68.