Sample Category Title
ISM Manufacturing: Solid Gains, Solid Growth Ahead
Overall, the ISM purchasing managers index came in at 58.2 with solid gains once again in production, employment and orders. Input prices continue to show upward pressure and restraint on profits.
Despite Modest Retreat in Headline, Production Remains Strong
The ISM manufacturing index slowed ever so slightly in November to 58.2 from 58.7 (top graph). The composite index is coming off a cycle high of 60.8 in September and with a six-month average of 58.4, the index continues to signal firmness in the manufacturing sector. For the year ahead, we expect quarterly GDP gains of 2 percent or greater.
Subcomponent details are encouraging. The production index, for example, has been above 60 since June and came in at 63.9 in today's report for November; that's the highest reading since March 2011. Fourteen industries reported gains in production including paper, furniture, plastics & rubber and machinery.
As for employment, that index came in at 59.7, above its six-month average of 58.7 with 11 of 18 industries reporting employment growth. This is a plus for the employment numbers to be reported next Friday. Industries reporting gains in employment include textile mills, machinery, computer products and paper. We anticipate that job gains in the first half of 2018 will be in line with the 2017 pace and thereby support continued consumer income and spending gains.
New Orders—Signal of Growth Ahead
New orders came in at 64.0 in November, above the 63.4 for October and the 62.7 six-month average. This is a good signal of continued growth ahead (middle graph). Fourteen of 18 industries showed growth in orders, including electrical equipment, appliances, paper, furniture, plastics and machinery. The gains in new orders are solid and broadly based. Foreign sources of demand contributed to the overall strength in orders as new export orders came in at 56.0 in November, which was in-line with the six-month average. Eight industries reported growth in new export orders. The "backlog of orders" subcomponent came in at 55.0 in November. Rising backlogs are another forward indication that manufacturing production will continue ahead.
Input Cost Pressures Continue to Increase
Rising commodity prices have led to some cost pressures in the nation's factory sector and this is reflected in the 65.5 reading on prices paid (bottom graph). Fifteen of the 18 industries surveyed indicated paying higher prices for their inputs including plastics, textile mills, machinery, food & beverage and paper, curbing profit growth in these industries.
Commodities up in price included aluminum (13 straight months), corrugated boxes (14 straight months), caustic soda (5 months) and hot rolled steel (12 months). The rise in the ISM prices index does intimate upward pressure on core finished goods in the producer price index.
Canadian Growth Slows, but Not as Much as Expected
A spate of indicators released this morning show continued strength in Canadian domestic demand, improved business activity and a dip in the unemployment rate to a 9-year low.
Slower Growth Sustained by Domestic Demand
Real GDP growth in Canada came in at an annualized pace of 1.7 percent in the third quarter. In each of the first two quarters of the year, Canada boasted the fastest growth of any G7 economy, so this is clearly a slowing in the growth rate. That said, the consensus had anticipated an even bigger slowdown, so today's report is a bit better than expected.
Business spending declined in seven out of eight quarters in 2015 and 2016 before bouncing back in the first couple of quarters this year. Business investment picked up, growing at a 3.5 percent annualized pace and lifting headline growth by 0.7 percentage points.
Inventories: What Goes Up…
Inventories increased for the fifth time in the past five quarters. In fact, stockpiles have been growing in double digits on a percentage basis in each quarter this year. As a result, inventories added another 1.1 percentage points to the overall growth rate.
We are concerned that a reversion to the trend-pace of inventory investment will eventually result in a drag on GDP. A mere slowing in the pace of inventory investment translates into a drag on growth in GDP accounting. For example, since the start of 2010, the average pace of inventory investment has been 6.7 percent. If inventories grew at that pace in Q4, it would result in a drag on GDP growth of more than 2.5 percentage points. We do not yet have much data to form an outlook on fourth quarter inventories, but it is something that merits watching closely.
More Help from the Consumer, but Trade Rains on the Parade
Consumer spending continued to expand just as it has in every period since the second quarter of 2009. We have been cautioning in recent quarters that household debt levels in Canada are getting worryingly high. If Canadian households begin to hold back on outlays in an effort to bring down debt levels, it would clearly be a headwind to the uninterrupted run of consumer spending growth. For now, the 4.0 percent annualized pace of spending was sufficient to lift third quarter growth by 2.3 percentage points.
So if all these measures of domestic demand were positive, where was the weakness? In a word: trade. A steep decline in exports and little change in imports resulted in a 3.4 percentage point drag from net exports.
In separate reports also released this morning, we learned that Canadian jobs increased 79.5K and the unemployment rate fell to 5.9 percent, a nine year low, and the Markit Canada Manufacturing PMI climbed to 54.4.
The Canadian dollar strengthened on this morning's news, but we still expect the Bank of Canada to remain on hold at its meeting on Wednesday of next week.
Week Ahead – RBA and BoC Meet; Aussie GDP and US Jobs Report Eyed
The first week of December will get off to a packed start with a number of key indicators and central bank meetings set to keep traders busy. Among the highlights are Australian GDP figures for the third quarter, European industrial output figures and US nonfarm payrolls. Also in focus are central bank meetings in Australia and Canada.
RBA to hold rates as Aussie GDP rebounds
The Australian dollar will be under the spotlight next week as a flurry of economic data is due out of Australia as well as a policy meeting by the Reserve Bank of Australia. Monday's business inventories numbers and Tuesday's current account figures for the third quarter will be a good indication to Wednesday's GDP report. Australia's economy is expected to have expanded by 0.7% in the third quarter. This is slightly below the prior quarter's 0.8% rate but it takes the annual pace up to 3.0% from 1.8% as last year's shock contraction in third quarter GDP drops out of the calculation.
A stronger reading may provide the aussie with a bit of a boost but is unlikely to change the bearish outlook for the currency given the subdued inflation picture in the country. The RBA should give its latest thoughts on the growth and inflation outlook on Tuesday when it announces its latest policy decision. No change in rates is expected from the RBA but its statement will be scrutinized for any shift in its language. Also important will be the October retail sales and trade balance on Tuesday and Thursday respectively.
Apart from the Australian data, the aussie will also have to contend with Chinese releases next week (the aussie is regarded as a liquid proxy for China's economy due to Australia's export dependency with China). Friday will see the release of the monthly trade data for November, which should indicate how exports and imports performed during the month. They will be followed by November producer and consumer prices on Saturday.
Sticking to Asia, Japan will publish its second estimate of GDP growth in the third quarter on Friday. An upward revision to the preliminary estimate of 1.4% is likely after data this week showed business capital expenditure accelerated to 4.2% in the third quarter from 1.5%.
Bank of Canada to stand pat
A December rate hike by the Bank of Canada was looking like a strong possibility not that long ago but those expectations have receded on dovish remarks by BoC officials and softer economic data in recent weeks. The Bank is widely anticipated to keep its overnight rate unchanged at 1% for the second straight meeting on Wednesday. However, it may provide some forward guidance about the timing of the next rate hike in its statement, which may not be that long away given this week's November employment and third quarter GDP numbers that surprised on the upside. A hawkish statement could help the Canadian dollar move further away from one-month lows versus its US counterpart.
Industrial output and Brexit in focus in Europe
The Eurozone economy has been going from strength to strength in 2017 and data due next week is expected to further confirm this view. The third estimate of Eurozone growth in the third quarter is expected to remain unrevised at 0.6% on Thursday. The final readings of the services and composite PMIs are also forecast to show no revision on Tuesday. Other business surveys out of the euro area will include the sentix index on Monday, with a slight fall expected, as well as producer prices and retail sales figures on Monday and Tuesday respectively.
Germany and France will publish industrial production and trade figures for October. German industrial output is expected to see a 1.1% month-on-month rebound on Thursday after a sharp drop in the prior month. French output is forecast to see a small dip during the month in Friday's numbers.
Across the channel, the UK will also release industrial output and trade figures. As a slowdown in consumer spending drags on the dominant services sector, the manufacturing sector is starting to become a bright spot in the British economy as rising global demand and a weaker sterling finally start to lift UK exports. Both industrial and manufacturing output are expected to rise by just 0.1% m/m in October, but the annual rates should quicken to the fastest since late 2016. Also to watch next week are the construction and services PMIs out on Monday and Tuesday, respectively.
A bigger potential mover for the pound though will likely be the outcome of the meeting between British Prime Minister Theresa May and European Commission President Jean-Claude Juncker and EU chief Brexit negotiator Michel Barnier in Brussels on Monday. After this week's headlines that the UK and the EU are very close to an agreement on the Brexit divorce settlement, any setbacks in the negotiations over the next seven days could knock sterling sharply below its current two-month highs versus the US dollar.
US hourly earnings eyed in NFP report
Friday's nonfarm payrolls report will be the main focus in next week's US calendar. But before then, there will be plenty of other data to occupy investors. October factory orders will start the week on Monday, followed by the goods trade balance on Tuesday. The ISM non-manufacturing PMI for November will also be watched on Tuesday, which hit a 12-year high in October. The preliminary reading of the University of Michigan's consumer confidence index on Friday will be important too but all eyes will be on the November jobs report.
The US economy added 261k jobs in October as the labour market bounced back from the disruption caused by the hurricanes in September. Jobs growth is forecast to ease to around 188k in November, though that's still a strong figure considering the economy is close to full employment. The unemployment rate will likely remain steady at a 17-year low of 4.1%.
With recent US data already pointing to continued solid growth in the US and a December rate hike fully priced in by the markets, the NFP report is unlikely to be a game changer unless there was to be a big surprise in wage growth. Average hourly earnings are expected to rise by 0.3% m/m in November, up from 0% in October and pushing the annual rate to 2.9%, which would be the highest in nearly a year. Faster wage growth ahead of the December FOMC meeting when Fed policymakers publish their quarterly projections on the rate path could lead to a more hawkish dot plot chart.
US: Manufacturing Activity Softens a Touch in November But Remains Healthy
The Institute for Supply Management (ISM) index of manufacturing fell 0.5 points to 58.2 in November, largely in line with market expectations for a 58.3 reading. Nevertheless, the index remains well in expansionary territory - a fifteenth consecutive month of growth.
The report details were mixed, with declines in the components previously affected by hurricanes offsetting gains in more forward looking indicators. For instance, both supplier deliveries (-4.9 points to 56.5) and inventories (-1 to 47) declined from hurricane-elevated levels. In contrast, production advanced 2.9 to 63.9 and new orders rose 0.6 to 64.
Prices paid index continued to fall back from September's hurricane-boosted high of 71.5, giving back 3 points to 65.5 in November.
The spread between new orders and inventories - a good leading indicator of activity - widened in November to 17 (+1.6 points), suggesting that the manufacturing is likely to hold onto the recent gains in the coming months.
Fourteen of the eighteen manufacturing industries reported expansion in November, with paper products, machinery, and transportation equipment registering the strongest advances. Two industries recorded a contraction in activity (wood products, petroleum and coal products), while two others were unchanged in November.
Key Implications
As is sometimes the case with the ISM manufacturing index, the details of the report painted a more positive picture of the manufacturing sector than the headline index would suggest. The surge in the supplier deliveries following this summer's hurricanes was still unwinding in November. This weighed on the headline index, more than offsetting the positive contributions from a rise in production and new orders. Comments from business executives further reinforce the notion of a booming U.S. manufacturing sector, with record sales being reported in some sectors and limited signs of the typical seasonal slowdowns taking hold at year-end. While some of this is likely linked to hurricane rebuilding efforts, it's also a reflection of persistently strong domestic and global demand.
With the prospect of corporate tax reform in some form ever closer to being realized, there is a chance that, in addition to redistribution to shareholders, some of the extra cash may find its way into capital goods produced by U.S. manufacturers. Should this be the case, the 2017 boom in manufacturing is likely to carry into the New Year and continue to support the U.S. economy on its path to full capacity.
Dollar Holds Positive Bias, Despite Mixed Context
- European equities fell off a cliff this morning despite strong EMU data. Major indices lost up to more than 1%, but reversed a big part of the losses as sentiment improved in the US. European indices decline less than 0.5%. US equities open with limited losses. The Nasdaq (-0.5%) underperforms again.
- Global manufacturing expanded at the fastest pace in years last month and the second-best in two decades in the euro zone, driven by robust demand and bolstering the case for central banks to shift to tighter monetary policy. The EMU manufacturing PMI was upwardly revised to 60.1.
- The IHS Markit/CIPS UK Manufacturing PMI jumped to 58.2 from an upwardly revised 56.6 in October, hitting its highest level since August 2013. The report suggests that the manufacturing sector will support the UK economy even as consumer spending is eroded by a decline in consumers' disposable income.
- US Senate Republicans will grapple today with the possibility of adding a tax increase to sweeping legislation meant to cut taxes on businesses and individuals, aiming to win support from fiscal conservatives worried about the bill's impact on the federal deficit.
- Hiring in Canada unexpectedly accelerated in November. The unemployment rate dropped to 5.9%; the lowest level since February 2008. Employment increased by 79,500 last month, well above economists' forecasts for a gain of 10,000 jobs. Average hourly wages also continued to accelerate, rising 2.7 percent from last year. The Canadian dollar jumped sharply higher after the report. USD/CAD trades in the mid 1.27 area.
- US manufacturing expanded at a robust pace in November (58.2 from 58.7 vs 58.3 expected) amid a burst of production and rising orders that signal durable gains in the industry, figures from the Institute for Supply Management showed.
Rates
Bund tests 163.43 resistance in risk off sentiment
Global core bonds gain ground today with the Bund outperforming the US Note future. The US Senate's tax reform drive lost momentum last night after a congressional watchdog determined the bill would send the budget deficit skyrocketing. A vote will now take place today instead of yesterday. The delay caused some risk aversion on stock markets and supported core bonds via safe haven flows in the first hours of European dealings. The bond rally petered out around noon though and the US Note future even started losing ground. Technically, the Bund tested the upper bound of its sideways trading range (160.24-163.43) but a break didn't occur. The European eco calendar didn't influence trading with only a slight upward revision to the November manufacturing PMI.
At the time of writing, German yields decline by 0.9 bps (2-yr) to 2.6 bps (10-yr). The US yield curve flattens with yield changes varying between +0.8 bps (2-yr) and -3.6 bps (30-yr). On intra-EMU bond markets, 10-yr yield spread changes versus Germany narrowed up to 3 bps (Belgium) with Greece (+3 bps) and Portugal (+5 bps) underperforming.
Currencies
Dollar holds positive bias, despite mixed context
The dollar traded with a positive bias today even as incentives from other markers were diffuse. Risk sentiment was outright negative in Europe this morning, but the dollar held up well. The US currency is gaining further ground this afternoon as US investors turn again more optimistic. EUR/USD trades in the 1.1870 area. USD/JPY trades at 112.65, near the intraday top.
Yesterday evening and overnight, the dollar showed quite a diffuse picture. USD/JPY was supported by a rise in US equities and higher US yields yesterday evening. At the same time, EUR/USD also rallied even as the interest rate differentials widened in favour of the dollar. Technical factors and end-of month repositioning might have been at work. The moves slowed this morning in Asia. USD/JPY stabilized in the mid 112 area. EUR/USD hovered in the 1.1925 area.
Risk sentiment deteriorated quite substantially soon after the open of the European equity markets. Uncertainty on the fate of the Tax Bill in the US Senate maybe played a role. However, (European) equities recently already showed tentative signs that the uptrend might become a bit exhausted. The (EMU) eco data were not to blame. The final EMU manufacturing PMI was even revised slightly higher to 60.1, a multi-year peak. However, the report couldn't stop the bleeding at that time. Core bond yields lost about 3-4 bps (10-y) but the interest rate differential between the euro and the dollar was little changed. The risk-off trade eased again as US traders entered the fray. US equities opened with only modest losses, the Nasdaq underperforming.
Of late, a decline in core yields and/or a risk-off context often weighed on the dollar, but this was not the case today. USD/JPY held up remarkably well. The pair hardly ceded any ground this morning and even set a minor top for the week this afternoon (currently around 112.65). The dollar also regained slightly ground against the euro. EUR/USD trades in the 1.1870 area. Markets (FX) closely monitor the headlines from the tax debate in the US Senate. The ISM manufacturing in the US is also interesting. However, the reaction to the UK/EMU data this morning suggests that the focus of (currency) traders is elsewhere. In globo, the dollar performed rather well today, given the price action on other markets. A harbinger of better times to come?
Sterling awaits clarity on Brexit process
Sterling trading showed no clear trend today. Over the previous days, markets saw the Brexit-glass half-full on tentative signs that the UK and the EMU were making progress on the conditions that the EU wants to be fulfilled to start negotiations on the future relation between the two parties. However, the issue of the Irish border proves to be a hard nut to crack. Markets had hoped that big progress would be announced after a meeting between EU president Donald Tusk and UK PM May scheduled for Monday 04 December. However, this scenario is becoming less likely. Sterling lost slightly ground against the euro and the dollar. EUR/GBP hovered mostly in the lower half of the 0.88 big figure (currently 0.8810). Cable is drifting back below the 1.35 barrier, but part of this decline is due to the USD rebound this afternoon. This morning, the UK November manufacturing PMI printed at a very strong 58.2 (from 56.6, 56.5 was expected), but the report had no lasting impact on sterling trading.
Canadian Job Growth Enters the Stratosphere, with Wages Starting to Follow
Highlights:
- Employment rose 80k in October, the 12th consecutive monthly increase and the best gain in more than five years.
- The unemployment rate plummeted to 5.9%, one of only a handful of sub-6% readings in the last 40 years. The decline was all employment driven—labour force participation was unchanged in November.
- Wages have accelerated sharply in recent months, with a bit of help from higher minimum wages in several provinces. Wage growth picked up to 2.7% year-over-year from as low as 0.5% in April.
- Job growth was widespread but led by Ontario, Quebec and British Columbia. Unemployment rates declined substantially in the former two provinces and Quebec's rate is now the lowest on record.
Our Take:
Where do we start? Canada's longest hiring streak in a decade continued with a whopping 80 thousand jobs added in November. Average employment growth of 32.5 thousand per month over the last year is the fastest pace since 2007. The unemployment rate fell 0.4 ppts in November, the largest monthly decline since 2005. And that was without a dip in the labour force. The rate, now at 5.9%, was only lower for a single month prior to the last recession—a time when the economy was operating beyond its longer run capacity limits. The only fly in the ointment was a sizeable drop in average hours worked that retraced much of the increase seen in recent months. The Bank of Canada has flagged below-trend hours worked as a sign of labour market slack, but other indicators are clearly pointing to very tight conditions.
For all the impressive numbers just listed, perhaps our favourite in today's report is wage growth. Average hourly wages for permanent employees were up 2.7% from a year ago in November, the best pace in a year and a half. Much of that increase has come in the last few months as wage growth accelerated sharply—finally a bit of evidence that tight labour market conditions are feeding through to wages. If that trend holds up it will be hard for the Bank of Canada to remain on the sidelines much longer. Our forecast assumes the bank will raise rates again in April when they have more information on Nafta renegotiation and how households are handling this year's rate hikes. If anything, today's blockbuster employment report raises the risk of an earlier move.
Growth in Canada Slowed in Q3 – But to a Still ‘Above-Potential’ Rate
Highlights:
- Canadian Q3 GDP rose 1.7% - broadly in line with market expectations for a 1.6% gain.
- Household spending was stronger-than-expected and business investment rose for a third straight quarter
- GDP rose 0.2% in September, marking somewhat stronger-than-expected momentum at the end of Q3.
- We continue to expect GDP growth has moderated from the outsized pace from mid-2016 to mid-2017 but to a still 'above-potential' 2% rate on balance.
Our Take:
The 1.7% (annualized) gain in GDP was down from the (unsustainably strong) 3.6% average increase over the prior four quarters. The increase was still modestly above most estimates of the economy's long-run 'potential' growth rate, though. Indeed, the slower GDP growth didn't prevent the unemployment rate from falling again in the third quarter - with the separately released November employment report this morning pointing to further labour market improvement to-date in Q4. GDP growth in Q3 continued to be concentrated in household spending with a stronger-than-expected 4.0% increase that built onto a 5.0% surge in Q2. Government investment spending also jumped higher, though, and business investment rose for a third straight quarter - albeit at a more modest pace than over the first half of the year. Offset came from a large, but expected, pullback in net trade.
Monthly GDP data, also released this morning, were perhaps more encouraging than the quarterly data in terms of near-term growth implications. September GDP rose a stronger-than-expected 0.2% (non-annualized) to more-than-retrace a 0.1% dip in August. That left somewhat stronger momentum at the end of the quarter than we previously assumed. The data is still pointing to a slowing in underlying GDP growth from the outsized pace from mid-2016 to mid-2017 but is also still fully consistent with our - and the Bank of Canada's - view that growth will be sustained at a modestly above trend 2% pace going forward.
Loonie Rallied Strongly after Upbeat Canadian GDP/Jobs Data
Canadian dollar surged against US dollar on Friday and hit three-day low, driven by upbeat domestic GDP and jobs data.
Fresh acceleration retraced over 61.8% of USDCAD's four-day rally which commenced from 1.2680 (Monday's low) and hit the highest at 1.2909 on Thursday.
Canada's economy grew at annualized rate of 1.7% in the third quarter, beating forecast at 1.6%, while economy added 79.5K new jobs in November well above forecasted 10K and jobless rate fell to 5.9% in November from 6.3% in October and 6.2% consensus.
Fresh fall weakened pair's bullish structure which strengthened on acceleration from double-top at 1.2670 zone.
Recovery stall on approach to key 1.2916 barrier and subsequent fall turned near-term bias lower, with close below cracked Fibo 61.8% support at 1.2761, needed to confirm bearish stance and open way for retest of 1.2670 higher base.
Res: 1.2782; 1.2820; 1.2855; 1.2909
Sup: 1.2740; 1.2670; 1.2653; 1.2624
Bond Market Signals: Sign, Sign, Everywhere a Sign
Highlights
- A narrowing US Treasury 10-2yr spread can be an early warning sign that the American economy is headed for a recession, but we don't believe recent dynamics reflect this outcome. Domestic and global quantitative easing (QE), financial regulation, and low inflationary pressures are keeping the spread lower than it would be otherwise.
- For this reason, it is the term premium causing the flattening and not expectations for a monetary policy error, which is different from historic observations. By our estimation, the UST 10-2yr spread conveys a probability of a recession occurring within the next 12 months to be 20-30%. But, when we adjust for the presence of QE, it reduces that outcome to 5-15%.
- One should not look at yield curve dynamics in isolation. When appropriately combined with other leading economic and financial variables, the message is further reinforced that the U.S. economy still has room to run.
There is considerable media discussion surrounding the relative flatness of the U.S. yield curve. With the UST 10-2yr spread at approximately 60 bps, the lowest level in a decade, is it time to sound the recession alarm bells? In short, no. Yield curve compression is certainly a valid and early-warning signal of recession risks, but it's premature to sound the alarm. To understand why, we examine both financial and economic variables to get a better idea on how far away we are from recession.
The Accuracy of the Yield Curve
First, it's important to distinguish the reliability of recession signals offered by yield inversion versus compression. A recession has typically been preceded by an inversion in the yield curve (Chart 1). Clearly, before we hit the stage of inversion, compression must first occur, and various researchers have tried to identify meaningful thresholds that either increase the odds or are a precursor to a looming recession. One such report came from the Federal Reserve Bank of New York, "Monetary Cycles, Financial Cycles, and the Business Cycle". This paper is grounded in a supply-side notion that flat yield curves create conditions that affect bank profitability, bank lending, and subsequent real economic activity. In this paper, the authors use the UST 10yr-3m spread and state that a level below 93 basis points (bps) predicts an increase in the unemployment rate. In turn, this is mostly consistent with a recession occurring within 12-18 months. Today's equivalent spread is very close to that threshold at roughly 100bps.
There are many versions of this "spread" warning signal. Some use the UST 30-5yr spread, and others abide by the spread on minimum yield. This latter approach emphasizes the lowest yield on the UST 10yr observed during the cycle against the current 3 month yield 1. Applying this exercise, the minimum UST 10yr in this cycle closed at 1.50% during Brexit turmoil in 2016 (the intraday level was lower at 1.32%). This means that a cross could happen after the next one or two FOMC rate hikes. But, this pick-and-choose spread analysis can become a bit of a data-mining exercise, which is part of the point we're making. It's important to understand the broader context of yield compression and look at the message that's also being conveyed from other indicators in order to get a clearer read of a recession signals. In other words, the yield curve is a fairly reliable recession-indicator, but by no means is it perfect, and even when it gets it right, it still leaves much interpretation on the exact timing of a downturn.
Specifically, there are long lags associated with a recession signal. Over the last three decades, the UST 10-2yr spread hit zero on average 2 years before a recession. If one sold out of the S&P 500 on this signal, they would have missed significant equity market appreciation over the last 3 cycles.
In addition, the UST 10-2yr signal sometimes misses. During the 1957 and 1960 recessions, the yield curve did not invert. In addition, it has provided a number of false/too early signals over the years. Relative to the NY Fed paper, the 10yr-3m (93 basis point) spread threshold has offered false signals (1997, 1995, and 1963).
The Cause Behind the Flattening:
It is important to keep in mind a few important details regarding a flattening yield curve. First, it is a natural by-product of a central bank hiking cycle. As the Fed conducts its rate hiking cycle, it communicates that the path of rates will rise over the coming years. The UST 2yr reflects the average of expected short rates over that period (plus a term premium). The same is true for the UST 10yr over the 10 period. Given the very forward looking nature of the UST 10yr, at the initial stage of the Fed's rate hiking cycle, that long yield will move up faster than the short end. This generally marks the peak of the 10-2yr spread in a cycle. As the central bank continues to press forward through the rate hiking cycle, the UST 2yr adjusts, hence causing the spread compression. Within our financial forecast, the process of spread compression is not yet complete. We expect a terminal spread of about 35bps, with an understanding that market movements can temporarily push this even lower.
What is interesting in this cycle is that the spread between pure market rate-expectations of the 10yr and 2yr are still very positive (Chart 2), whereas the term premium spread is causing most of the compression. Historically, it is the rate-expectations part of the spread that signals recession (ie: a Fed policy error). So, we are witnessing something new with the compression being the result of the term premium. This reflects the influence of QE, regulation, and low inflation.
Call these distortional impacts or the new status quo, but in both cases, historical yield curve analysis offers little parallel reference to judge the accuracy of its current predictive ability. There was no previous historical context for QE until this cycle. Adjusting the UST 10yr yield solely for the influence of the Fed's asset purchases program lifts the yield by 30 basis points or more. Put another way, we wouldn't be having this discussion on whether narrowing spreads are signalling a recession (Chart 3). When we estimate the probability of a recession using just the UST 10-2yr spread, we find the odds to be around 25-30%, but when we adjust for the presence of QE, it reduces that outcome to about 5-15%.
However, this analysis doesn't take into account the fact that it's not just U.S. monetary policy actions anchoring down the long end of the curve. Many central banks are engaging in similar asset-purchase activity (BoE, ECB, BoJ). In fact, the Federal Reserve is the only central bank that is truly on a normalization path, marked by four rate hikes and early steps towards balance sheet run-off. The majority of the remaining global central banks are, at best, applying less pressure to the emergency stimulus accelerator. We have written numerous times on the tight correlation of long-term UST to international yields (roughly 70% of the movement linked to global common factors). So, the combined purchases of central banks act as an additional weight on long-term yields, layered on top of the usual influences from domestic policy, increased regulatory demand and, of course, flare-ups in geopolitical risk (cue North Korea).
Solid Conditions for Economic Growth
To get a better gauge of risks, we combine the yield curve slope with our Financial Stress Indicator, which captures movements in volatility within equity, bond, and foreign exchange markets (Chart 4). A reading above zero implies a 20% change in the probability of recession and if the indicator moves above 1%, the probability of recession within the next 6 months jumps close to 50%.
One reason other financial market indicators have been so strong is because the U.S. macro backdrop is not only solid, but strengthening. Evidence of this can be found by looking at a broad suite of macroeconomic indicators. For starters, labor market conditions have strengthened considerably. The unemployment rate is below NAIRU and has historically remained there for an average of 3 years preceding a recession. Furthermore, initial claims have continued to trend downwards and have reached their lowest level since 1973 (Chart 5). Both of these measures are in our probability of recession models and if they tick up, we will not only receive a recession signal, but it will also give us a better idea on the window of timing. Realistically, a recession risk is always present in any business cycle, so timing does matter.
On this front, residential investment also paints a picture of an economy that has room to grow. Since, the late 1940's, real residential investment as a share of real GDP has peaked about 3 years prior to the onset of a recession. At the moment, the share is rising, but is historically low. Rising wages should help preserve home affordability in an environment of increasing interest rates, thereby supporting American housing market activity.
Equity prices are another metric of importance. With the Dow Jones and S&P 500 continuing to make new historic highs, current valuations do give some cause for concern. Using metrics including Tobin's Q and CAPE, there is evidence that equity valuations are flashing yellow, rather than red (Chart 6). The recent gains have been fostered in part by optimism surrounding the ability for corporations to increase earnings in response to the global growth surge, low interest rates, and potentially lower tax rates. In this way, there is some justification for current valuations. Further, investor leverage as measured by debit balances in margin accounts at broker dealers has not accelerated to the point of hubris - something that occurred before previous recessions (Chart 7).
Lastly, the production side of the economy also depicts a strong economic backdrop. As illustrated in Chart 8, the ISM Manufacturing Composite Index is clearly in expansionary territory. If this drops to 50 or below, we will have to raise the risk of recession.
FOMC: Can they Read the Sign?
With the changing of the guard at the Fed, and many seats vacant or being filled, it's difficult to know their reaction function to a flatter curve. History has not been on their side. During periods when the 10-2yr yield curve inverted, the Fed continued to hike in 1989, 2000, and 2005. Put differently, they ignored inversion as a recession signal. All periods ended in a recession within 2 years. This is often why economists (including us) refer to recessions as being the outcome of policy errors - i.e. the Fed over-tightens relative to the neutral r*, which suffocates growth.
However, this time around, we are doubtful that the incoming FOMC will ignore the yield curve signal for several reasons. First, the Fed has been very focused on paying attention to market reaction to its policy and communication. If near-term yields start to price too sharp of a policy path relative to the UST 10yr, you can be sure that the Fed will alter communication to help adjust market pricing.
Second, incoming Chair, Powell appears more markets oriented and has not given the impressions of having a dogmatic approach. This, in combination with the changing FOMC composition, their already-cautious policy approach and high media attention, suggests we will see a Fed that proceeds more cautiously to this signal than in the past.
If nothing else, a spread that approaches the zero bound would be a market signal to the Fed that inflation expectations are coming down (due to the anchor on 10yr yields). And, during this cycle, we have seen a Fed that's quite sensitive to the direction and level of inflation expectations. A potential first clue that the Fed is weighing this yield curve predictor more heavily could be another migration down in the near-term part of the dot plot (early 2018), particularly if this occurs against a strengthening U.S. economy and/or fiscal stimulus.
To sum up, key takeaways are:
- Yield compression is a normal late cycle phenomenon, but at 60bps there's plenty of cushion and it is not yet given a recession signal.
- The current level of the UST 10-2yr spread is being distorted by central bank policies, both global and domestic. The spread is low because of the term premium rather than pure expectations for policy rates (the opposite of what we have seen historically).
- The Fed will likely be sensitive to the shape of the yield curve and adjust communication and policy according to the risks it's conveying.
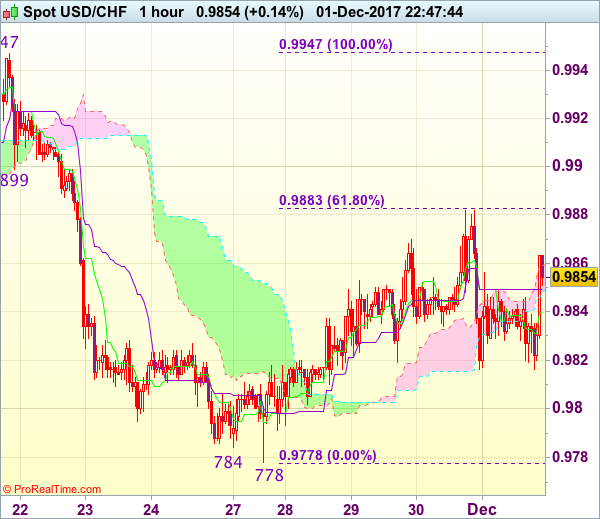
Trade Idea Wrap-up: USD/CHF – Exit short entered at 0.9860
USD/CHF - 0.9855
Most recent candlesticks pattern : N/A
Trend : Near term down
Tenkan-Sen level : 0.9840
Kijun-Sen level : 0.9849
Ichimoku cloud top : 0.9859
Ichimoku cloud bottom : 0.9848
Original strategy :
Sold at 0.9860, Target: 0.9760, Stop: 0.9885
Position : - Short at 0.9860
Target : - 0.9760
Stop : - 0.9885
New strategy :
Exit short entered at 0.9860,
Position : - Short at 0.9860
Target : -
Stop : -
The greenback continued finding good support at 0.9816 and has staged a strong rebound in NY morning, dampening our bearishness and risk of another bounce to 0.9882-83 (yesterday’s high and 61.8% Fibonacci retracement of 0.9947-0.9778) cannot be ruled out, however, reckon upside would be limited to previous support at 0.9899 and price should falter well below resistance at 0.9947, bring another decline next week.
In view of this, would be prudent to exit short entered at 0.9860 and stand aside for now. Below said support at 0.9816 would revive bearishness and signal the rebound from 0.9778 has ended at 0.9882, bring retest of this level later, a break of this support is needed to confirm recent decline from 1.0038 top has resumed and extend weakness towards 0.9730-37 support area but reckon support at 0.9705 would hold from here.