Sample Category Title
Technical Outlook: AUDUSD – Recovery Attempts Show Lack Of Strength For Stronger Correction
The Aussie dollar bounced on Friday after five-day descend found footstep at 0.7550, just ahead of key support at 0.7530 (21 Nov low.
Fresh recovery, propped by weaker greenback, probes above bear-trendline which tracks the downtrend since 20Sep and daily Tenkan-sen / 10 SMA (0.7587).
Upticks were so far unable to clearly break higher and trigger stronger correction of 0.7644/0.7550 downleg.
Failure to break here and take out 20SMA barrier at 0.7611 would keep in play risk of final push towards 0.7530 and bearish continuation on sustained break lower, but bears may stay in extended consolidation before resuming.
Close above 20SMA is needed to sideline immediate bearish threats and signal extension towards next pivotal barrier at 0.7644.
Res: 0.7597, 0.7611, 0.7630, 0.7644
Sup: 0.7551, 0.7530, 0.7500, 0.7475
Pound Continues To Impress, US Tax Bill Vote, Canadian GDP & Employment Generating Excitement
Here are the latest developments in global markets:
FOREX: The dollar retained its strength against the yen, trading near a 1-½ -week high, finding support from rising US Treasury yields, while the euro was last flat on a weekly basis versus the greenback after advancing in the three preceding weeks. Pound/dollar stretched its uptrend to a fresh two-month high amid hopes that the EU and the UK were preparing the ground to take Brexit talks to the next level, entering trade discussions.
STOCKS: The Nikkei 225 finished 0.4% higher, retreating from an earlier advance that saw it rise by 1.2% to reach its highest since 1992; Euro Stoxx 50 futures were 0.1% lower at 0744 GMT; Dow futures were flat, while S&P 500 and Nasdaq 100 equivalents both traded lower by 0.2%.
COMMODITIES: Oil prices edged up after Friday's OPEC/non-OPEC meeting confirmed the long-awaited extension of supply cuts through 2018. WTI crude rose by 0.51% to $57.69 per barrel and Brent jumped by 0.67% to $63.05. Gold was flat around three-week low levels at $1,275.22 per ounce.
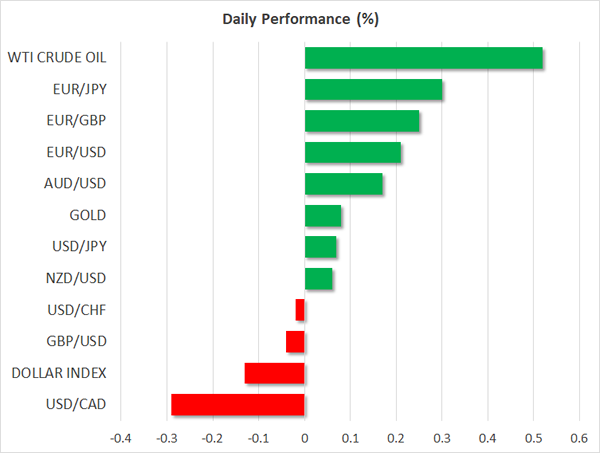
Major movers: Dollar flat as Senate tax vote stalls; pound moves above $1.35
The dollar index was last steady at 92.93. On Thursday, Senate Republicans decided to postpone the tax bill vote for Friday after some members expressed worries about the sustainability of the tax bill version as is. With the cloud around the promised tax cuts getting darker, dollar/yen paused yesterday's uptrend at 112.55 as a strong rally in the 10-year US treasury yields offset the dollar's losses. Euro/dollar increased by 0.17% to 1.1922, while pound/dollar hit a fresh two-month high of 1.3548 following news that the EU and the UK were close to agreeing on two key elements involving the Irish border and the UK's financial settlement to the block – the EU demands such key issues to be solved before Brexit negotiations move to trade talks after the EU summit in the mid-December.
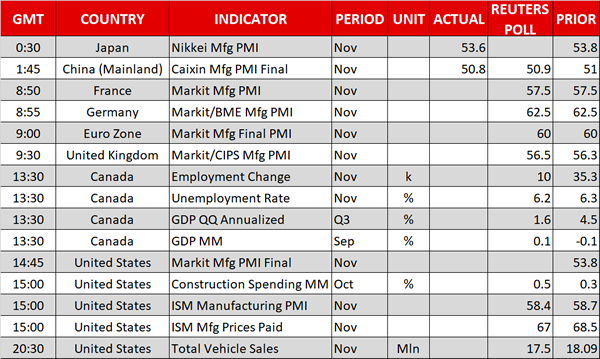
Day ahead: US tax bill vote, Canadian GDP & employment data and manufacturing PMIs from major economies to dominate attention
The eurozone will see the release of the November manufacturing PMI at 0900 GMT. However, given that the release pertains to the final estimate of the measure, it is not an eagerly awaited one. Manufacturing PMI is expected to remain unrevised relative to the flash reading and at its highest in almost seven years (at 60.0).
At 0930 GMT, the November Markit/CIPS manufacturing PMI out of the UK will be released. It is expected to stand at 56.5, its highest since August (September's reading stood at 56.3). A reading above 50 signifies expansion in the sector.
Canada will see the release of important data pertaining to November employment (and unemployment) and growth in economic activity (Q3 and September's) at 1330 GMT. GDP growth is expected to have slowed markedly in the third quarter to 1.6% on an annualized basis from the second quarter's 4.5%. Today's data have the capacity to steer market expectations as regards the timing of the delivery of the next rate hike by the Bank of Canada and consequently can lead to sharp movements in the dollar/loonie pair (among other loonie pairs).
In terms of US data, November's final Markit manufacturing PMI will be released at 1445 GMT, with data on construction spending and ISM's manufacturing PMI following at 1500 GMT. Undoubtedly though, most attention will be on the US Senate and the tax bill vote after yesterday deciding not to vote on the bill, continuing discussions today.
Among Fed speakers that could make some market-sensitive comments, St. Louis Fed President James Bullard will be giving a presentation on the US economy and monetary policy at 1405 GMT and Dallas Fed President Robert Kaplan (an FOMC voting member) will be participating in a Q&A session at 1430 GMT. Philadelphia Fed President Patrick Harker (also an FOMC voting member) will be talking about inclusive economic growth at 1515 GMT.
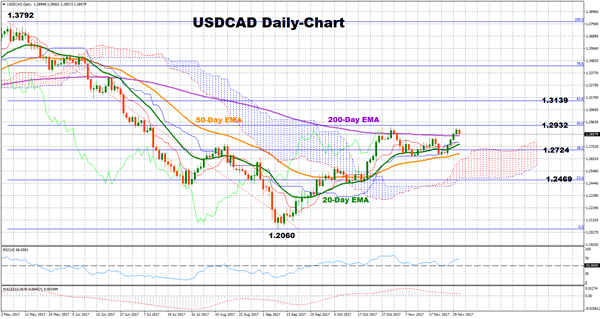
Technical Analysis: USDCAD sending bullish signals in the short-term
USDCAD has been moving sideways around a four-month high since the end of October but the pair maintains a bullish picture both in the short- and the medium-term as it still trends above the exponential moving average lines and the Ichimoku cloud. The RSI is also positively sloped and above 50, giving another positive signal for the short-term. Potential resistance levels could be found between the 50% and the 61.8% Fibonacci retracement levels of the downleg from 1.3792 to 1.2060 (1.2922-1.3125). Yet, USDCAD could postpone the bullish rally for a while if the Canadian data appear better than expected, crawling down to meet the 200-day EMA at 1.2845. Additional support levels could be provided by the 20-day EMA at 1.2777 and the 38.2% Fibonacci mark at 1.2724, before the 23.6% Fibonacci level of 1.2469 comes into view.
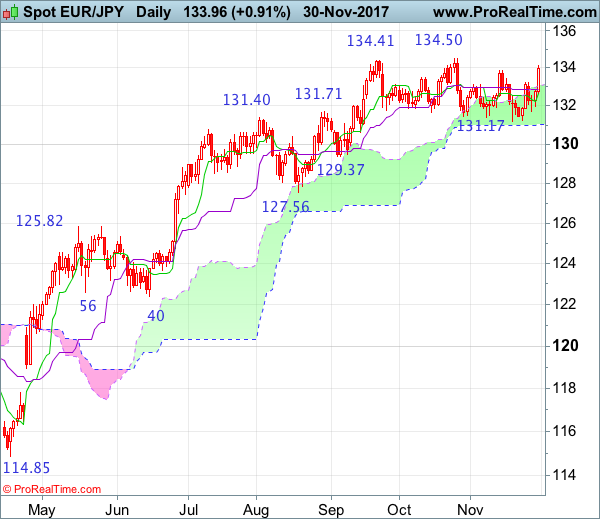
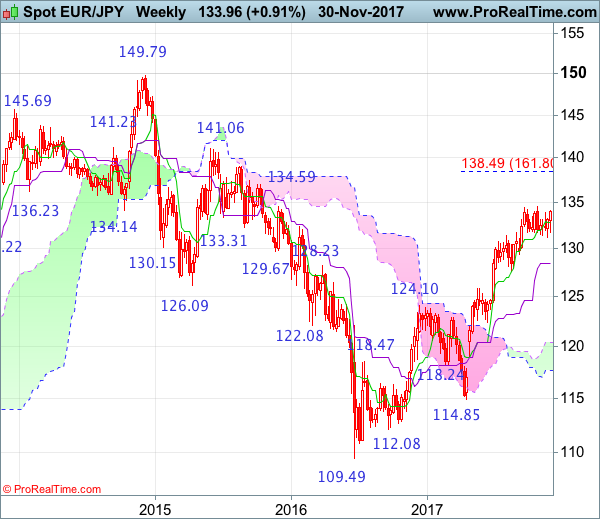
EUR/JPY Candlesticks and Ichimoku Analysis
Weekly
• Last Candlesticks pattern: Window
• Time of formation: 24 April 2017
• Trend bias: Up
Daily
• Last Candlesticks pattern: Hammer
• Time of formation: 18 May 2017
• Trend bias: Up
EUR/JPY – 134.00
Although the single currency did drop earlier this month from 133.89 to our indicated downside target at 131.70 (our short position entered at 133.70 met target at 131.70 with 200 points profit), as euro found good support at 131.17 and staged a strong rebound, suggesting early correction from 134.50 top has ended there and consolidation with upside bias is seen for retest of this level, however, break there is needed to confirm recent upmove has resumed and extend gain to 135.00, however, near term overbought condition should limit upside to 136.00-10 and reckon 136.90-00 would hold from here, price should falter well below 138.45-50 (1.618 times extension of 109.49-124.10 measuring from 114.85), risk from there has increased for a much-needed correction to take place later.
On the downside, whilst pullback to 133.50-60 cannot be ruled out, reckon the upper Kumo (now at 133.08) would limit downside and bring another rise later. Below support at 131.99 would defer and prolong choppy trading, risk weakness to 131.72 support, break there would suggest the rebound from 131.17 has ended and bring another fall towards this level but previous support at 131.40 should hold. Looking ahead, a daily close below 131.40 would signal top has been formed at 134.50, bring correction of recent upmove to the lower Kumo (now at 131.03), break there would provide confirmation, then subsequent fall to 130.40-50 would follow.
Recommendation: Short entered at 133.70 met target at 131.70 with 200 points profit and would turn long at 133.00 for 135.00 with stop below 132.00.
On the weekly chart, despite early anticipated retreat to 131.17, as renewed buying interest emerged and the single currency has staged a strong rebound, suggesting pullback from 134.50 has possibly ended there and retest of this level is likely, however, break there is needed to revive bullishness and confirm recent upmove from 109.49 (2016 low) has resumed and extend gain to 135.00, then 136.00-10 but reckon upside would be limited and 136.95-00 should hold, price should fatter below 138.45-50 (1.618 times extension of 109.49-124.10 measuring from 114.85), bring retreat later.
On the downside, expect pullback to be limited to 133.00 and bring such a rise. below 131.72 support would prolong consolidation, risk test of said support at 131.17 but only a weekly close below there would suggest a temporary top has been formed, bring retracement of recent rise to support at 131.40, break there would add credence to this view and extend further fall to 130.90-00, then 130.20-25 but reckon downside would be limited to 129.37 support and previous support at 127.56 should remain intact.
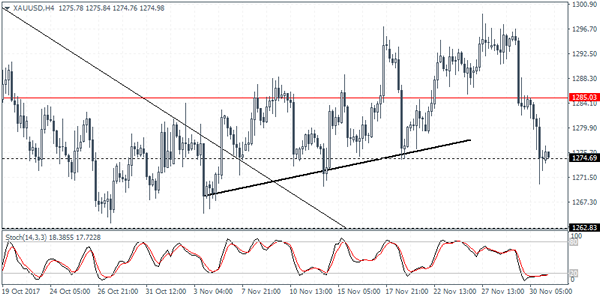
XAUUSD Intraday Analysis
XAUUSD (1274.98): Gold prices failed near to hold near the support level of 1285. As a result, price action fell sharply back to the previous support level near 1274.70 region. We expect that this support level will hold in the near term. The upside is limited as gold prices could be seen rallying back to 1285 to establish resistance near this level. To the downside, there is risk of a decline below 1274.70. In this case, gold prices could be pushing lower to test the 1262 level of support.
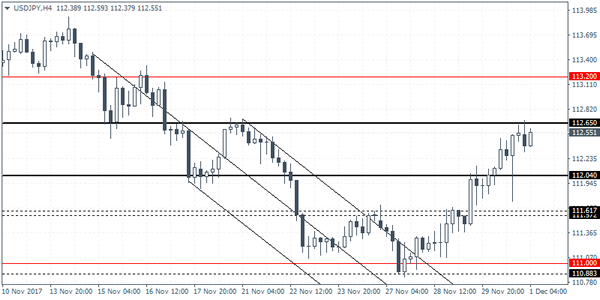
USDJPY Intraday Analysis
USDJPY (112.55): The USDJPY managed to keep its gains for the third consecutive day. The reversal just above 110.70 level of support could see price action currently testing the previous resistance level near 112.65. In the short term, USDJPY could remain range bound within 112.65 and 112.04 levels. A breakout above 112.65 will be bullish as the currency pair could be seen rallying to the 113.20 level where the next resistance could be tested. To the downside, USDJPY could be at risk of a decline back to 111.61 level. Further declines are likely to be limited for the moment.
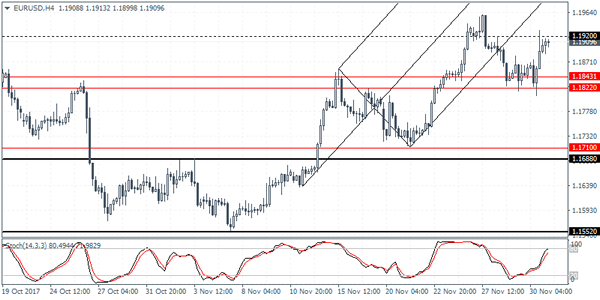
EURUSD Intraday Analysis
EURUSD (1.1909): The EURUSD was volatile yesterday as price action initially slipped to a 6-day low before recovering. The declines came as the flash inflation estimates came out lower than forecasts for the Eurozone. The EURUSD formed an inside bar on the daily session which could now see a potential breakout from the ranging price action. On the 4-hour chart, price action briefly tested the resistance level at 1.1920 as expected. We expect to see the euro maintaining a sideways range within 1.1920 resistance and 1.1822 support region in the short term. A breakout from this range will potentially establish further direction in the currency pair. The risk is however to the downside as the common currency could fall towards the lower support at 1.1710 on a downside breakout.
Tax Reforms Optimism Sends The Markets Higher
The optimism in the markets that President Trump's tax reforms will be passed saw the markets trading higher. The U.S. dollar was trading mixed but the greenback managed to post gains against the weaker currencies such as the yen and the kiwi dollar.
OPEC managed to seal the deal as the oil producing nations agreed to extend the production cuts through the end of 2018. This sent oil prices higher with Nymex crude oil futures rising 0.2% while Brent oil futures rose 0.7% on the day.
In the Eurozone, the common currency fell as the flash inflation estimates showed that core inflation remained weak at 0.9%. This was despite the headline inflation coming out higher. However, the common currency quickly pared losses on hopes of positive coalition talks between the SPD and the CSU.
Looking ahead, the economic data today will see the monthly ISM manufacturing PMI data. Estimates show that manufacturing activity fell to 58.4 from 58.7 previously. Canadian monthly GDP report and unemployment data is expected as well.
Technical Outlook: USDJPY – Bulls Need Consolidation Before Attacking Key 112.70/90 Resistance Zone Again
Strong three-day recovery is taking a breather after rally was capped by falling 20SMA at 112.68 which formed bear-cross with 55SMA.
Consolidation so far found footstep at 112.32 (broken Fibo 38.2% of 114.73/110.83 descend) but overbought slow stoch and 20/55 bear-cross weigh and signal deeper pullback.
Next solid support lies at 112.00, with extended dips required to reverse above 111.80/75 (daily Tenkan-sen / 10SMA) to keep alive hopes of fresh upside attempts for test of strong resistance zone between 112.70 and 112.90 (20/55SMA’s / daily Kijun-sen and cloud top).
Sustained break here is needed to confirm bullish continuation.
Conversely, close below 112.75 would signal lower top at 112.68 and turn near-term risk lower.
Res: 112.68, 112.78, 112.90, 113.24
Sup: 112.32, 112.00, 111.75, 111.68
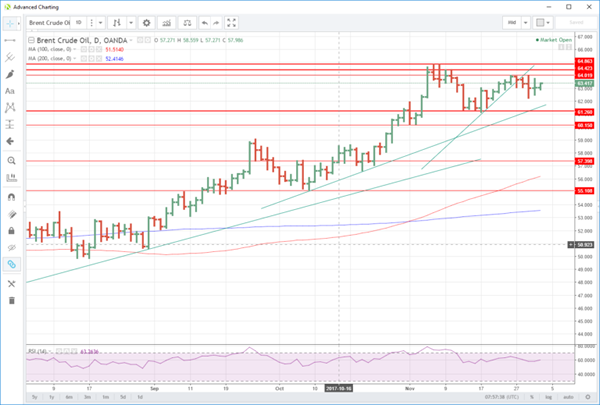
OPEC’s Rubber Stamp Leaves Oil Lukewarm
OPEC's summit passes without incident as the production cut extension was rubber-stamped and Libya and Nigeria are brought into the fold.
The oil market breathed a sigh of relief as the OPEC/Non-OPEC meeting passed without incident with the grouping doing precisely what the street had priced in, extending the production cut agreement nine months to cover all of 2018. The additional positive news was that Libya and Nigeria were both bought into the fold, but markets barely reacted with Brent and WTI both closing the session unchanged from the day before.
With prices flatlining on a closing basis and neither contract able to even remotely test their November highs, attention may well turn to positioning fatigue. The danger is that traders will look to square up long positioning into the weekend, setting in motion a corrective sell-off.
Brent
Brent crude opened at 63.15 and had climbed 40 cents to 57.55 in early Europe having failed ahead of 64.00 overnight. It now has several layers of daily double tops at 64.00 initially, followed by 64.45 and 64.85. It must chew through all of these levels to reignite the rally. Supports lies at 62.00 followed by the two-month trendline at 61.60 and then 61.25 multiple daily lows.
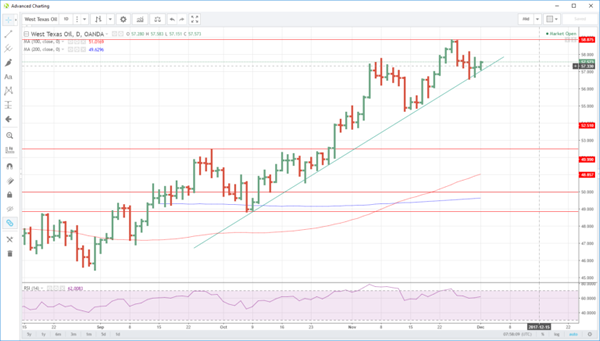
WTI
WTI was comatose at 57.35 in Asia before climbing 40 cents to 57.70 in Europe. It has resistance at 58.15 and then the two-year high and daily double top at 58.85. The downside looks more worrying, its two-month trendline support very near to current levels, at 57.00 this morning. A break sets up a drop to 56.00 and then 55.00.
All in all, with momentum waning on both contracts, and a read between the lines suggesting both Saudi Arabia and Russia feel Brent is approaching is pricing sweet spot at these levels; the danger could be a move lower from here into next week.
Technical Outlook: EURUSD – Continuation Of Thursday’s Rally Eyes Targets At 1.1965/1.2000
The Euro holds firm tone on Friday and probes above the high of Thursday's strong rally at 1.1932, with the downside being contained by broken Fibo 61.8% point at 1.1886. Scope is seen for push through 1.1965 barrier (Fibo 76.4% of 1.2092/1.1553 descend) for the final stretch towards psychological 1.2000 barrier. Strong performance in November left long bullish monthly candle (after two previous months in red) supporting scenario for full retracement of 1.2092/1.1553 pullback. Larger bulls remain intact after correction from 1.2092 left higher base at 1.1820 zone. Rising 10SMA continues to track advance and offers support at 1.1850 which is expected to limit downticks.
Res: 1.1965, 1.2000, 1.2033, 1.2092
Sup: 1.1886, 1.1850, 1.1820, 1.1808