Sample Category Title
Technical Outlook: GBPUSD – Bullish Sentiment Keeps 1.3655 Target In Focus, Correction To Precede Fresh Rally
Cable is consolidating on Friday after steep two-day rally, driven by positive hopes over Brexit talks and strong month-end demand, peaked at 1.3548 on Thursday.
Consolidation is narrow for now and holds above 1.3500 handle, however, steep bullish acceleration requires correction. Overbought daily studies support the notion, with buying on correction being favored.
Below 1.3500, broken Fibo 61.8% of 1.3655/1.3026 descend, marks solid support, with extended dips to be contained above rising 10SMA (1.3351) to keep bullish structure intact.
Final push towards key barrier at 1.3655 (20Sep post-Brexit recovery high) is expected after completion of current consolidative / corrective phase.
Res: 1.3548, 1.3570, 1.3600, 1.3655
Sup: 1.3500, 1.3487, 1.3415, 1.3379
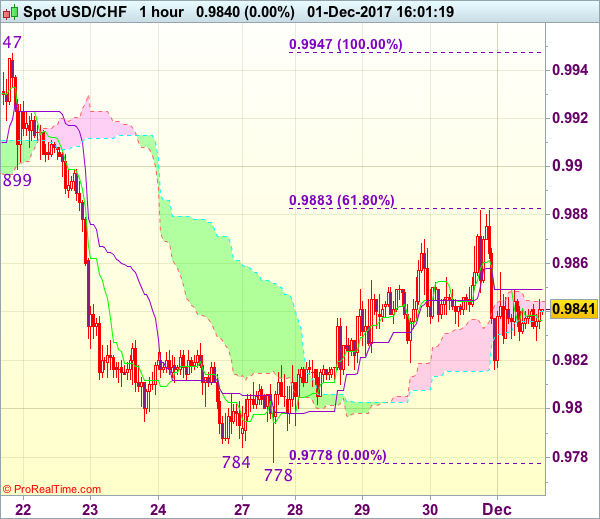
Trade Idea : USD/CHF – Hold short entered at 0.9860
USD/CHF - 0.9825
Most recent candlesticks pattern : N/A
Trend : Near term down
Tenkan-Sen level : 0.9833
Kijun-Sen level : 0.9849
Ichimoku cloud top : 0.9844
Ichimoku cloud bottom : 0.9840
Original strategy :
Sold at 0.9860, Target: 0.9760, Stop: 0.9890
Position : - Short at 0.9860
Target : - 0.9760
Stop : - 0.9890
New strategy :
Hold short entered at 0.9860, Target: 0.9760, Stop: 0.9885
Position : - Short at 0.9860
Target : - 0.9760
Stop : - 0.9885
Dollar ran into renewed selling interest at 0.9882 and has retreated, suggesting top is possibly formed there and consolidation with downside bias is seen for weakness to 0.9800, however, break of this week’s low at 0.9778 is needed to confirm recent decline from 1.0038 top has resumed and extend weakness towards 0.9730-37 support area but reckon support at 0.9705 would hold from here.
In view of this, we are holding on to our short position entered at 0.9860. Only break of 0.9895-00 would defer and signal a temporary low is formed instead, bring a stronger rebound to 0.9920 but price should falter well below resistance at 0.9947.
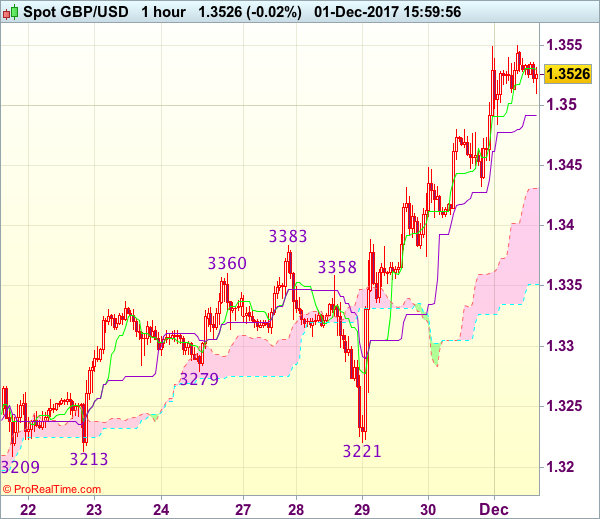
Trade Idea : GBP/USD – Buy at 1.3440
GBP/USD - 1.3527
Most recent candlesticks pattern : N/A
Trend : Near term up
Tenkan-Sen level : 1.3530
Kijun-Sen level : 1.3491
Ichimoku cloud top : 1.3432
Ichimoku cloud bottom : 1.3351
Original strategy :
Buy at 1.3385, Target: 1.3485, Stop: 1.3350
Position : -
Target : -
Stop : -
New strategy :
Buy at 1.3440, Target: 1.3560, Stop: 1.3405
Position : -
Target : -
Stop : -
As cable has continued trading with a firm undertone after rising to 1.3549 yesterday, adding credence to our bullish view that the erratic rise from 1.3027 low is still in progress, hence upside bias remains for this move to extend further gain to 1.3570-75, however, overbought condition should prevent sharp move beyond 1.3600-10 and price should falter below 1.3640-50, bring retreat later.
In view of this, would not chase this rise here and would be prudent to buy sterling on subsequent pullback as the upper Kumo (now at 1.3432) would limit downside and bring another rise. Below 1.3400-10 would defer and suggest top is possibly formed, risk correction to support at 1.3374 but the lower Kumo (now at 1.3351) should remain intact.
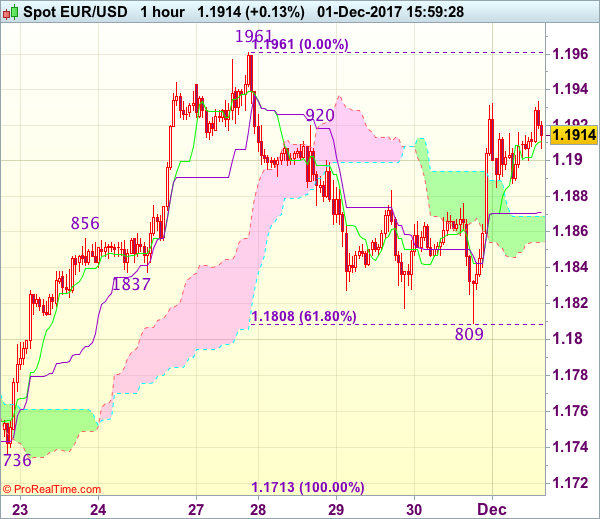
Trade Idea : EUR/USD – Hold long entered at 1.1865
EUR/USD - 1.1929
Most recent candlesticks pattern : N/A
Trend : Near term up
Tenkan-Sen level : 1.1916
Kijun-Sen level : 1.1873
Ichimoku cloud top : 1.1869
Ichimoku cloud bottom : 1.1855
Original strategy :
Bought at 1.1865, Target: 1.1965, Stop: 1.1835
Position : - Long at 1.1865
Target : - 1.1965
Stop : - 1.1835
New strategy :
Hold long entered at 1.1865, Target: 1.1965, Stop: 1.1855
Position : - Long at 1.1865
Target : - 1.1965
Stop : - 1.1855
As the single currency found decent demand at 1.1809 yesterday and has staged a strong rebound, price broke above previous resistance at 1.1920, adding credence to our view that the pullback from 1.1961 has ended there, hence bullishness remains for a retest of this level, however, break there is needed to confirm recent upmove has resumed for headway to 1.1990-00 which is likely to hold from here.
In view of this, we are holding on to our long position entered at 1.1865. Below 1.1880 would defer and risk 1.1855-60 but break there is needed to abort and prolong consolidation and risk weakness to 1.1835-40, having said that, said support at 1.1809 should remain intact, bring rebound later.
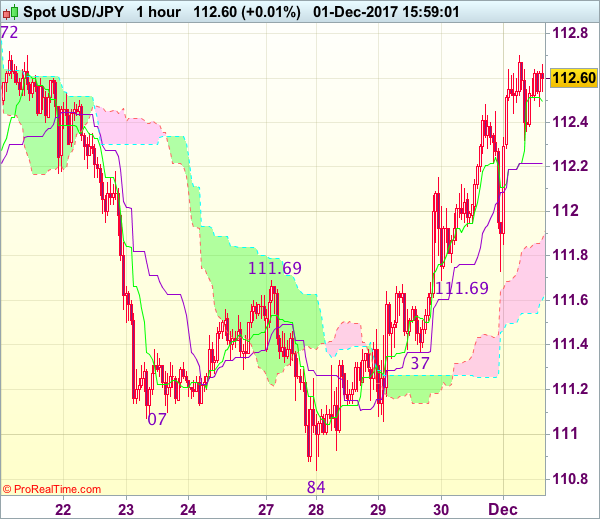
Trade Idea : USD/JPY – Buy at 112.00
USD/JPY - 112.57
Most recent candlesticks pattern : N/A
Trend : Near term up
Tenkan-Sen level : 112.49
Kijun-Sen level : 112.22
Ichimoku cloud top : 111.92
Ichimoku cloud bottom : 111.64
Original strategy :
Buy at 111.70, Target: 112.70, Stop: 111.35
Position : -
Target : -
Stop : -
New strategy :
Buy at 112.00, Target: 113.00, Stop: 111.65
Position : -
Target : -
Stop : -
As the greenback has surged again after holding above indicated support at 111.69 (just missed our long entry at 111.70) and bullishness remains for the rise from 110.84 low to extend gain to 112.72 resistance, break there would bring subsequent rise to previous support at 113.09, however, near term overbought condition should limit upside and resistance at 113.33 should hold from here.
In view of this, we are still looking to buy dollar on pullback as 112.00 should limit downside. Only break of said support at 111.69 would abort and signal top is formed, bring weakness to 111.50, then test of support at 111.37.
USDCAD Neutral In 1-Month Range, Long-Term Bearish Trend Remains Intact
USDCAD is neutral for now after a correction of the long-term downtrend stalled ahead of the key 1.3000 level. The market is trading in a range and capped below the 200-day moving average.
USDCAD has climbed to the upper end of the one-month range and has found strong resistance at the 50% Fibonacci retracement (1.2922) of the downleg from 1.3793 to 1.2061. There is good support around 1.2674 – near the 38.2% Fibonacci.
A move above the key psychological level of 1.3000 is needed to ease downside pressure and to open the way towards 1.3500 and then to re-test the 1.3793 peak.
The market needs a catalyst to push above the current range but momentum is weak at the moment and the bias is expected to remain neutral in the near-term. The underlying trend is still down as long as the market remains below its 200-day MA, which is keeping the overall bearish outlook.
OPEC+ Yesterday Agreed To Extend Output Cuts
Market movers today
Today is the big PMI manufacturing day. We have the preliminary November prints for euro area and the US already, but today will get the final prints. More exciting perhaps are the same indices for Italy, Sweden, the UK, Norway and Sweden.
In the US, we will also get the ISM manufacturing index for November, which we estimate fell to 58.0 from 58.7 in line with some of the regional PMIs and the fall in the US Markit PMI manufacturing index. We are still puzzled about the big gap between the Markit and ISM indices, as they are expected to show the same thing (more or less).
As the US Senate did not vote for the tax bill overnight, a vote could take place later today.
In Norway, the unemployment rate for November is due out today. We estimate an unchanged print of 2.4%.
Selected market news
In China, the Caixin manufacturing PMI dropped to 50.8 in November down from 51.0 in October and thus signals a slight slowdown in Chinese economic activity. The reading, however, differs from the official manufacturing PMI released yesterday, which showed a small increase from October to November. The copper price dropped slightly on the release.
OPEC+ yesterday agreed to extend output cuts by 9M to the end of 2018, and Libya and Nigeria agreed to freeze output at the 2017 high. This was about as expected by the market, but the announcement of a review of the deal in June next year left the market disappointed, causing oil prices to sell off. The market is concerned that OPEC+ has created a back door for exiting production cuts when the deal is set to be reviewed.
In the US, the next Senate vote on the tax bill has been postponed until later today. In addition, the Trump administration is also getting attention over a suggestion that Secretary of State Rex Tillerson could be replaced by Mike Pompeo. These factors are likely to have weighed somewhat on the USD yesterday.
Forex: OPEC Extends Output Cuts
On Thursday, OPEC (Organization of Petroleum Exporters) and non-OPEC producers led by Russia agreed to keep output cuts until the end of 2018. However, they also agreed to a possible early end of the agreement if the market overheats. The markets had already 'priced-in' the extension of the agreement past its previous March 2018 end. The agreement is to cut 1.8 million barrels a day from the market to reduce supply and therefore keep prices relatively strong. Saudi Arabia’s oil minister Khalid al-Falih stated 'it was premature to talk about exiting the cuts at least for a couple of quarters as the world was entering a season of low winter demand' adding 'OPEC would examine progress at its next regular meeting in June'. Oil has now extended its longest streak of monthly gains since early 2016.
In the US, the chances of passage of a Senate tax bill improved with the endorsement of Senator John McCain. McCain backed the tax bill commenting that whilst it was 'far from perfect' it would boost the economy and help all Americans. The Republicans have 52 votes in the 100-member Senate, enough to secure the bill passes if they stick together. With Democrats not backing the bill, the Republicans can’t lose more than 2 of their own votes. The Senate will convene at 15:00 GMT on Friday to continue the debate on taxes. Although Republicans are optimistic, party leaders still do not have firm commitments from enough senators to ensure the bill will pass. The main focus has been how to offset the deficit the bill would create with many Senators, including Republicans, expressing concerns about how to tackle the increased debt. An analysis suggests the Senate bill would increase federal deficits by $1 trillion over a decade.
Reports coming out of Germany are suggesting that Chancellor Merkel’s conservative party held talks late on Thursday with the Social Democratic Party (SPD). The hope is that the talks could lead to the formation of a coalition government in a bid to end the country’s current political impasse. Details of the talks were yet to be revealed as of early Friday.
EURUSD is 0.1% higher overnight, currently trading around 1.1912.
USDJPY is little changed in early Friday trading at around 112.55.
GBPUSD is unchanged overnight, currently trading around 1.3527.
Gold is currently trading around $1,275.
WTI is 0.5% higher in early session trading at around $57.57.
Major data releases for today:
At 13:30 GMT: Statistics Canada will release the Unemployment Rate and Net Change in Employment for November. The Unemployment rate is forecast to have improved to 6.2% from 6.3%, with the net change in employment forecast at 10K from the previous release of 35.3K. Any significant deviation from the forecast will see CAD volatility.
At 14:05 GMT: Federal Reserve Bank of St. Louis President James Bullard is scheduled to speak.
At 14:30 GMT: FOMC Member Robert Kaplan is scheduled to speak.
At 15:00 GMT: The US Institute for Supply Management (ISM) will release Manufacturing PMI and Prices Paid for November. PMI is forecast to have slipped to 58.5 from 58.7, with Prices paid expected to be unchanged at 68.5. Any significant deviation from the forecast will likely result in USD volatility.
At 15:15 GMT: FOMC Member Patrick Harker is scheduled to speak.
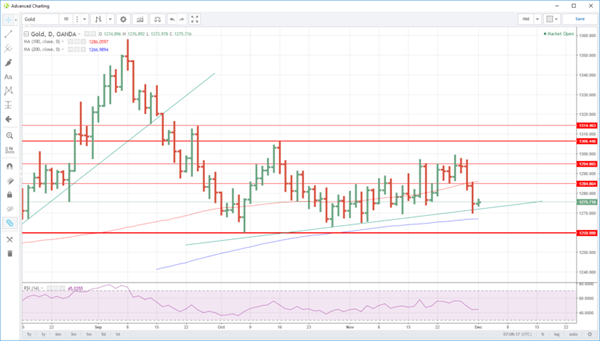
Gold Commences An Emergency Descent
Gold's hard earnt rally ends with a high altitude decompression in prices with the emergency two-day descent unwinding a month of slow gains.
What took four weeks to build has taken two days to take away. Gold plunging again overnight for the 2nd day in a row, falling nine dollars to close at 1275.00. Gold has now given up almost all of its hard-won gains of November in the space of 48 hours.
Excellent U.S. consumption and preliminary GDP data saw the U.S. 10-year bond yield rise to 2.435% overnight, while the passage of the U.S. tax bill making progress through the Senate saw shares spike again. All of this torpedoed gold below the waterline as traders headed to the exit door for better returns elsewhere.
As the dust settles, gold is still stuck in its two-month trading range but is now much nearer to its lower boundary then its higher one. What is far more concerning is the price action in gold. It has been a slow climb up the stairs over the past month, followed by a leap out of the top floor window for prices to crash.
It should be of concern to longer-term bulls and underlines the fragile nature of golds pricing at the moment in the absence of any geopolitical safe-haven factors. With monetary conditions set to tighten next year in many parts of the world, gold may find fewer friends as we head into the last month of the year.
Gold has eked out a small $1.50 gain to 1276.50 in Asia trading this morning. Having closed below its 200-day moving average at 1286.00 on Wednesday, gold tried and failed to test it yesterday before crashing. This is the crucial pivot point that must be regained for bullish traders breath a little easier.
Below, gold has six-week trendline support nearby at 1272.00 followed by the 200-day moving average at 1267.00. The critical long-term support remains at 1260.00, with a daily close under there perhaps signalling a renewed rush for the exit door by longer-term positioning.
Daily Wave Analysis: USD Testing Critical S&R Levels Versus EUR, GBP And JPY
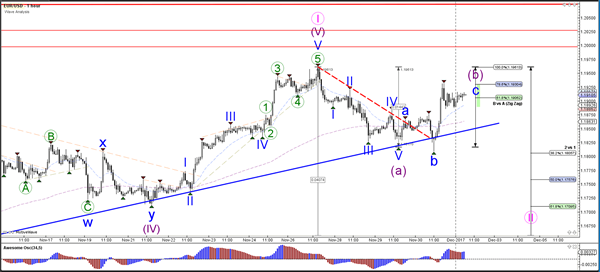
Currency pair EUR/USD
The EUR/USD could be in a wave B (purple) bearish retracement but the bullish price action looks strong. A push higher could occur based on yesterday’s bullish bounce but a break above the 100% Fibonacci level invalidates the wave B zigzag pattern.
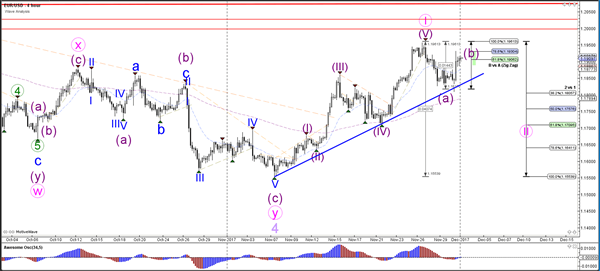
The EUR/USD break below support (blue) could see price fall towards the Fibonacci levels of wave 2 (pink). A break above the 100% Fib could indicate an extension of wave 1 (pink), although new resistance levels are nearby (red lines).
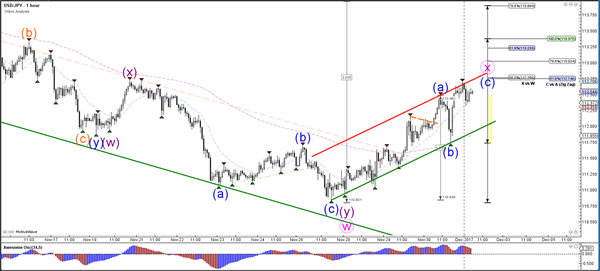
Currency pair USD/JPY
The USD/JPY bullish channel could indicate the completion of wave 2 or wave B (purple) at the 50% Fibonacci level. The key level is the 50% Fib of wave X (pink) because a bearish bounce could see price fall towards the 61.8% at 110. Strong bullish momentum makes a wave X (pink) unlikely.
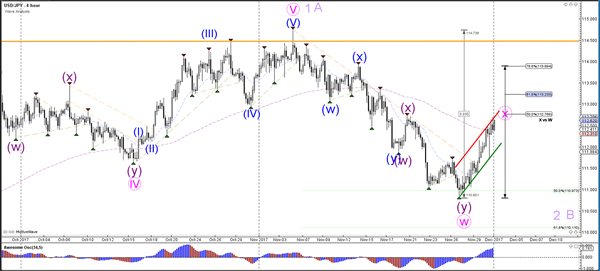
The USD/JPY is either in a wave C (blue) or wave 3. A wave C is more likely if price stops at the 50% Fib of wave X vs W.
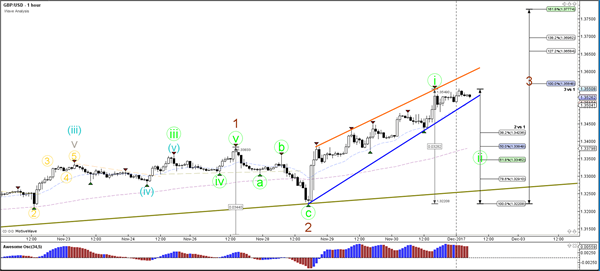
Currency pair GBP/USD
The GBP/USD made another bullish breakout above a resistance trend line (orange) yesterday. Price could be in a wave 1-2 (green) unless price manages to show a continued bullish breakout and reach the 161% Fibonacci level of wave 3 (brown).
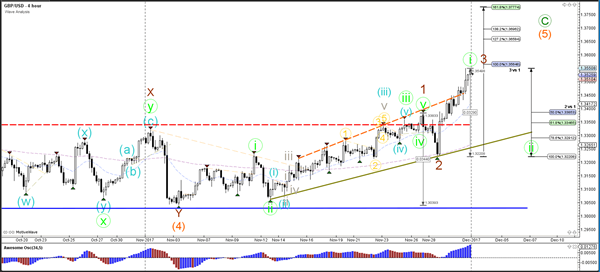
The GBP/USD is in a bullish trend channel and could be building a wave 1 (green) within wave 3 (brown). Currently price seems to be building a slight rising wedge which could cause a bearish retracement.