Sample Category Title
GBP/JPY Daily Outlook
Daily Pivots: (S1) 150.64; (P) 151.52; (R1) 153.09; More...
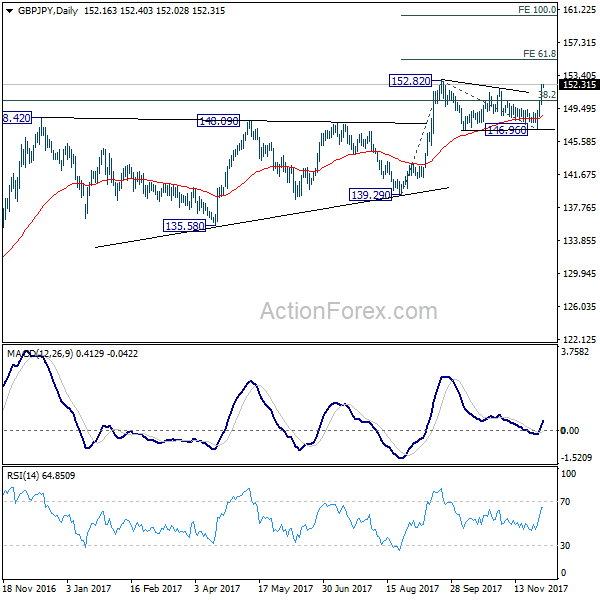
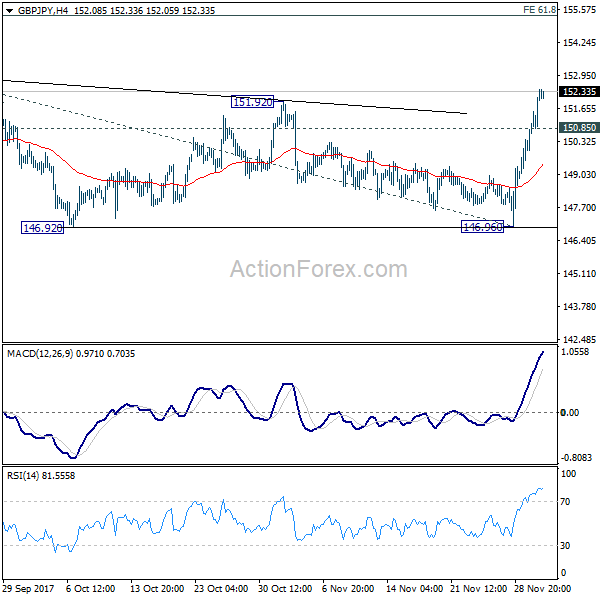
GBP/JPY's rally continues and the break of 151.92 resistance should confirm that medium term rally is resuming. Intraday bias stays on the upside for 152.82 high first. Next target will be 61.8% projection of 139.29 to 152.82 from 146.96 at 155.32. On the downside, below 150.85 minor support will delay the bullish case and bring some pull back first.
In the bigger picture, medium term rebound from 122.36 is still expected to resume after corrective pull back from 152.82 completes. Firm break of 38.2% retracement of 196.85 to 122.36 at 150.43 will carry long term bullish implications. In that case, GBP/JPY could target 61.8% retracement at 167.78. However, break of 139.29 will indicate rejection from 150.43 key fibonacci level. And the three wave corrective structure of rebound from 122.36 will argue that larger down trend is resuming for a new low below 122.26.
EUR/JPY Daily Outlook
Daily Pivots: (S1) 132.91; (P) 133.52; (R1) 134.56; More....
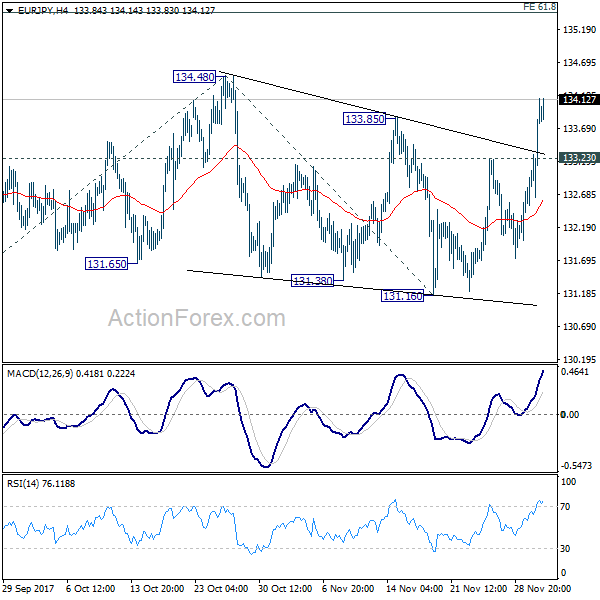
The break of 133.85 resistance argue that correction from 134.48 could be completed at 131.16 already. Intraday bias is on the upside for 134.48 first. Decisive break there will confirm up trend resumption. Next target will be 61.8% projection of 127.55 to 134.48 from 131.16 at 135.44 and then 100% projection at 138.09. On the downside, below 133.23 minor support will dampen the bullish case and turn bias neutral first.
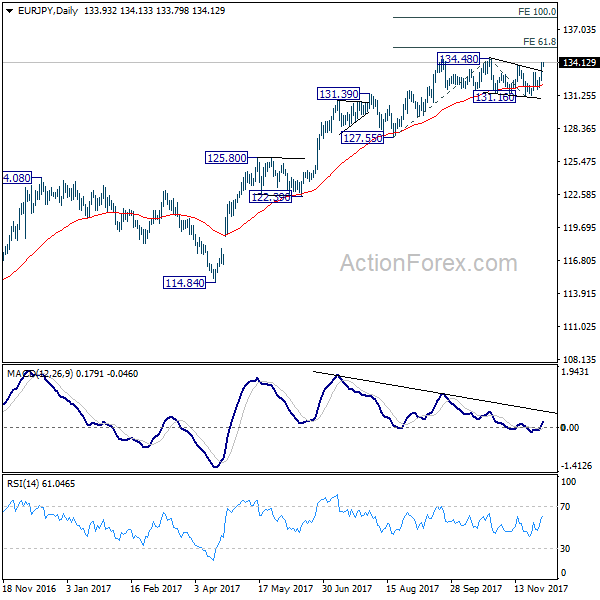
In the bigger picture, medium term rise from 109.03 (2016 low) is seen as at the same degree as the down trend from 149.76 (2014 high) to 109.03 (2016 low). 61.8% retracement of 149.76 to 109.03 at 134.20 is already met. Sustained break there will pave the way to key long term resistance zone at 141.04/149.76. However, break of 127.55 support will argue that the medium term trend has reversed and will turn outlook bearish for deeper fall back to 114.84/124.08 support zone at least.
EUR/GBP Daily Outlook
Daily Pivots: (S1) 0.8809; (P) 0.8842; (R1) 0.8867; More...
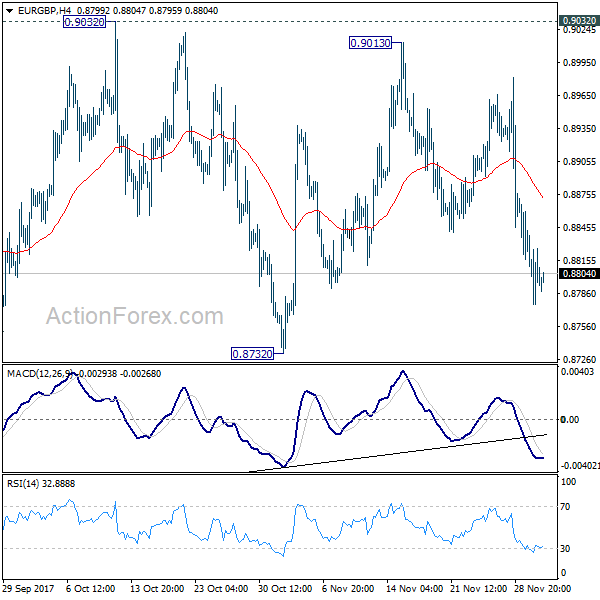
At this point, EUR/GBP is still bounded in range of 0.8732/9032 and intraday bias remains neutral. With 0.9032 resistance intact, deeper decline is mildly in favor in the cross. Break of 0.8732 will resume the fall from 0.9305 and target 0.8303 key support level. However, on the upside, decisive break of 0.9032 will confirm completion of the decline from 0.9305. In such case, intraday bias will be turned back to the upside for retesting 0.9305 key resistance.
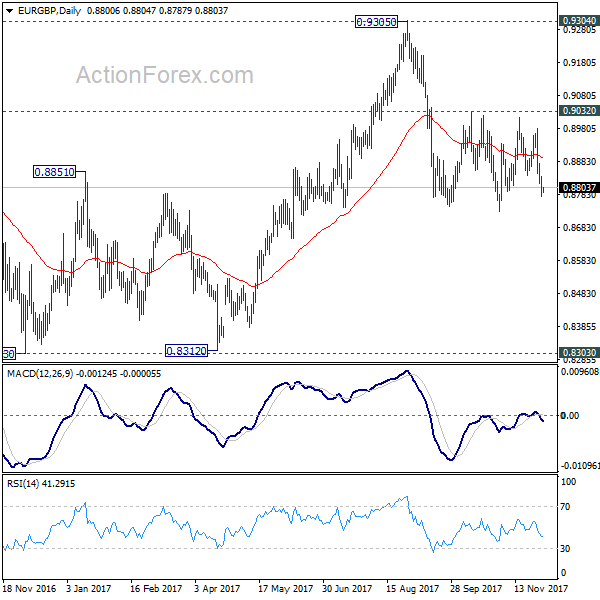
In the bigger picture, there are various ways to interpret price actions from 0.9304 high. But after all, firm break of 0.9304/5 is needed to confirm up trend resumption. Otherwise, range trading will continue with risk of deeper fall. And in that case, EUR/GBP could have a retest on 0.8303. But we'd expect strong support from 0.8116 cluster support (50% retracement of 0.6935 to 0.9304 at 0.8120) to contain downside.
EUR/AUD Daily Outlook
Daily Pivots: (S1) 1.5647; (P) 1.5698; (R1) 1.5783; More....
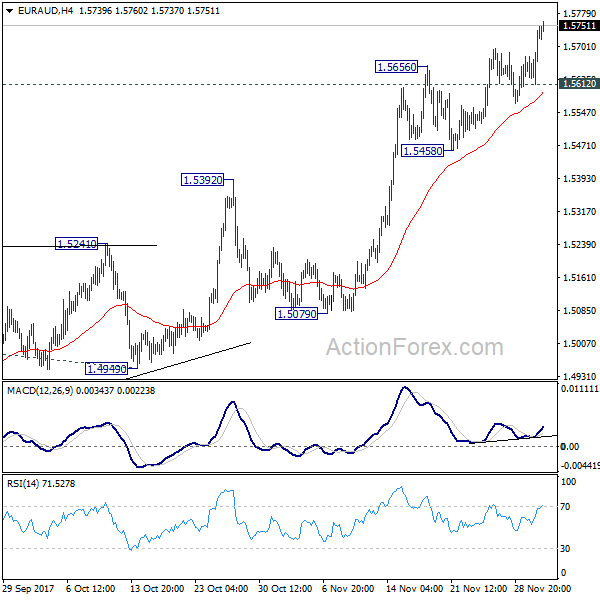
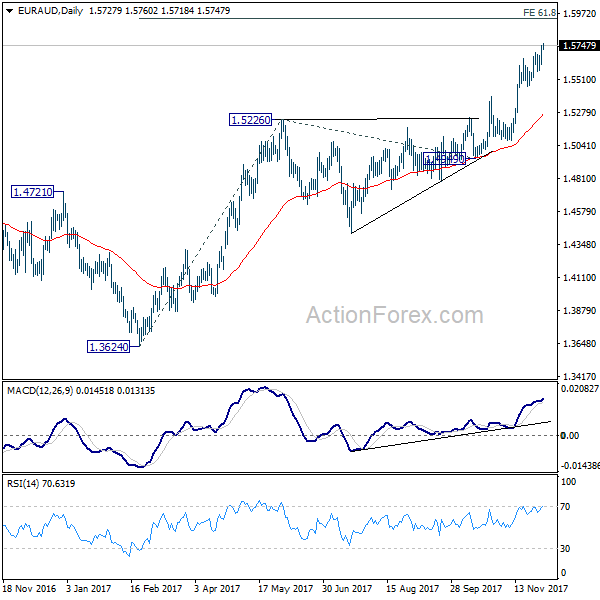
EUR/AUD's rally extends to as high as 1.5760 so far. Intraday bias remains on the upside for 61.8% projection of 1.3624 to 1.5226 from 1.4949 at 1.5939 first. Break will target 100% projection at 1.6551, which is close to 1.6587 key resistance. On the downside, below 1.5612 will turn intraday bias neutral and bring consolidations. But outlook will stay bullish as long as 1.5458 support holds.
In the bigger picture, we're holding on to the view that corrective decline from 1.6587 medium term top (2015 high) has completed at 1.3624. Rise from 1.3624 is expected to extend to retest 1.6587. We'll hold on to this bullish view as long as 1.5226 resistance turned support holds. Firm break of 1.6587 will resume long term rise from 1.1602 (2012 low).
EUR/CHF Daily Outlook
Daily Pivots: (S1) 1.1665; (P) 1.1690; (R1) 1.1731; More...
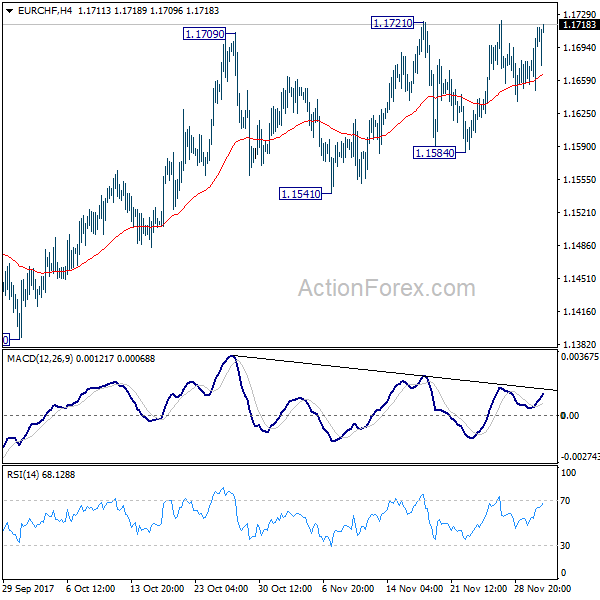
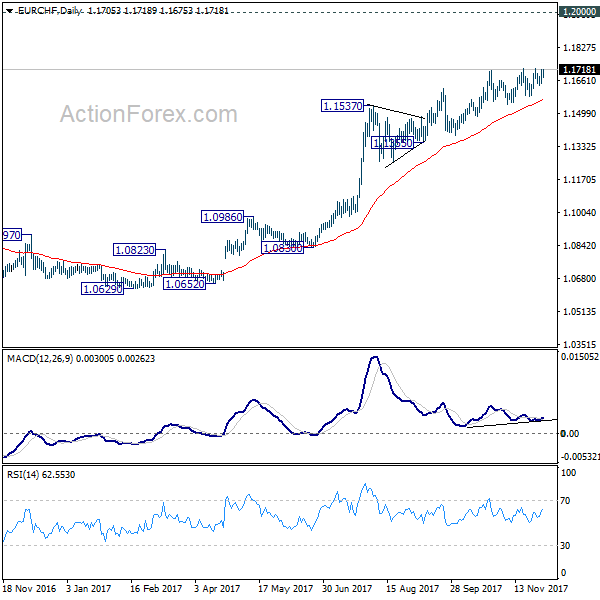
EUR/CHF is still limited below 1.1721 resistance and intraday bias stays neutral. Again, with 1.1584 support intact, outlook remains bullish. Current medium term rise from 1.0629 would extend to 1.2 key level. However, considering bearish divergence condition in 4 hour MACD, firm break of 1.1584 will now indicate near term reversal and should bring pull back to 1.1355 support or below.
In the bigger picture, long term rise from SNB spike low back in 2015 is still in progress. EUR/CHF should now be heading back to prior SNB imposed floor at 1.2000. For now, this will be the favored case as long as 1.1355 support holds. However, break of 1.1355 will indicate medium term topping. In that case, EUR/CHF should head back to 55 week EMA (now at 1.1142) and possibly below.
Daily Technical Analysis: EURUSD, GBPUSD, USDJPY, USDCHF
EURUSD
The EURUSD attempted to push lower yesterday bottomed at 1.1808 but whipsawed to the upside and closed higher at 1.1903 after bounced-off the lower line of the bullish channel as you can see on my H1 chart below. The bias is bullish in nearest term testing 1.1960 – 1.2000 region. Immediate support is seen around 1.1860. A clear break below that area could lead price to neutral zone in nearest term but only a clear break below 1.1800 could stop the current bullish phase testing 1.1690 or lower. Overall I remain neutral.
GBPUSD
The GBPUSD continued its bullish momentum yesterday topped at 1.3548. The bias remains bullish in nearest term testing 1.3615 resistance area. Immediate support is seen around 1.3480. A clear break below that area could lead price to neutral zone in nearest term testing 1.3430 area but overall I remain bullish and any downside pullback should be seen as a good opportunity to buy. On the upside, a clear break and daily/weekly close above 1.3615 would expose 1.3800 region next week.
USDJPY
The USDJPY continued its bullish momentum yesterday topped at 112.63 and hit 112.69 earlier today in Asian session. The bias remains bullish in nearest term testing 113.20 area which is a good place to sell. Immediate support is seen around 112.20. A clear break below that area could lead price to neutral zone in nearest term testing 111.65 region. Overall I remain neutral but as long as stay below 113.20 I still prefer a bearish scenario at this phase as a part of the bearish pin bar scenario as you can see on my daily chart below.
USDCHF
The USDCHF was indecisive yesterday. Price attempted to push higher, slipped above 0.9875 resistance area but whipsawed to the downside and closed lower at 0.9835. The bias is bearish in nearest term testing 0.9780 support area. On the upside, 0.9875 region remains a key resistance and good place to sell with a tight stop loss as a clear break above that area would expose 0.9940 region. Overall I remain neutral.
EUR/USD Daily Outlook
Daily Pivots: (S1) 1.1830; (P) 1.1881 (R1) 1.1953; More....
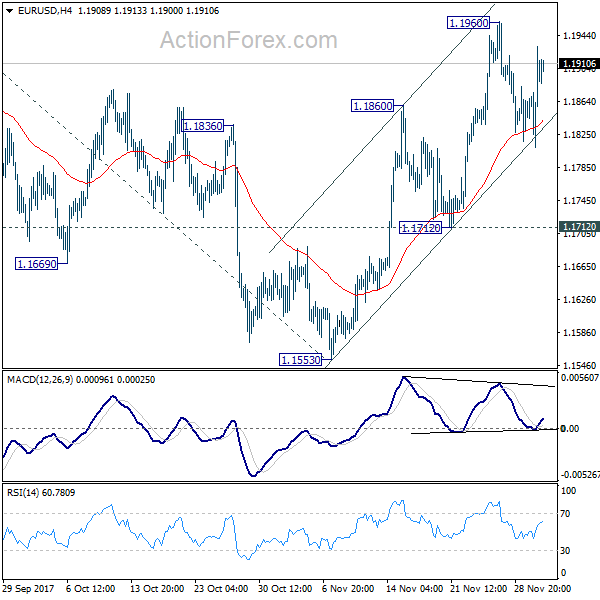
EUR/USD rebounded strongly after drawing support from 4 hour 55 EMA. But it's staying below 1.1960. Intraday bias remains neutral first. With 1.1712 support intact, rise from 1.1553 is expected to resume later. Break of 1.1960 will turn bias to the upside for retesting 1.2091 high first. Break there will resume medium term up trend from 1.0339 and target 61.8% projection of 1.0569 to 1.2091 from 1.1553 at 1.2494, which is close to 1.2516 long term fibonacci level. We'd expect strong resistance from there to bring reversal. On the downside, break of 1.1712 will indicate completion of the rise from 1.1553 and turn near term outlook bearish.
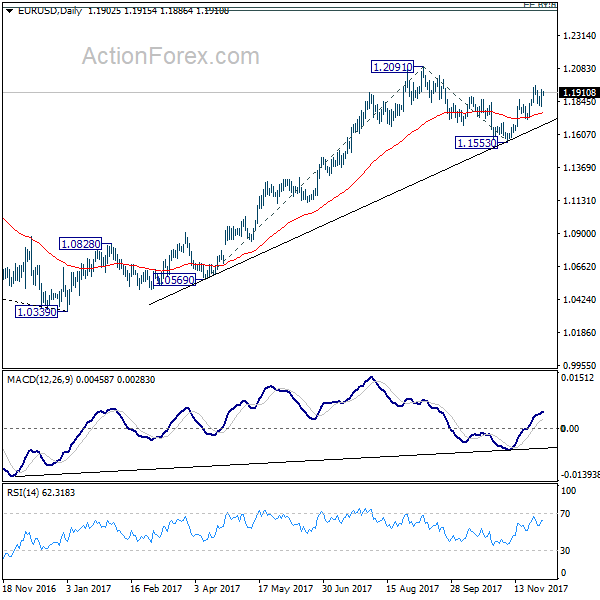
In the bigger picture, rise from 1.0339 medium term bottom is seen as a corrective move for the moment. Therefore, in case of another rally, we'd be expect 38.2% retracement of 1.6039 (2008 high) to 1.0339 (2017 low) at 1.2516 to limit upside and bring reversal. Meanwhile, sustained trading below 55 week EMA (now at 1.1393) will suggest that such medium term rebound is completed and could then bring retest of 1.0339 low.
GBP/USD Daily Outlook
Daily Pivots: (S1) 1.3438; (P) 1.3493; (R1) 1.3583; More....
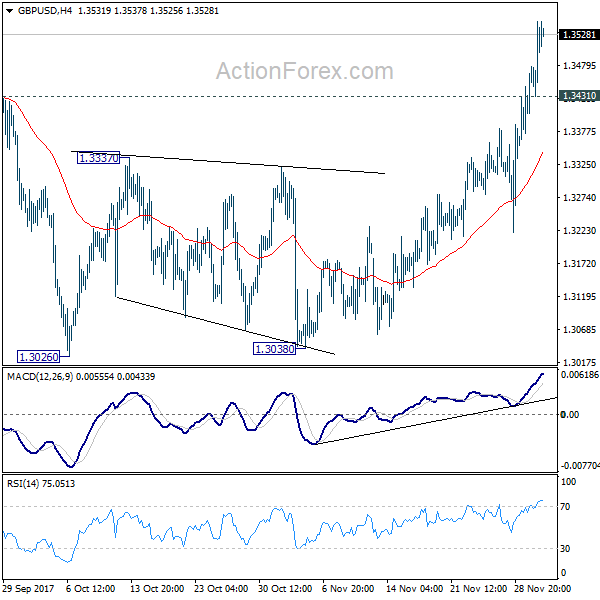
GBP/USD's rally is still in progress and intraday bias stays on the upside for 1.3651 high. Break there will resume medium term rally from 1.1946 to 1.3835 key resistance. On the downside, below 1.3382 minor support will turn bias neutral and bring retreat before staging another rally.
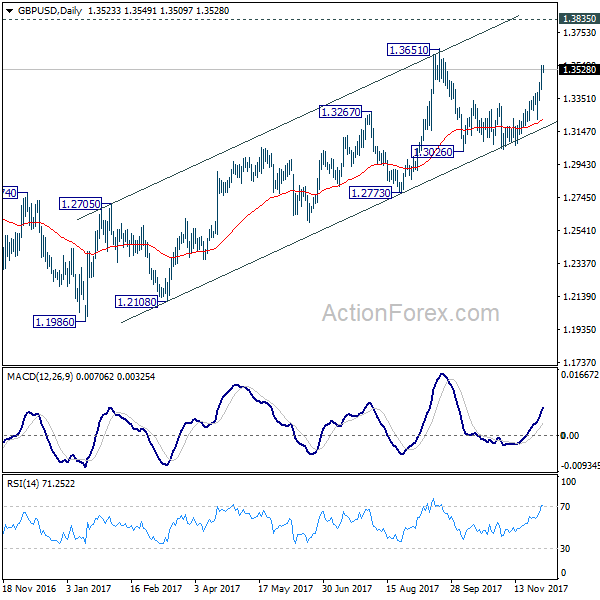
In the bigger picture, as noted before, GBP/USD hit strong resistance from the long term falling trend line. Nonetheless, subsequent fall was contained by 55 week EMA (now at 1.3069). Outlook is a bit mixed. For the moment, as long as 1.3835 support turned resistance holds, medium term rise from 1.1946 are viewed as a corrective pattern. That is, we'd expect another leg in the long term down trend through 1.1946 low. However, sustained break of 1.3835 should at least send GBP/USD to 38.2% retracement of 2.1161 (2007 high) to 1.1946 (2016 low) at 1.5466.
USD/CHF Daily Outlook
Daily Pivots: (S1) 0.9806; (P) 0.9844; (R1) 0.9872; More....
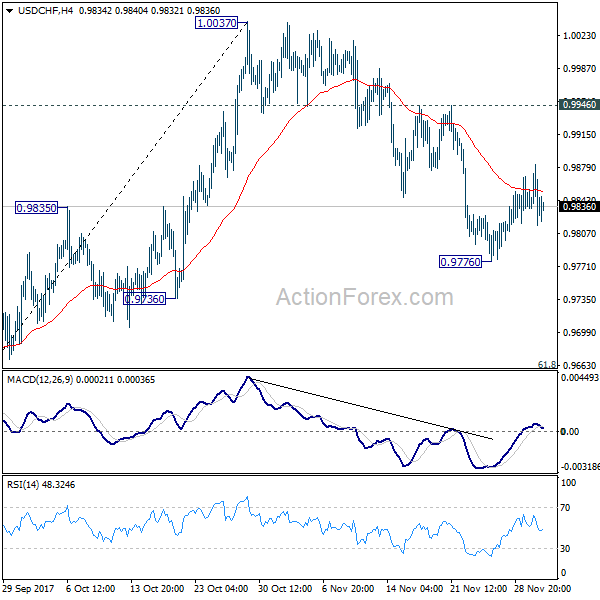
Intraday bias in USD/CHF remains neutral as recovery from 0.9776 is limited well below 0.9446 resistance. Another fall is in favor and break of 0.9776 will target 61.8% retracement of 0.9420 to 1.0037 at 0.9656. We'll look for bottoming again below 0.9656 and above 0.9420. On the upside, break of 0.9946 resistance will indicate that the decline from 1.0037 has completed and bring retest of this resistance.
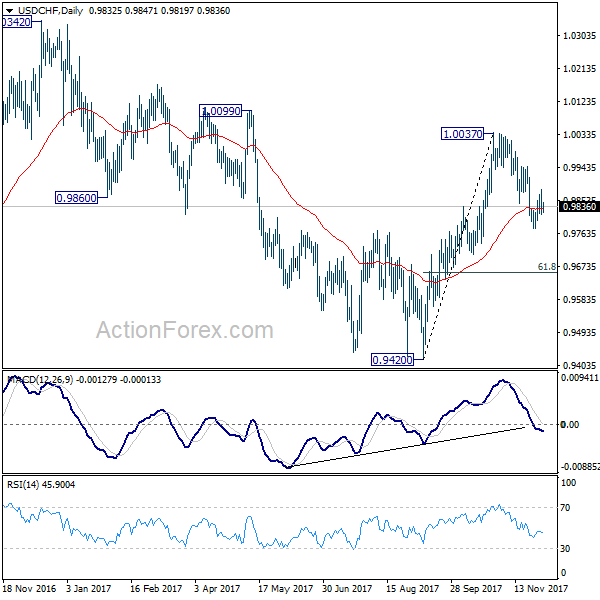
In the bigger picture, range trading continues between 0.9420/1.0342. At this point, 0.9420 appears to be a strong support level. Therefore, in case of decline attempt, we don't expect a firm break of this level. Nonetheless, strong break of 1.0342 is also needed to confirm upside momentum. Otherwise, medium term outlook will stay neutral.
USD/JPY Daily Outlook
Daily Pivots: (S1) 111.96; (P) 112.30; (R1) 112.86; More...
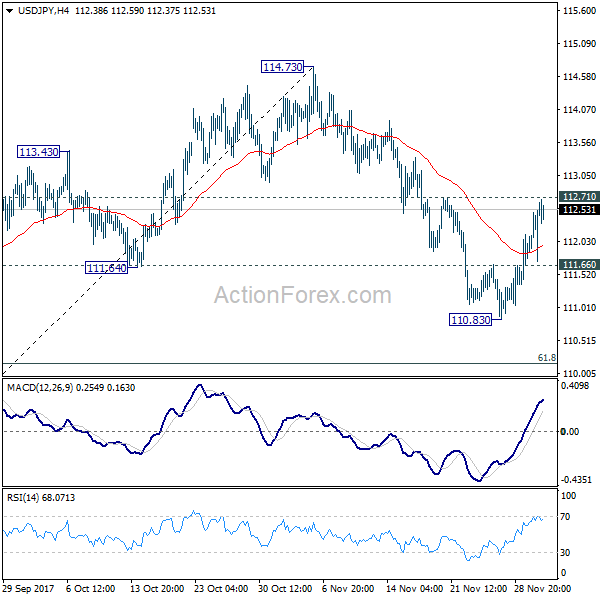
USD/JPY's rebound from 110.83 extended further and focus is now on 112.71 resistance. Sustained break there should confirm completion of pull back from 114.73. In that case, intraday bias will be turned back to the upside for retesting 114.73 resistance. On the downside, below 111.66 minor support will turn bias to the downside and likely resume fall from 112.71 through 110.83. But in that case, we'd expect strong support below 61.8% retracement of 107.31 to 114.73 at 110.14 to bring rebound.
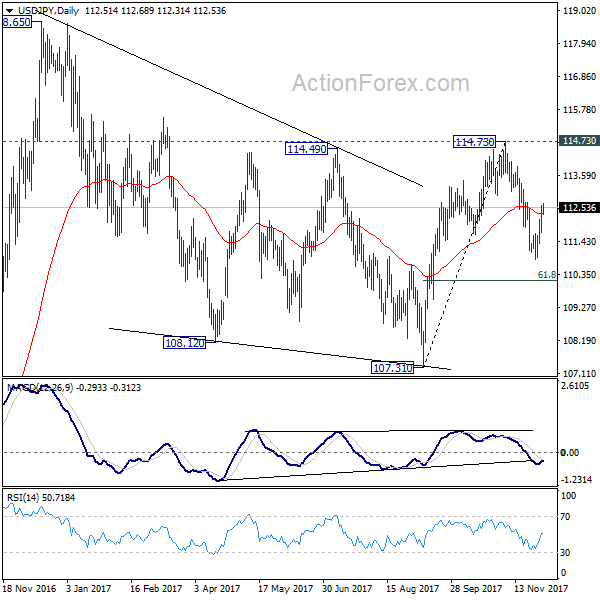
In the bigger picture, as long as 107.31 support holds, medium term rise from 98.97 (2016 low) is not completed yet. And another rise is in favor. Break of 114.73 resistance will target a test on 118.65 high first. However, break of 107.31 will dampen this will and extend the medium term fall back to 98.97 low.