
Sample Category Title
Trade Idea Wrap-up: USD/JPY – Buy at 111.70
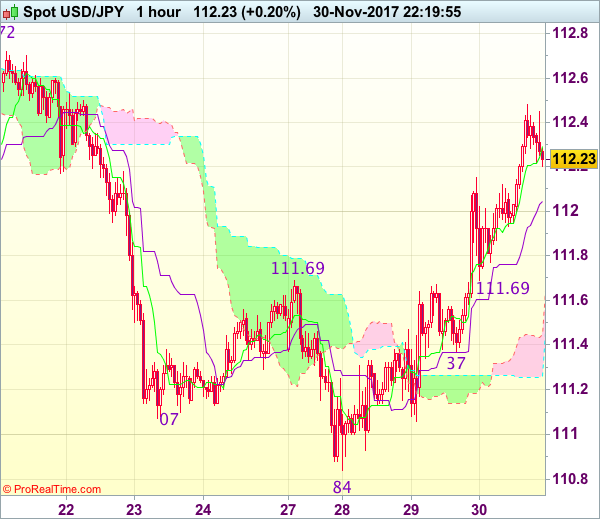
USD/JPY - 112.20
Most recent candlesticks pattern : N/A
Trend : Near term up
Tenkan-Sen level : 112.29
Kijun-Sen level : 112.05
Ichimoku cloud top : 111.45
Ichimoku cloud bottom : 111.26
Original strategy :
Buy at 111.40, Target: 112.40, Stop: 111.05
Position : -
Target : -
Stop : -
New strategy :
Buy at 111.70, Target: 112.70, Stop: 111.35
Position : -
Target : -
Stop : -
As the greenback has eased after rising to 112.48, suggesting minor consolidation would be seen and pullback to 112.00 is likely, however, reckon support at 111.69 would limit downside and bring another rise later, above said resistance would extend the upmove from 110.84 low towards previous resistance at 112.72 but reckon 113.00-10 would hold from here, bring retreat later.
In view of this, we are still looking to buy dollar on further pullback as said support at 111.69 would limit downside. Below support at 111.37 would abort and signal the rebound from 110.84 has ended instead, bring weakness to 111.05-10, then retest of said this week’s low at 110.84.
Dow Jones Hits New Record High on Probe above 24000 Barrier
Dow Jones hit new all-time high on Thursday, on probe above psychological 24000 barrier. Future contract for December delivery hit the highest level at 24039, in extension of uninterrupted bull-leg which extends into sixth straight day. No signs of fatigue seen so far despite strongly overbought daily studies, with price riding on extended fifth wave of five-wave cycle from 21713, which eyes its 300% Fibonacci expansion at 24198. The index is running for the second strong bullish monthly close, part of eight-month uninterrupted bullish action which accelerated further in past two months. Corrective action should be anticipated in coming sessions with extended dips expected to find footstep above rising 10SMA (currently at 23608).
Res: 24046; 24121; 24198; 24255
Sup: 24000; 23892; 23790; 23644
COPPER – Recovery Attempt Above Cloud Base Faces Headwinds
Copper rose on Thursday and hit session high at $3.0915, boosted by better than expected Chinese data (Manufacturing PMI 51.8 in Nov vs 51.4 f/c).
Doji reversal pattern is forming on daily chart after Wednesday action ended in long-legged Doji but managed to close at cloud base ($3.0663) despite spike to strong support at $3.0324 (Fibo 61.8% of larger $2.8930/$3.2580 ascend) which contained dip.
Cloud base continues to provide strong support for further recovery. Fresh bulls cracked pivotal barrier at $3.0863 (Fibo 38.2% of $3.1750/$3.0324) with sustained break here needed to generate fresh bullish signal for extension towards $3.1033 (daily Tenkan-sen).
Daily studies remain bearishly aligned, with risk of limited recovery ahead of fresh weakness, being in play.
While daily Tenkan-sen caps, the downside will remain vulnerable for renewed probe below cloud base, with clear break lower to signal bearish continuation.
Conversely, bears will be delayed on lift above Tenkan-sen (3.1033) and Kijun-sen ($3.1145), but sustained break above daily cloud top ($3.1300) is needed to neutralize existing bearish threats.
Res: 3.0863; 3.0915; 3.1033; 3.1145
Sup: 3.0663; 3.0505; 3.0324; 3.0305
US: Disposable Income Growth Accelerates, But Spending Slows in October
Personal income rose 0.4% in October, a hair above the consensus expectation for 0.3%. Controlling for inflation and removing taxes, real disposable personal income rose 0.3% on the month.
Personal spending increased by 0.3% in nominal terms, in line with expectations. In real terms, spending was up a soft 0.1%, following September's robust, but downwardly revised, 0.5% increase.
By component, real spending on non-durable goods led the way, up 0.5%, but durable goods pulled back 0.1% and services spending was flat on the month.
Prices rose 0.1% month-on-month in October and inflation pulled back to 1.6% year-on-year from 1.7% in September. Core prices rose 0.2% (m/m) in October, but core inflation was unchanged at an upwardly revised 1.4%.
The personal saving rate edged up to 3.2% from 3.0% in September.
Key Implications
Some deceleration in spending growth was expected as spending normalized following the volatility created by hurricanes. Still, the downward revision to September's data in combination with softer-than anticipated durable goods spending in October suggests some downside risk to expectations for fourth quarter consumer spending growth and therefore broader economic growth. Real GDP growth is tracking closer to the 2% than 3% mark at this stage.
With yesterday's upward revision to third quarter GDP, there is little reason to fret a modest deceleration in economic growth. The American economy is continuing to run above its longer-run cruising speed and generating more than enough jobs to push down unemployment.
Inflation remains below the Federal Reserve's target, but appears to be slowly picking up speed. On an annualized basis, core prices were up 2.5% in October.
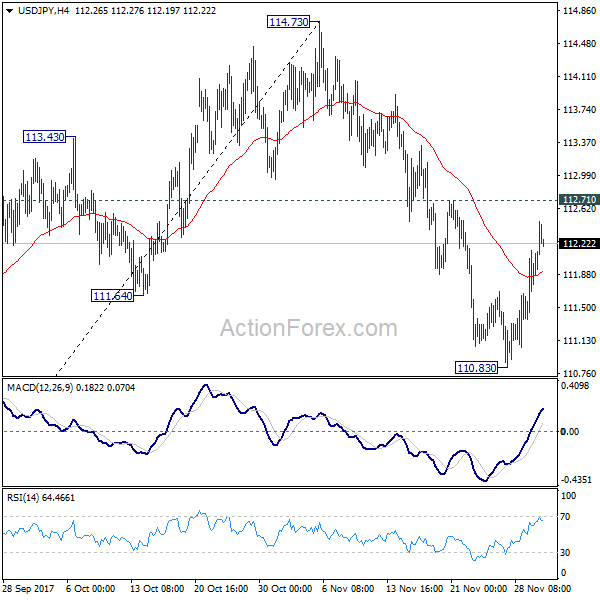
USD/JPY Mid-Day Outlook
Daily Pivots: (S1) 111.47; (P) 111.80; (R1) 112.27; More...
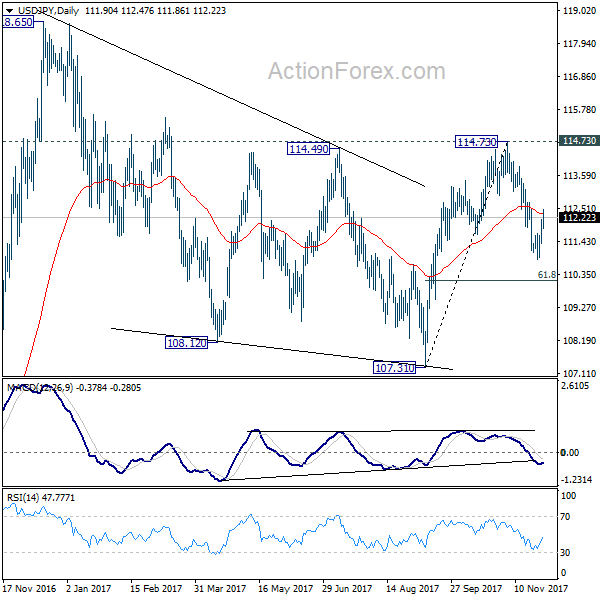
Intraday bias in USD/JPY remains neutral as recovery from 110.83 is still limited well below 112.71 resistance. Another fall remains mildly in favor. Break of 110.83 will target 61.8% retracement of 107.31 to 114.73 at 110.14. We're still favoring the case medium term corrective pattern from 118.65 has completed at 107.31 already. Hence, we'll looking for bottoming below 110.14 to bring another rise. On the upside, break of 112.71 will suggest that the fall from 114.73 is completed and turn bias to the upside for retesting this resistance.
In the bigger picture, as long as 107.31 support holds, medium term rise from 98.97 (2016 low) is not completed yet. And another rise is in favor. Break of 114.73 resistance will target a test on 118.65 high first. However, break of 107.31 will dampen this will and extend the medium term fall back to 98.97 low.
USD/CHF Mid-Day Outlook
Daily Pivots: (S1) 0.9818; (P) 0.9844; (R1) 0.9869; More....
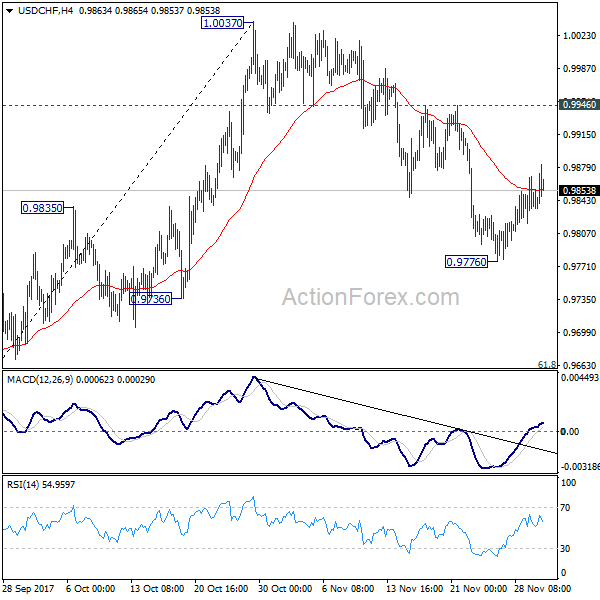
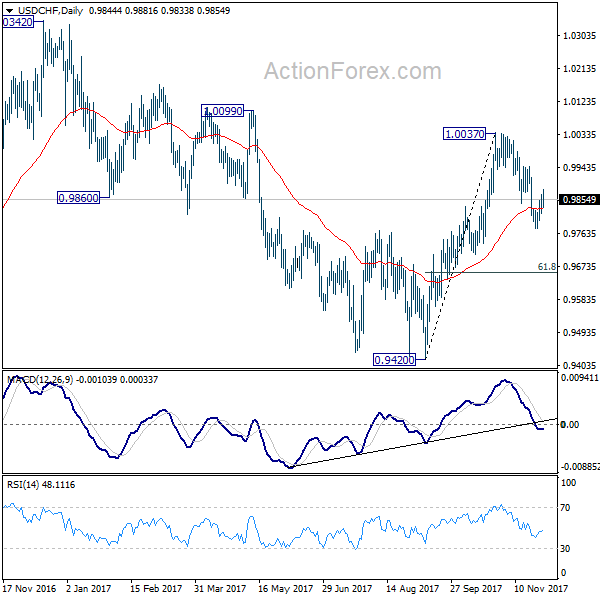
Intraday bias in USD/CHF remains neutral as recovery from 0.9776 is limited well below 0.9446 resistance. Another fall is in favor and break of 0.9776 will target 61.8% retracement of 0.9420 to 1.0037 at 0.9656. We'll look for bottoming again below 0.9656 and above 0.9420. On the upside, break of 0.9946 resistance will indicate that the decline from 1.0037 has completed and bring retest of this resistance.
In the bigger picture, range trading continues between 0.9420/1.0342. At this point, 0.9420 appears to be a strong support level. Therefore, in case of decline attempt, we don't expect a firm break of this level. Nonetheless, strong break of 1.0342 is also needed to confirm upside momentum. Otherwise, medium term outlook will stay neutral.
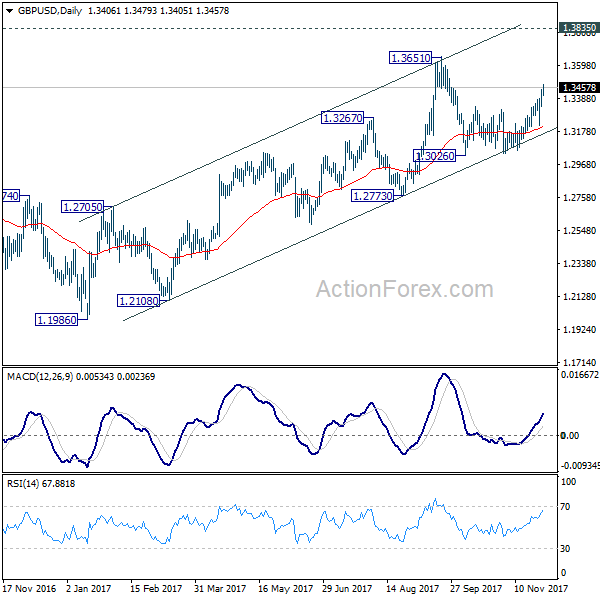
GBP/USD Mid-Day Outlook
Daily Pivots: (S1) 1.3347; (P) 1.3397; (R1) 1.3460; More....
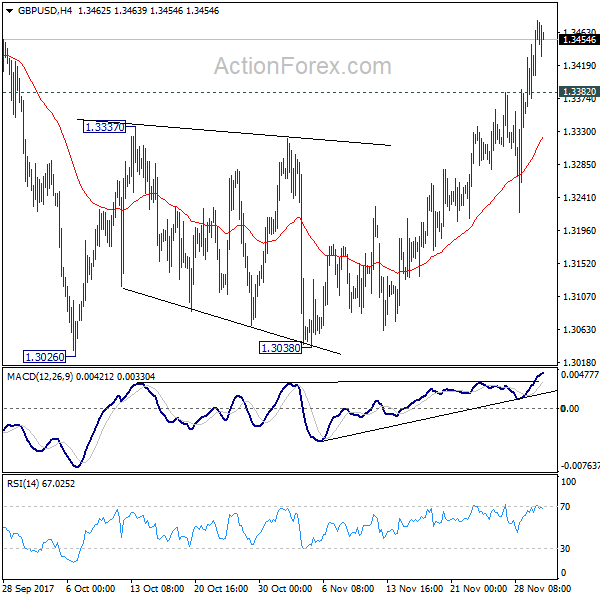
Intraday bias in GBP/USD remains on the upside for 1.3651 high. Break there will resume medium term rally from 1.1946 to 1.3835 key resistance. On the downside, below 1.3382 minor support will turn bias neutral and bring retreat before staging another rally.
In the bigger picture, as noted before, GBP/USD hit strong resistance from the long term falling trend line. Nonetheless, subsequent fall was contained by 55 week EMA (now at 1.3069). Outlook is a bit mixed. For the moment, as long as 1.3835 support turned resistance holds, medium term rise from 1.1946 are viewed as a corrective pattern. That is, we'd expect another leg in the long term down trend through 1.1946 low. However, sustained break of 1.3835 should at least send GBP/USD to 38.2% retracement of 2.1161 (2007 high) to 1.1946 (2016 low) at 1.5466.
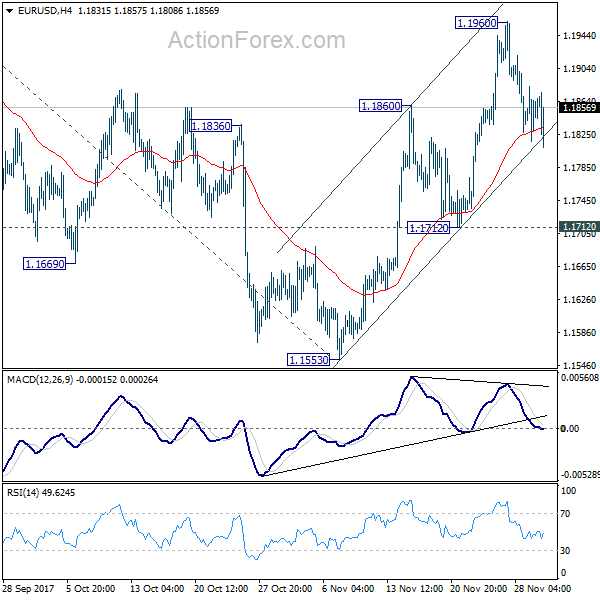
EUR/USD Mid-Day Outlook
Daily Pivots: (S1) 1.1814; (P) 1.1849 (R1) 1.1881; More....
EUR/USD is staying in consolidation from 1.1960 and intraday bias remains neutral. With 1.1712 support intact, rise from 1.1553 is expected to resume later. Break of 1.1960 will turn bias to the upside for retesting 1.2091 high first. Break there will resume medium term up trend from 1.0339 and target 61.8% projection of 1.0569 to 1.2091 from 1.1553 at 1.2494, which is close to 1.2516 long term fibonacci level. We'd expect strong resistance from there to bring reversal. On the downside, break of 1.1712 will indicate completion of the rise from 1.1553 and turn near term outlook bearish.
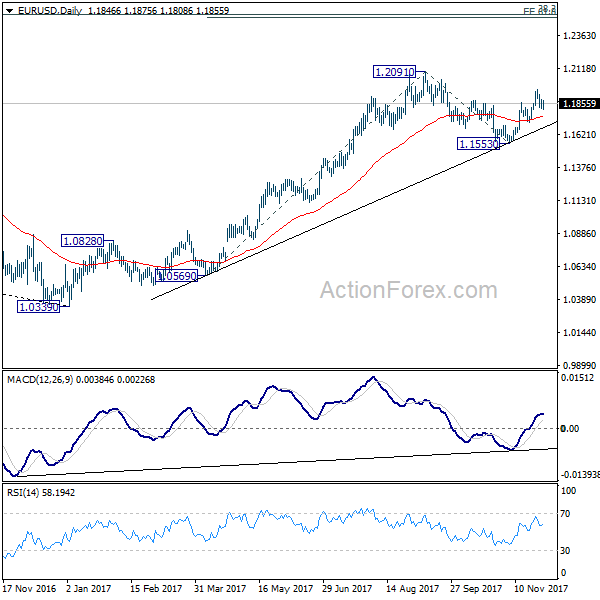
In the bigger picture, rise from 1.0339 medium term bottom is seen as a corrective move for the moment. Therefore, in case of another rally, we'd be expect 38.2% retracement of 1.6039 (2008 high) to 1.0339 (2017 low) at 1.2516 to limit upside and bring reversal. Meanwhile, sustained trading below 55 week EMA (now at 1.1393) will suggest that such medium term rebound is completed and could then bring retest of 1.0339 low.
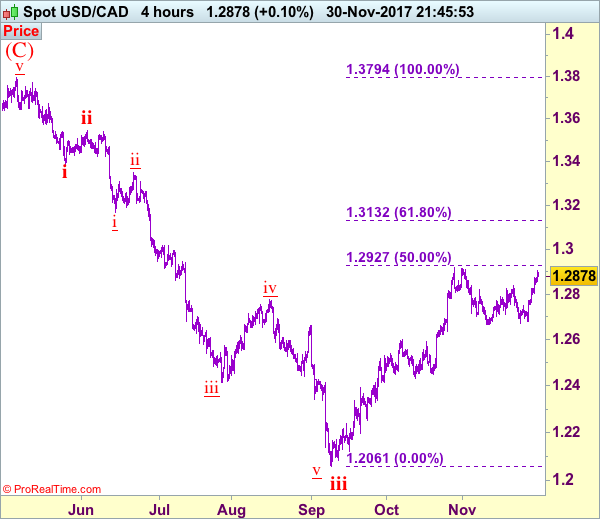
Trade Idea: USD/CAD – Buy at 1.2820
USD/CAD - 1.2890
Trend: Near term up
New strategy :
Buy at 1.2820, Target: 1.3000, Stop: 1.2760
Position: -
Target: -
Stop:-
The greenback has rallied after holding above support at 1.2672 and bore above resistance at 1.2837, suggesting correction from 1.2917 has ended and retest of this level would be seen, however, break there is needed to confirm recent rise has resumed and extend gain to 1.2975-80 (61.8% Fibonacci retracement of 1.3547-1.2061), then towards psychological resistance at 1.3000 but near term overbought condition should limit upside to 1.3050-55 and price should falter well below 1.3130-35 (61.8% Fibonacci retracement of 1.3794-1.2061), bring retreat later.
In view of this, we are looking to buy on pullback as 1.2810-20 should limit downside and bring another rise later. Below 1.2770-75 would defer and prolong choppy trading, risk weakness to 1.2745-50, then towards 1.2700-10 but price should stay well above said support at 1.2672, bring another rebound later.
To recap, wave B from 1.3066 is unfolding as an a-b-c and is sub-divided as a: 1.2192, b: 1.2716 and wave c is a 5-waver with i: 1.1983, ii: 1.2506, extended wave iii with minor iii at 1.0206, wave iv ended at 1.0781 and wave v as well as wave iii has ended at 0.9931, hence the subsequent choppy trading is the wave iv which is unfolding as (a)-(b)-(c) with (a) leg of iv ended at 1.0854, followed by (b) leg at 1.0108 and (c) leg as well as the wave iv ended at 1.0674. The wave v is sub-divided by minor wave (i): 0.9980, (ii): 1.0374, (iii): 0.9446, (iv): 0.9913 and (v) as well as v has possibly ended at 0.9407, therefore, consolidation with upside bias is seen for major correction, indicated target at 1.3700 and 1.4000 had been met and further gain to 1.4700 would be seen later.
From Eurozone CPI to US PCE
Aside from the news of Bitcoin rocketing to $11,434 before plunging back to $9007, markets are focusing on GBP's prolonged gains, boosted by talk of an pending deal on the Brexit bill and resolution on the Irish border. Markets turn next to US October core PCE index, the Fed's favourite inflation gauge, expected +1.4% from 1.3%. Earlier, Eurozone preliminary Nov CPI rose to 1.5% from 1.4%, undershooting expectations of 1.6%. The Premium Insights service took 150-pip gain in GBPUSD. A new trade will be posted before start of the US opening bell.
Bitcoin was gripped by the FOMO phase over the past month and that led to an incredible run that attracted more and more buying. It continued through $10,000 on Wednesday until a wave of profit taking turned into a 20% correction over the course of a few hours. Later, it rebounded to $10,200 but some exchanges were having difficulty.
The volatility created a massive indecisive candle on the chart and that could be a warning sign. However, all the attention and volatility hasn't been a negative up to this point so it's no reason to expect a drop just yet.
In financial markets, the main story on the day was a rise in global bond yields. German and US 10-year yields rose 5-6 bps and that was a reason to buy yen crosses. USD/JPY rebounded for the second day and hit 112.00. The gains came after some upbeat comments from Fed Chair Yellen. She said growth was becoming more broad based. The second look at Q3 GDP was also revised to +3.3% from +3.2% in part due to strong business investment.
The most-solid trend at the moment in FX is sterling's climb. It's risen in 10 of the past 12 sessions and is trading at the best since Oct 2. Ashraf pointed out in the video that the 7 consecutive daily gains were the longest string of advances since April 2015. Signs of progress on Brexit negotiations continue to mount and that's helping the pound to rebound from depressed levels.