
Sample Category Title
GBP/JPY Weekly Outlook
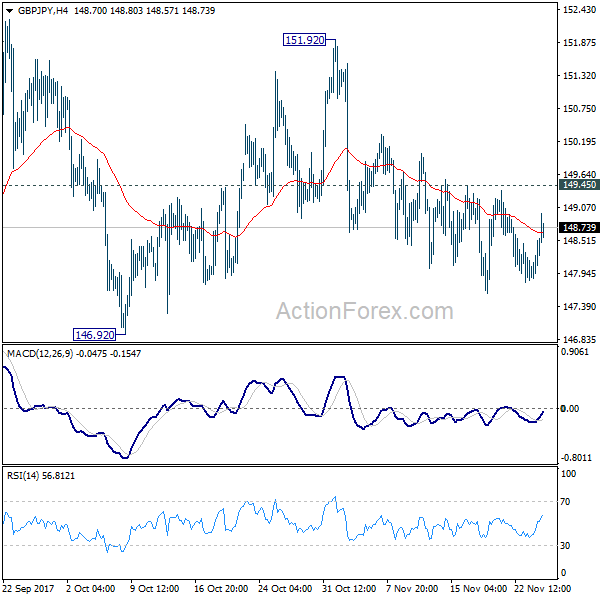
No change in GBP/JPY after last week's choppy price actions. Price actions from 152.82 are developing to a corrective pattern. As long as 149.45 minor resistance holds, deeper fall is mildly in favor through 146.92 support. But we'd expect strong support from 61.8% retracement of 139.29 to 152.82 at 144.45 to contain downside and bring rebound. On the upside, break of 149.45 resistance will turn bias back to the upside for 151.92/152.82 resistance zone instead.
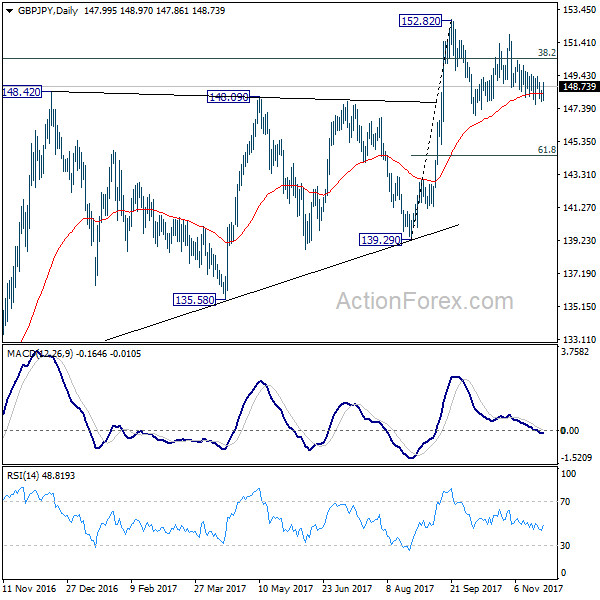
In the bigger picture, medium term rebound from 122.36 is still expected to resume after corrective pull back from 152.82 completes. Firm break of 38.2% retracement of 196.85 to 122.36 at 150.43 will carry long term bullish implications. In that case, GBP/JPY could target 61.8% retracement at 167.78. However, break of 139.29 will indicate rejection from 150.43 key fibonacci level. And the three wave corrective structure of rebound from 122.36 will argue that larger down trend is resuming for a new low below 122.26.
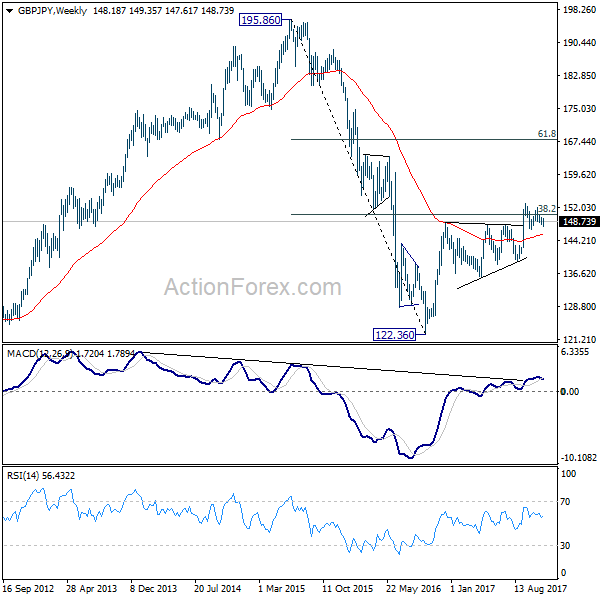
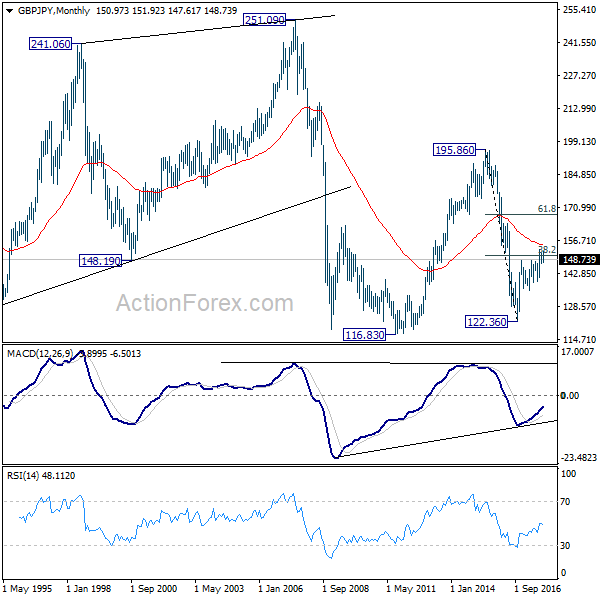
In the longer term picture, current rebound argues that the down trend from 195.86 (2015 high) has already completed at 122.36. Focus is now on 55 month EMA (now at 154.78). Firm break there will suggest that rise form 122.36 is developing into a long term move that target 195.86 again. And, price actions from 116.83 (2011 low) is indeed a sideway pattern that could last more than a decade. However, firm break of 139.29 will suggests that the long term down trend is still in progress and could break 116.83 low ahead.
EUR/JPY Weekly Outlook
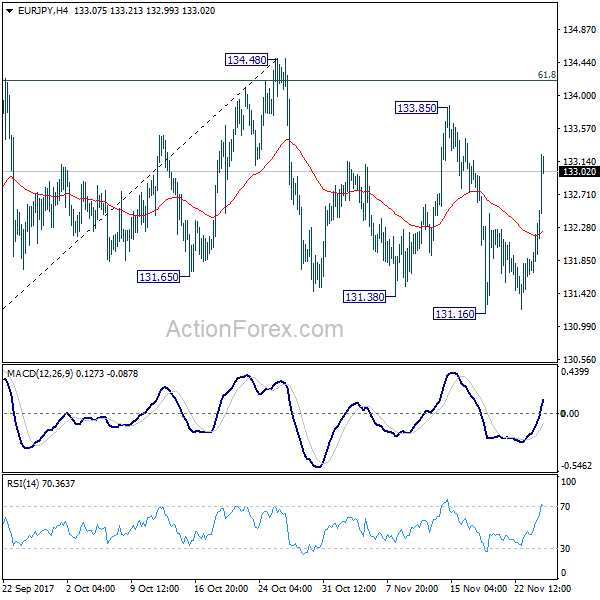
Near term outlook in EUR/JPY is a bit mixed. 134.20 fibonacci level is proven to be a strong resistance. But there was no follow through downside momentum confirm trend reversal Initial bias in EUR/JPY stays neutral this week. Risk will remain on the downside as long as 134.48 key resistance holds. Break of 131.16 will target 38.2% retracement of 114.84 to 134.48 at 126.97, which is close to 127.55 support. We'll look for support from there to bring rebound on first attempt.
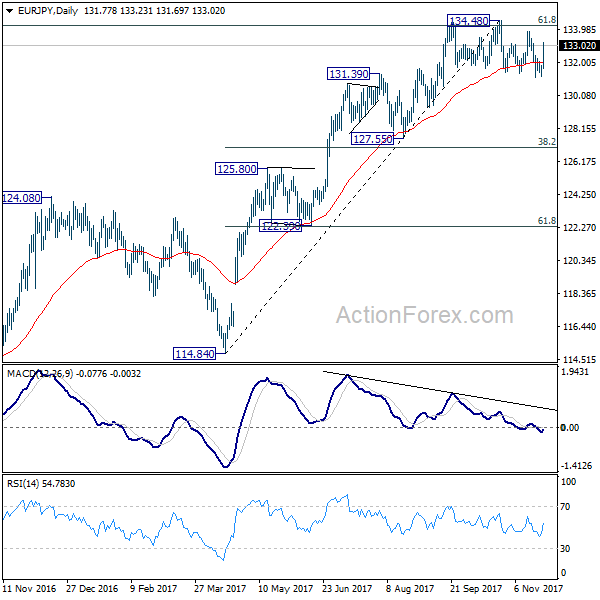
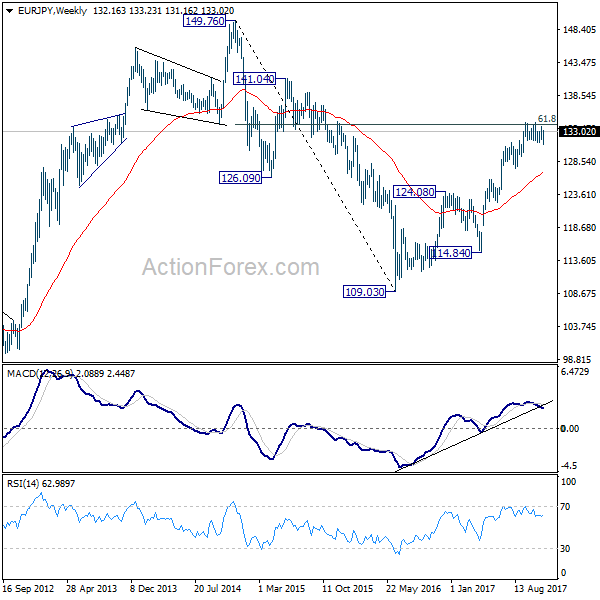
In the bigger picture, medium term rise from 109.03 (2016 low) is seen as at the same degree as the down trend from 149.76 (2014 high) to 109.03 (2016 low). 61.8% retracement of 149.76 to 109.03 at 134.20 is already met. Sustained break there will pave the way to key long term resistance zone at 141.04/149.76. However, break of 127.55 support will argue that the medium term trend has reversed and will turn outlook bearish for deeper fall back to 114.84/124.08 support zone at least.
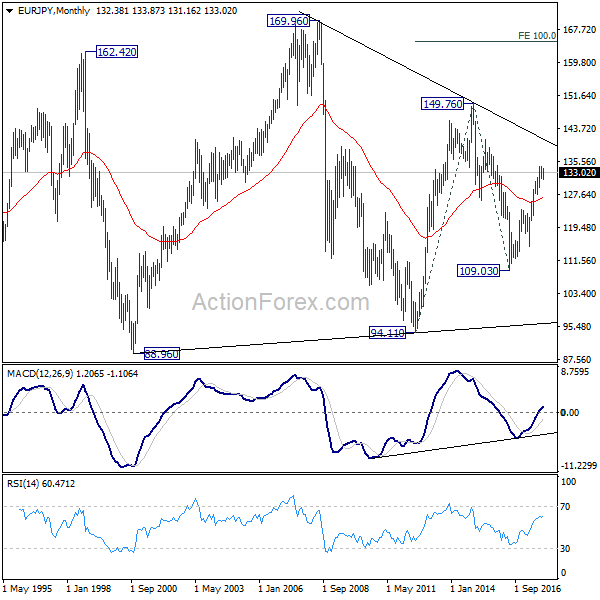
In the long term picture, at this point, there is no clear indication that rise from 109.03 is resuming that from 94.11. Hence, we'd be cautious on topping below 149.76 to extend range trading. Nonetheless, firm break of 149.76 will indicates strong underlying buying. In such case, EUR/JPY will target 100% projection of 94.11 to 149.76 from 109.03 at 164.68.
EUR/GBP Weekly Outlook
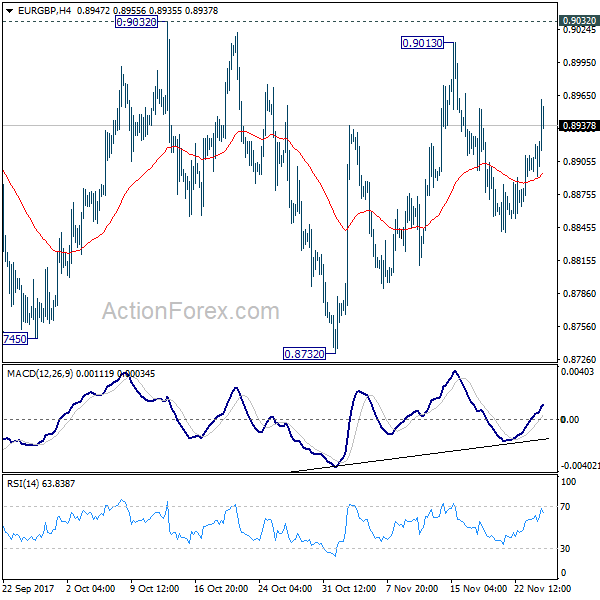
EUR/GBP stayed in range of 0.8732/9032 last week and outlook is unchanged. Initial bias remains neutral this week first. With 0.9032 resistance intact, deeper decline is mildly in favor in the cross. Break of 0.8732 will resume the fall from 0.9305 and target 0.8303 key support level. However, on the upside, decisive break of 0.9032 will confirm completion of the decline from 0.9305. In such case, intraday bias will be turned back to the upside for retesting 0.9305 key resistance.
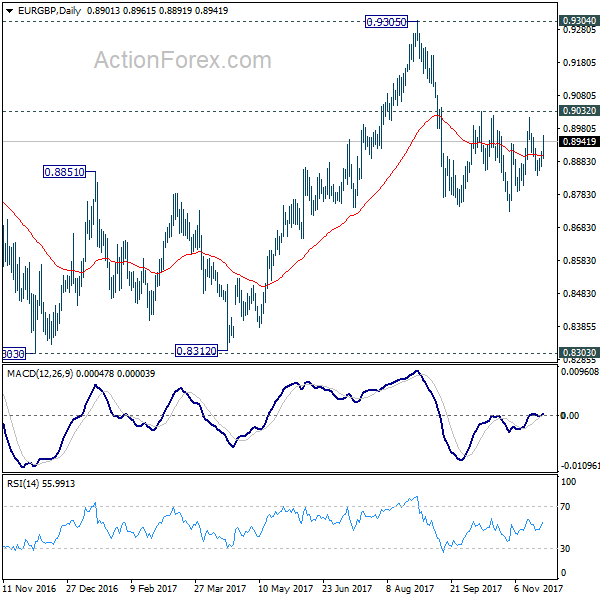
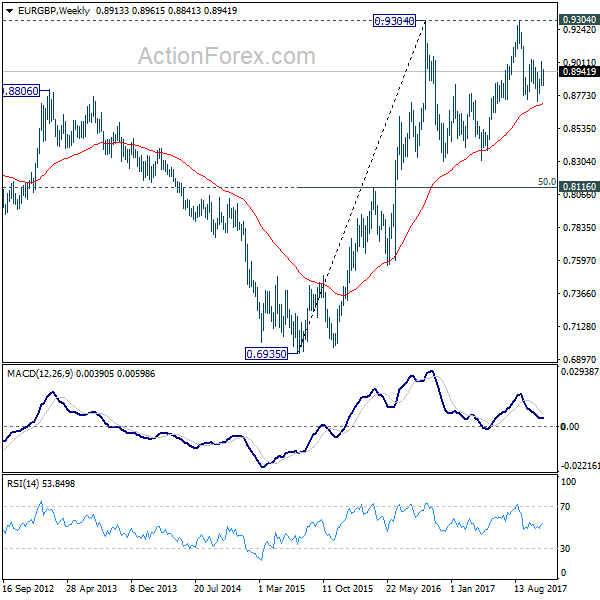
In the bigger picture, there are various ways to interpret price actions from 0.9304 high. But after all, firm break of 0.9304/5 is needed to confirm up trend resumption. Otherwise, range trading will continue with risk of deeper fall. And in that case, EUR/GBP could have a retest on 0.8303. But we'd expect strong support from 0.8116 cluster support (50% retracement of 0.6935 to 0.9304 at 0.8120) to contain downside.
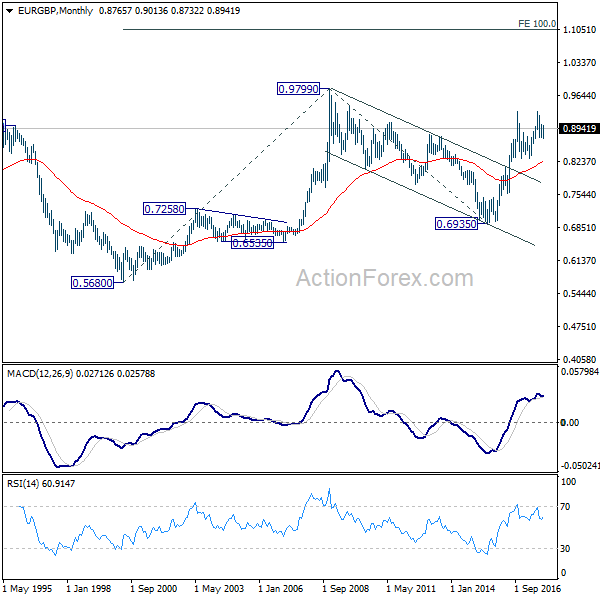
In the long term picture, firstly, price action from 0.9799 (2008 high) is seen as a long term corrective pattern and should have completed at 0.6935 (2015 low). Secondly, rise from 0.6935 is likely resuming up trend from 0.5680 (2000 low). Thirdly, this is supported by the impulsive structure of the rise from 0.6935 to 0.9304. Hence, after the correction from 0.9304 completes, we'd expect another medium term up trend through 0.9799 to 100% projection of 0.5680 to 0.9799 from 0.6935 at 1.1054.
EUR/AUD Weekly Outlook
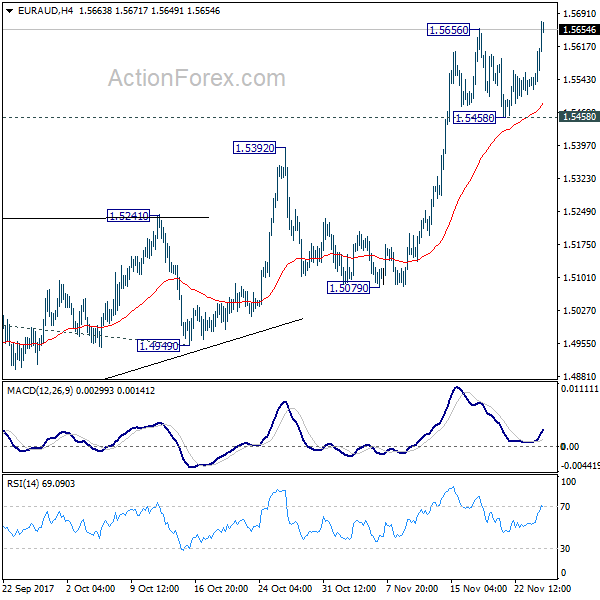
EUR/AUD's late rally and break of 1.5656 resistance indicates that medium term up trend is still in progress and has resumed. Initial bias in the upside this week. Current rise should target 61.8% projection of 1.3624 to 1.5226 from 1.4949 at 1.5939 first. Break will target 100% projection at 1.6551, which is close to 1.6587 key resistance. On the downside, break of 1.5458 support is needed to indicate short term topping. Otherwise, outlook will remains bullish in case of retreat.
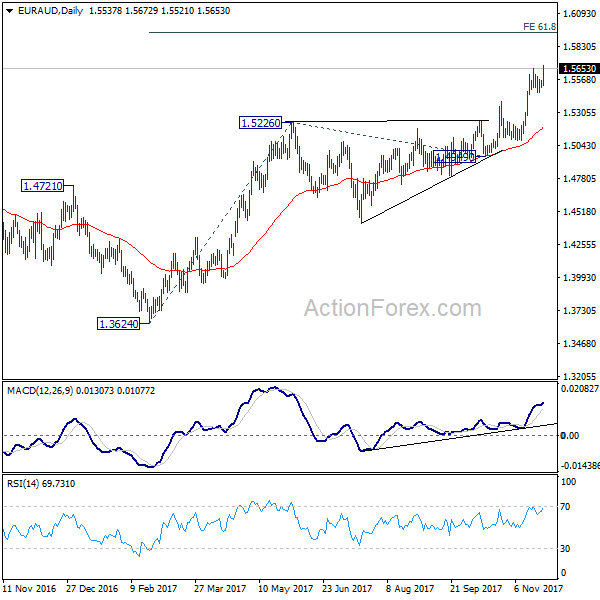
In the bigger picture, we're holding on to the view that corrective decline from 1.6587 medium term top (2015 high) has completed at 1.3624. Rise from 1.3624 is expected to extend to retest 1.6587. We'll hold on to this bullish view as long as 1.5226 resistance turned support holds. Firm break of 1.6587 will resume long term rise from 1.1602 (2012 low).
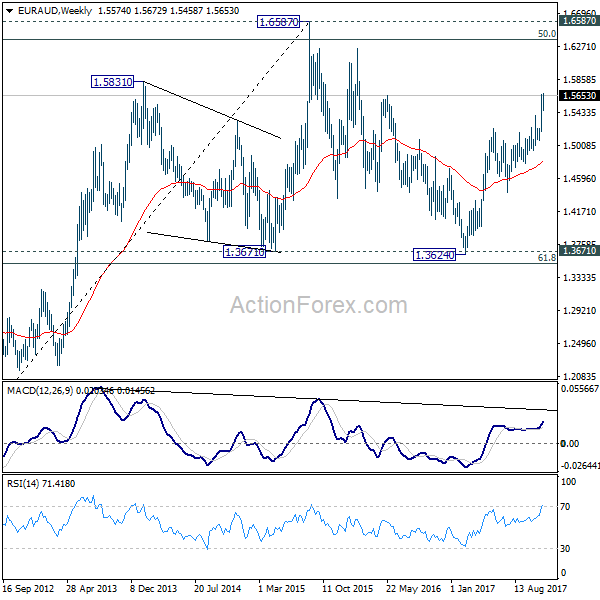
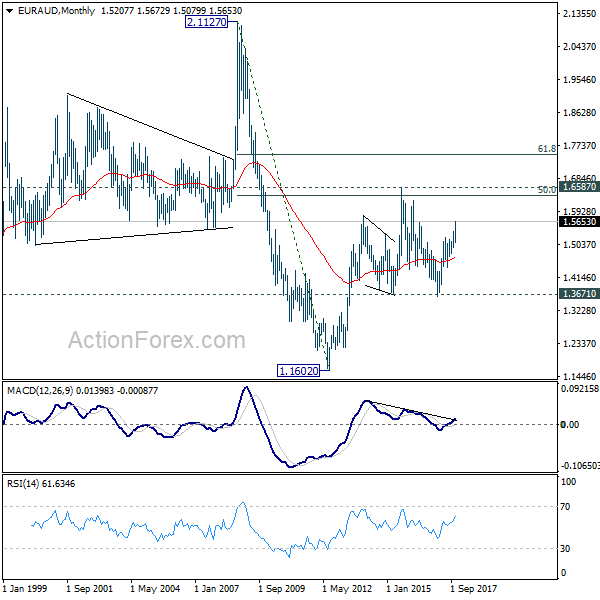
In the longer term picture, the rise from 1.1602 long term bottom isn't over yet. We'll keep monitoring the development but there is prospect of extending the rise to 61.8% retracement of 2.1127 to 1.1602 at 1.7488 and above. However, sustained trading below 1.3671 should confirm trend reversal and target 1.1602 long term bottom again.
EUR/CHF Weekly Outlook
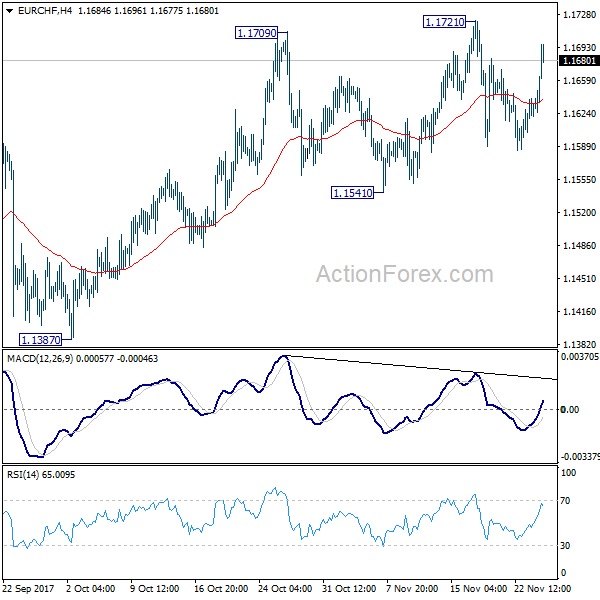
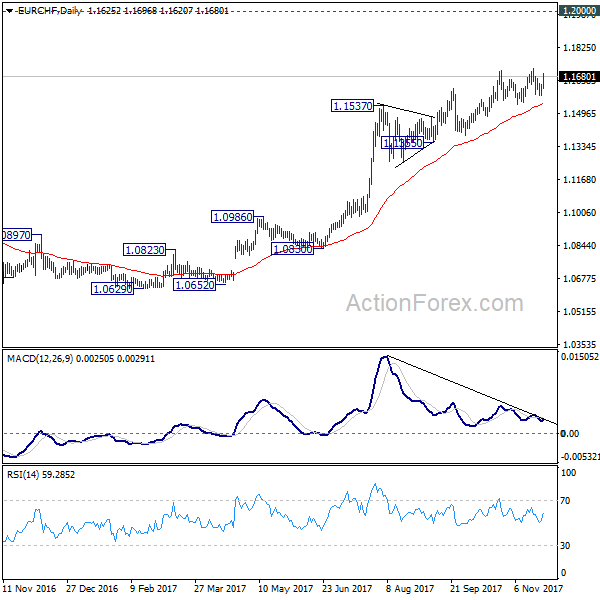
EUR/CHF stayed in corrective trading below 1.1721 last week. As downside of retreat was contained well above 1.1541 near term support, outlook stays bullish. Decisive break of 1.1721 will resume the medium term tup trend and target 1.2 key level. On the downside, considering bearish divergence condition in 4 hour MACD and daily MACD, decisive break of 1.1541 will confirm topping and turn near term outlook bearish for 1.1355 key support.
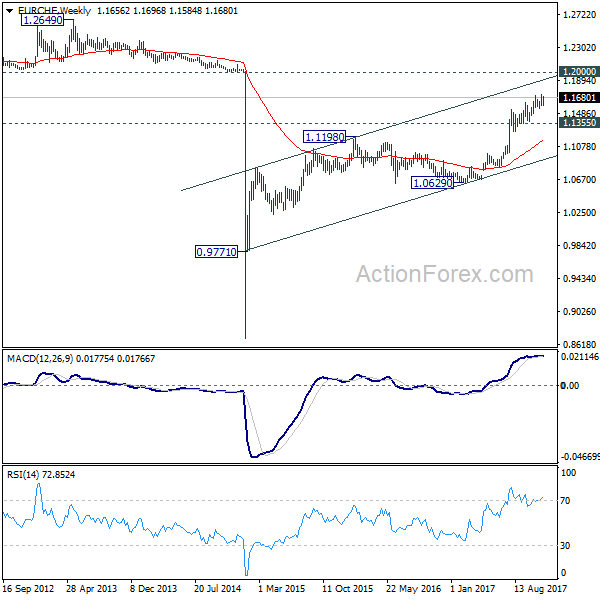
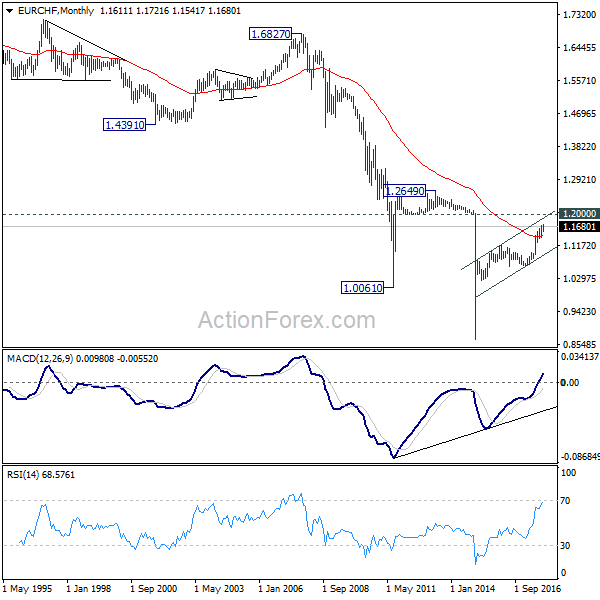
In the bigger picture, long term rise from SNB spike low back in 2015 is still in progress. EUR/CHF should now be heading back to prior SNB imposed floor at 1.2000. For now, this will be the favored case as long as 1.1355 support holds. However, break of 1.1355 will indicate medium term topping. In that case, EUR/CHF should head back to 55 week EMA (now at 1.1142) and possibly below.
Euro Jumped on Improving German Economic and Political Outlook; Dollar Softened ahead of “Make or Break” Week for Tax...
Euro surged broadly last week as economic data suggested a "boom" in Germany ahead. Also, political situation in Germany has improved. Ending as the strongest currency, Euro also took Sterling and Swiss Franc high. On the other hand, Dollar ended as the weakest one as traders held their bet during thin holiday trading. The US tax plan is entering into a "make or break" week. Despite sharp rally in oil price, Canadian Dollar ended as the second weakest one as data suggested that BoC would remain on hold. Aussie and Yen were both weak too. We perceive the rout in China stock markets as a factor in pressuring both.
German President arranges a talk between Merkel and SPD Schulz
Euro was the star performer last week as boosted by improving political situation in Germany as well as economic outlook. Center-left SPD, Chancellor Merkel's ex-coalition partner, is now back in the picture after they expressed the willingness to talk to CDU/CSU. President Frank Walter Steinmeier, an SPD member, will hold a meeting between Merkel and SPD leader Martin Schulz next week. There were calls within in the SPD last week for a rebirth of the grand coalition and Schulz appeared to have softened his stance as he said "nothing automatic" on the party's direction. And he added further that "if a discussion results in us deciding to participate in any form whatsoever in the formation of a government, we will put it to a vote of party members."
The options here are that firstly, SPD could rejoin the government and Merkel will likely have to turn a bit left to accommodate SPD. Secondly, Merkel could form a minority government with Greens with promises from SPD for backing on some key issues. But Merkel has made herself clear that she doesn't want a minority government. President Steinmeier could call for a new election if all the talks finally fail. The situation is still rather unclear for Germany. Nonetheless, it certainty looks bright than a week ago.
German Ifo suggested a "boom" ahead
Additional, German Ifo business climate jumped to 117.5 in November up from 116.8 and beat expectation of 116.5. More importantly, that's the highest reading on record. Expectation gauge rose to 111.0, up from 109.2, beat expectation of 108.8. Current assessment gauge, however, dropped to 124.4, down from 124.8 and missed expectation of 125.0. Ifo head Clemens Fuest said that "sentiment among German businesses is very strong." And, "this was due to far more optimistic business expectations. The German economy is on track for a boom.
Dollar traders await "make or break week" for Republican tax plan
On the other hand, Dollar was under much selling pressure last week, in particular against Euro and Yen. One reason was that traders were holding their bets on the greenback in thin holiday trading, ahead of developments of tax plan in the Senate this week. It's seen as a make or break week for the Republican's tax plan as the Senate would hold a floor vote as early as on Thursday. Republican holds a very slim 52 majority in Chambers and cannot afford losing more than two votes. President Donald Trump will meet with Senate Republicans as the US Capitol on Tuesday.
FOMC minutes showed increased concerns on low inflation
Secondly, the greenback is pressured by FOMC minutes, which expressed concerns on inflation outlook. On the one hand, the minutes did imply that a December rate hike is a done deal. On the other hand, the minutes revealed a detailed discussion over the possibility of persistent weakness on inflation. As noted, 'several' members expressed concerns that 'persistently weak inflation data could lead to a decline in longer-term inflation expectations or may have done so already'. They noted the 'diminished responsiveness of inflation to resource utilization, to the possibility that the degree of labor market tightness was less than currently estimated, or to lags in the response of inflation to greater resource utilization as plausible explanations for the continued soft readings on inflation'.
The net results were that 2 year yield ended the week up a basis point at 1.740 on expectation of December hike. But 10 year yield dropped one basis point for the week at 2.343. 30 year yield dropped -2.7% basis points to 2.763 for the week. Flattening yield curve is a seen as a key factor in driving down USD/JPY.
Dollar index heading back towards 91.01 low
Dollar index's sharp fall last week finally confirmed that rebound from 91.01 has completed at 95.51. Near term outlook will now stay bearish as long as 94.16 resistance holds, and deeper fall wold be seen towards 91.01 low. Nonetheless, we maintain that 91.91/3 cluster support is a key support region (38.2% retracement of 72.69 to 103.82 at 91.93). However, sustained break there will bring deeper fall to next key cluster support level at 84.58/75).
China stock rout pushed Yen higher
Stock market rout in China is also see as another key factor in driving Yen higher last week (even though it's overshadowed by European majors). The SSE composite failed to break through 3450.49 high and suffered steep selloff on Thursday and Friday. The Close below 55 day EMA (now at 3371.88) together with bearish divergence condition in daily MACD, suggests that rise from 3016.53 has made a top at 3450.59. And deeper correction would likely be seen in near term to 38.2% retracement of 3016.53 to 3450.49 at 3284.71.
It's very very early to decide whether 3450.49 is an important top. But there are two things to consider. Firstly, medium term projection from 2638.30 to 3301.21 from 3016.53 at 3426.20 was met and strong resistance was seen there. Secondly, and more importantly, price actions from 2016 low at 2638.30 are clearly corrective. 55 week EMA at 3245.60 is a key level to watch. The medium term rise would still be in favor to extend as long as this support holds. However, sustained break there could reverse the trend and send the index through 3016.53 key support. In that case, AUD/JPY could follow lower.
Trading strategy
Our AUD/USD short (sold at 0.7624) was stopped out at 0.7624 last week as the pair rebounded, breaking even. That was mainly driven by Dollar's weakness mentioned above. And it has nothing to do with Aussie strength. The greenback may take some more time to regain its momentum. But still, selling Aussie would be prudent strategy as RBA is no where near a rate hike. Indeed, EUR/AUD, AUD/USD and AUD/JPY all present the fundamental factors to sell Aussie. But for the time being, we'd like to hold our hands and see which factors would develop into a long lasting one.
EUR/USD Weekly Outlook
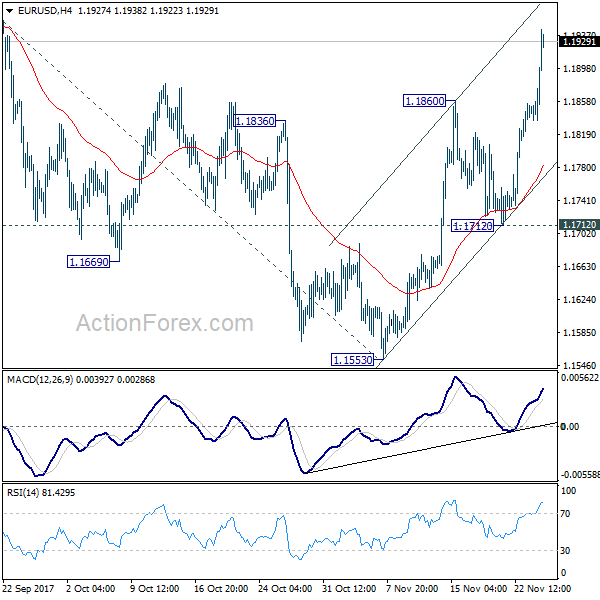
EUR/USD's rise from 1.1553 extended last week after brief pull back and closed strongly at 1.1929. Initial bias remains on the upside this week for 1.2091 first. Break there will resume medium term up trend from 1.0339 and target 61.8% projection of 1.0569 to 1.2091 from 1.1553 at 1.2494, which is close to 1.2516 long term fibonacci level. We'd expect strong resistance from there to bring reversal. On the downside, break of 1.1712 support is needed to indicate completion of rise from 1.1553. Otherwise, outlook will remain cautiously bullish in case of retreat.
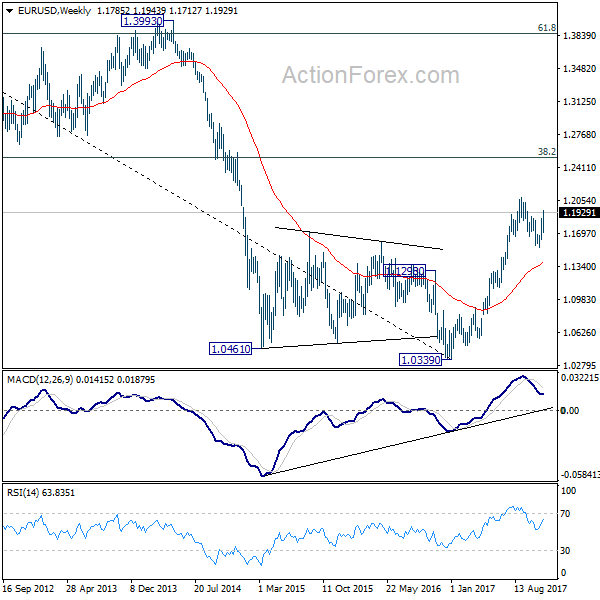
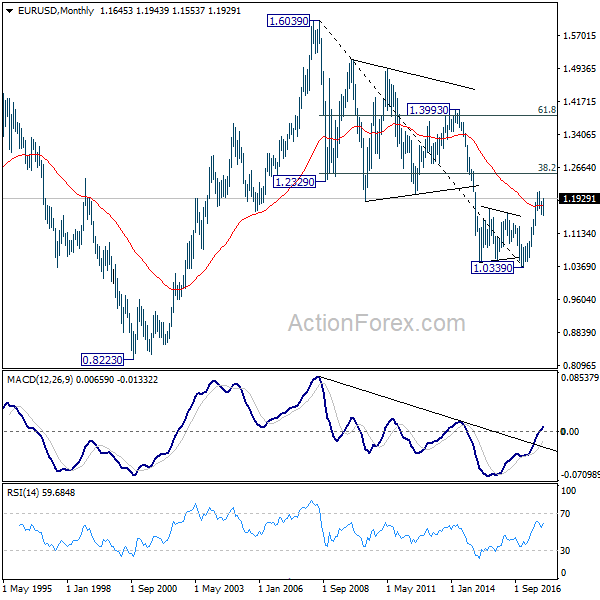
In the bigger picture, rise from 1.0339 medium term bottom is seen as a corrective move for the moment. Therefore, in case of another rally, we'd be expect 38.2% retracement of 1.6039 (2008 high) to 1.0339 (2017 low) at 1.2516 to limit upside and bring reversal. Meanwhile, sustained trading below 55 week EMA (now at 1.1393) will suggest that such medium term rebound is completed and could then bring retest of 1.0339 low.
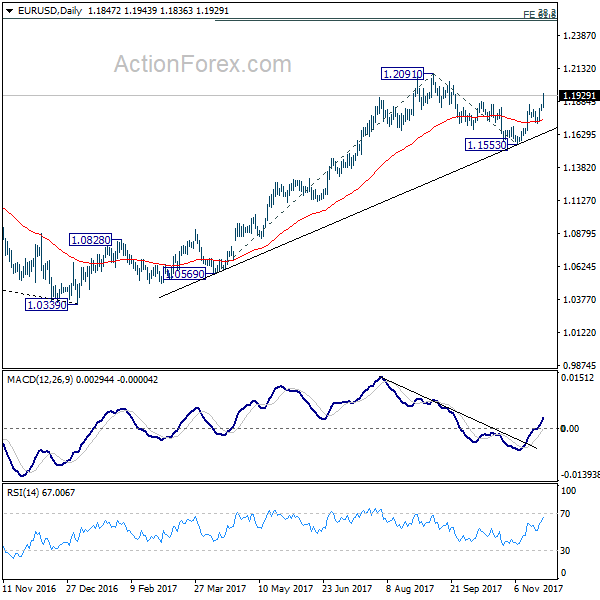
In the long term picture, 1.0339 is now seen as an important bottom as the down trend from 1.6039 (2008 high) could have completed. It's still early to decide whether price action form 1.0339 is developing into a corrective or impulsive move. On the upside, strong resistance could be seen from 38.2% retracement of 1.6039 to 1.0339 at 1.2516. On the downside, we're not anticipating a break of 1.0339 in near to medium term.
Eco Data 11/30/17
[php_everywhere] [/php_everywhere]
Eco Data 11/29/17
[php_everywhere] [/php_everywhere]
Eco Data 11/28/17
[php_everywhere] [/php_everywhere]
Eco Data 11/27/17
[php_everywhere] [/php_everywhere]