Sample Category Title
Daily Wave Analysis: EUR/USD Breaks Channel Resistance With Bullish Wave-3 Momentum
Currency pair EUR/USD
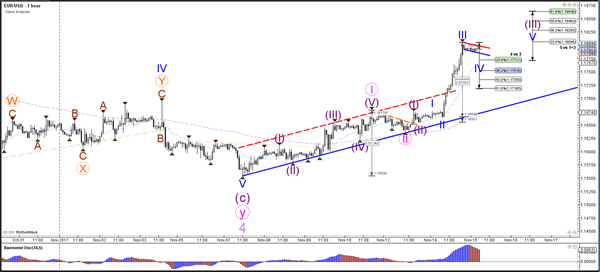
EUR/USD broke the resistance trend line (dotted red) of the bearish trend channel with strong momentum. This is indicating that the downtrend is completed and more upside is likely. The bullish price action indicates that the wave 4 (light purple) is completed and price is expected to continue within the wave 5. The current momentum is typical for a wave 3 pattern (pink).
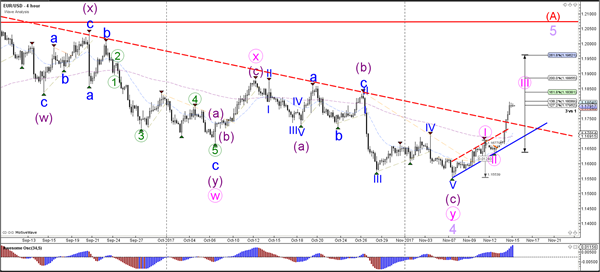
The EUR/USD is probably building multiple wave 3s now. The current wave 3-4 (blue) is building a bull flag pattern which could see an immediate bullish break or a bearish retracement towards the Fib levels of wave 4 vs 3 (blue).
Currency pair GBP/USD
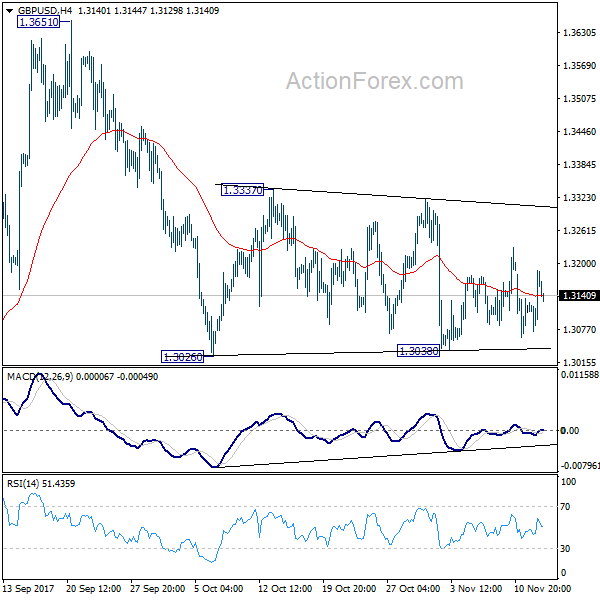
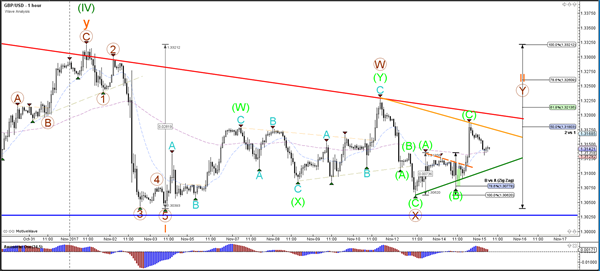
The GBP/USD remains choppy and is unable to break above and below the support (blue) and resistance (red) trend lines. A breakout is needed before a larger directional move can be expected, although a bullish breakout still faces resistance from the Fibonacci levels of wave 2 (orange).
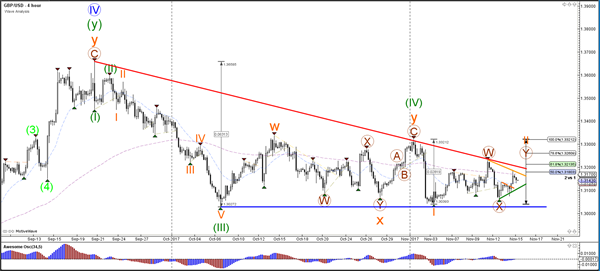
The GBP/USD completed the ABC zigzag correction (green) as expected in yesterday's analysis. The next wave depends on the breakout direction. The main scenario is probably that the wave Y (brown) sees price extend sideways.
Currency pair USD/JPY
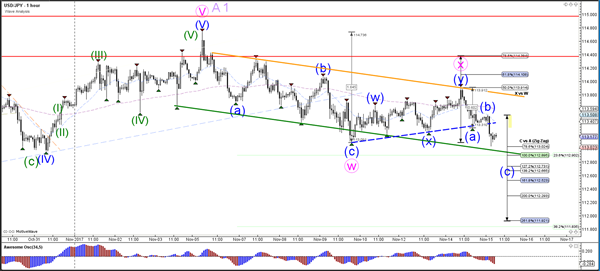
The USD/JPY is still in its choppy bearish trend channel. A bullish breakout could test the resistance levels of wave X (pink). A bearish breakout below the 23.6% Fib could see a drop lower to the Fibonacci levels of wave 2 or wave B (light purple).
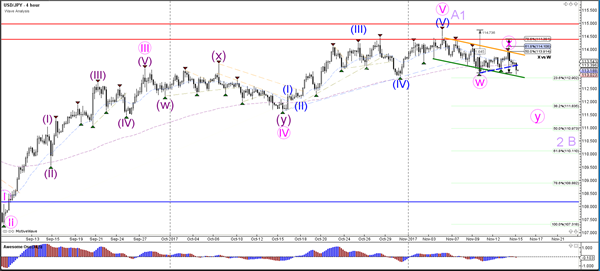
The USD/JPY is testing the Fibonacci support and trend line (green).
Oil Gushes Lower Leading Commodity Exodus
Oil prices tanked overnight as an overbought commodity market finally ran out of steam.
The long-awaited short-term correction in oil prices finally occurred overnight with Brent and WTI, both plunging some 3% as commodities prices, in general, were cratered on fears of slowing growth in China. To be fair, given the bullish run and extended long positioning across commodities in general in recent times, it was only going to one straw to break the camel's back and see a mass rush for the fire exits by long positioning.
Oil, in fact, received a series of camel straws across its back which all came together to produce the overnight sell-off. The American Petroleum Institute's (API) Crude Inventories came in at +6.5 million barrels against an expected drawdown of -1.6 million barrels. China data yesterday was slightly on the soft side. Finally, the International Energy Agency (IEA) Report put the boot well and truly into crude. The IEA forecast that demand would drop with prices at these levels, that American shale would continue to ramp up production and said temporary chances in production rather than structural ones were responsible for much of the recent rally.
Brent crude's double tops at 64.80 and 64.45 are now well in place as strong medium-term resistance with interim resistance at 62.70. Below its present level at 61.60, critical support for the rally currently sits at 60.00, a daily triple bottom and also trend-line support this morning. A daily close under this level opens the doors to a test of the long-term trend line at 57.30.
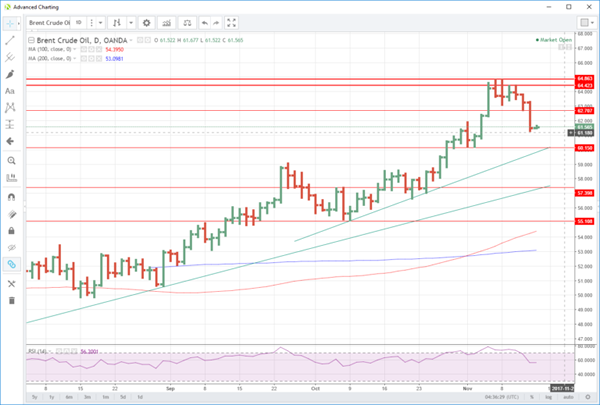
Brent Crude Daily
WTI sits at 55.00 barely above its overnight close. 56.15, the approximate low of the week is now formidable resistance. This is followed by last week's high at 57.80. WTI's downside looks less secure with trend line support nearby at 54.50 with a break opening up 53.50 and then 52.50.
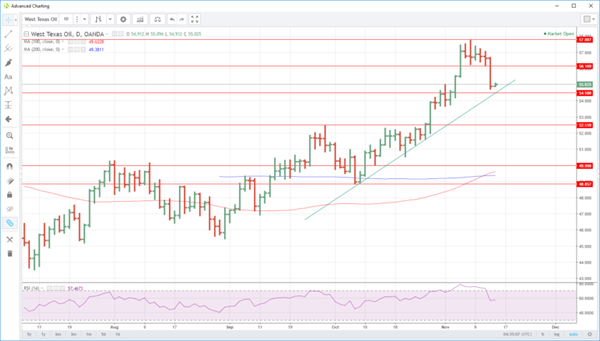
WTI Daily
On a positive note, the technical indicators have unwound their extremely overbought levels and then some. Whether this is enough to support crude prices, as we negotiate tonight's official U.S. Crude Inventories, remains to be seen.
Midday Movers
Midday Movers
At midday, the Yield curve watch goes on in earnest with this mornings downtick in 10 Year UST yield's the primary catalyst behind the drop in USDJPY.
The Aussie dollar continues to struggle after getting sideswiped by domestic Q3 wage price index that missed expectations. However, with the critical US CPI data on tap tonight we're more likely to consolidate at session lows.
The MYR traded to a low of 4.1800 but ran into substantial buying interest on the back of profit taking ahead of tonights US CPI Despite the fall in oil prices overnight the Ringgit remains in favour on the knock-on effect from last weeks hawkish MPC.Given the drop in global commodities, the Ringgit is today's surprisingly excellent performer in Asia FX.
Market Musings
The markets remain on edge as a queasy feeling is settling in around Singapore trading desks. And what drives this sense of foreboding, well simply put, its the fear of losing money of course.
Arguably this has been one of the best years for Traders in some time, and frankly, if you're of the Profesional variety and struggled, you should likely consider a new career.
The convoluted price action we've encountered lately is reflecting little more than traders closing books a bit earlier than usual and taking this year's profits to the bank.
Heading into year-end the only risk that is certain, other than the December US rate hike, is uncertainty itself making risk-taking little more than a fool's errand.
Elliott Wave View: CADJPY Short Term
CADJPY Short Term Elliott Wave view suggests that Minor wave X ended at 87.78. Up from there, pair rallies as a double three Elliott Wave structure where Minute wave ((w)) ended at 89.8 and Minute wave ((x)) is in progress. Subdivision of Minute wave ((x)) takes the form of a double three Elliott Wave structure. Decline to 88.96 ended Minutte wave (w) of ((x)) and Minutte wave (x) of ((x)) ended at 89.64.
Near term, pair has reached the 100% area from 11/6 peak so the minimum target for Minute wave ((x)) has been reached. However, another leg lower still can happen towards 88.22 - 88.56 area before Minute wave ((x)) ends and pair resumes the rally higher or bounce in 3 waves at least. As far as pivot at 87.78 stays intact, expect pair to turn higher. We don't like selling the pair.
CADJPY 1 Hour Elliott Wave Analysis
Market Update – Asian Session: Crude Falls On API Data, A$ Falls On Lower Wage Price Index
Headlines/Economic Data
Japan
(JP) JAPAN Q3 PRELIM GDP SA Q/Q: 0.3% V 0.4%E; ANNUALIZED Q/Q: 1.4% V 1.5%E; NOMINAL GDP Q/Q: 0.6% V 0.6%E
(JP) Japan Economy Min Motegi comments on Q3 GDP data: Domestic demand is flat, overseas demand a positive; nominal GDP at a record ¥546T
Korea
(KR) South Korea Finance Ministry official: Govt withdrew its plan to purchase bonds today as it reviews various ways to handle excess tax revenue
(KR) Bank of Korea (BOK) sells KRW2.1T in 2-yr bonds at 2.18%
China/Hong Kong
(CN) China PBoC Open Market Operations (OMO): CNY330B v CNY280B injected in 7, 14 and 63-day reverse repos prior; Net injection CNY220B v CNY140B prior
USD/CNY (CN) PBOC sets yuan reference rate at 6.6263 v 6.6299 prior
(CN) PBOC Policy Adviser: Worried about impact from financial deregulation in the US
Australia/New Zealand
(AU) Australia Nov Westpac Consumer Confidence Index: 99.7 v 101.4 prior; M/M: -1.7% v 3.6% prior
(AU) AUSTRALIA Q3 WAGE PRICE INDEX Q/Q: 0.5% V 0.7%E; Y/Y: 2.0% V 2.2%E; AUD/USD falls below 0.7580
(AU) Australia sells A$1.0B v A$1.0B indicated in 2.75% Nov 2028 Bonds; avg yield 2.6867%
(NZ) New Zealand Fin Min Robertson reiterates it is government intention to reduce net debt to 20% of GDP within five years - speaking to parliament
Levels as of 23:00ET
Nikkei -1.3%, Hang Seng -0.7%; Shanghai Composite -0.7%; ASX200 -0.4%, Kospi -0.3%
Equity Futures: S&P500 -0.3%; Nasdaq100 -0.3%, Dax -0.3%; FTSE100 -0.1%
EUR 1.1802-1.1786; JPY 113.49-113.04; AUD 0.7632-0.7576;NZD 0.6888-0.6867
Dec Gold -0.1% at $1,281/oz; Dec Crude Oil -1.1% at $55.09/brl; Dec Copper -0.1% at $3.05/lb
Narrative
Following the negative leads from the US, markets opened broadly lower in Asia.
Energy shares have been under pressure, following the 3% decline in oil prices seen on Tuesday’s session. PetroChina has traded lower by more than 4%, while Australia’s S&P ASX 200 Energy Index has dropped by more than 2%.
Airlines have outperformed amid the weakness being seen in oil prices. Shares of Air China have risen by over 4%, while Qantas has gained over 3.5%.
At the same time, the resources sector in Australia is trading with a negative tone. Metals prices in China are trading lower, after copper declined by 2% during yesterday’s New York session. Nickel in Shanghai has opened down by 5%, while iron-ore traded in China has declined by more than 4%.
Steel makers in Japan are trading broadly lower, with shares of JFE down over 3%. Shares of US Steel dropped by more than 2.5% during the US trading session.
Besides this US automakers, Ford and GM, each traded down over 1% and this weakness has seemingly extended into the Japanese trading session. Shares of Toyota and Honda have traded lower by more than 1%, amid the weakness being seen in USD/JPY.
Technology name Softbank has declined by over 0.5%, while in South Korea chipmakers Hynix and Samsung have traded lower by over 0.4%.
In Taiwan, weaker earnings have weighed on tech names. Hon Hai Precision Industry has dropped over 1.5%, as Q3 results missed market expectations. Quanta Computer has declined by over 8% on weaker than expected Q3 profits.
In Hong Kong, the Hang Seng Information Technology index has declined by over 0.5%. Shares of Tencent have weakened by over 0.5%, ahead of its earnings due later today. Semiconductor Manufacturing has declined by over 4%, after reporting weaker than expected Q3 results. China’s small-cap CHINEXT index has declined by over 1.4%.
Meanwhile, property names in Hong Kong are trading generally weaker. The Hang Seng Property and Construction index is off by more than 0.6%. Earlier, China’s planning body, the NDRC, announced that it would ‘conduct pricing supervision’ related to housing.
The Hang Seng Financials index has declined by more than 0.5%. China’s 10-year bond yield is currently lower on the session. Japanese mega banks, Mitsubishi UFJ and Sumitomo Mitsui have traded lower after the companies reported better than expected first half profits and affirmed their FY outlooks. With the declines being seen in the Japanese equity markets, the TOPIX Securities brokers’ index has declined by more than 1%.
The TOPIX Retail Trade index has also declined by over 1%. In Q3, Japan’s private consumption declined by 0.5% q/q, according to preliminary Q3 GDP data.
The overall preliminary annualized GDP figure slightly missed market expectations, while the nominal q/q figure was in line. Net exports added 0.5 pct points to growth, while private inventories added 0.2 pct points.
The Aussie has declined by over 0.6%, while Australia’s 3-year bond yield has dropped by over 5bps. The earlier released Q3 wage price data for the country missed economists’ expectations.
Looking ahead, Australia’s Oct Employment Change is due to be released on Thursday’s session, while US Oct CPI and Retail Sales are due for release later today.
Equities notable movers
Australia/New Zealand
AAC.AU Reports H1 (A$) statutory Net -38M v +48M y/y; EBITDA 16M v 14M y/y; Meat sales 170M v 196M y/y; -10%
ICQ.AU Announces A$10M 1 for 5.8 non-renounceable rights offer priced at A$0.18/share through Bell Potter; +8%
Japan
8316.JP Reports Q3 Net ¥178.7B v 161.5Be; -2%
US
SORL Reports Q3 $0.44 v $0.18e, Rev $101.3M v $63.8Me - filing (1 est); +37% afterhours
Market Morning Briefing: The Pound Has Moved Up A Little In Line
STOCKS
Almost all stocks are trading low and the corrective phase may extend for a few more sessions.
Resistance near 23600 on the Dow (23409.47, -0.13%) is holding well for now and could push the index down towards 23200-23000 or lower in the near term. Near term likely to remain sideways to bearish.
Dax (13033.48, -0.31%) has bounced back from levels near 12960-12900 as expected and while that holds, a bounce towards 13200 is possible. Only if the index breaks below 12900, we would focus on lower levels for the coming sessions.
Nikkei (22246.07, -0.60%) resumed its fall unable to sustain a break above 22500. Lower levels of 21800-21750 are possible in the coming sessions. Dollar Yen (113.17) is also trading lower and a fall below 113.0-112.9 would push Nikkei to further lows in the near term.
Shanghai (3416.21, -0.39%) could test levels near 3380-3370 soon while resistance near 3450 holds. Near term looks bearish.
Nifty (10186.60, -0.38%) is likely to test important support of 10125-10100 today. A bounce from these levels could see another rally towards 10300; else a fall below 10100 could extend weakness for the medium term.
COMMODITIES
Gold (1282.10, -0.06%) could start moving up towards 1300 by next week and move up further by end of this month. Enough room is visible on the upside while support near 1260 holds.
Silver (17.05, -0.16%) could test 17.25 before coming off towards 16.60 again. Overall the price is likely to remain sideways within 17.00-16.60 in the coming sessions.
Brent (61.47) has decent support at 60.85 but the falling momentum looks strong just now and could take the index towards 60. Thereafter a bounce back towards 63 is likely.
WTI (55.11) tested immediate support of 54.75 before closing at higher levels. While 54.75 holds, there is a chance of trading within the 54.75-57.00 region. A sustained break below 54.75, if seen could turn bearish for the price in near term opening up lower levels of 53
Copper (3.0515) may come off towards 3.00 or lower while the Chinese stocks trade lower. An extension towards 2.95 is also likely.
FOREX
Contrary to expectation, the Euro (1.1792) has risen strongly past 1.1745 and the Dollar Index (93.82) has broken below the cited support level of 94.25-20. In retrospect, we missed seeing the Resistance at 95.15 a week ago.
The rise in the Euro/ fall in the Dollar Index has been despite the US PPI rising 0.4% (m/m), higher than the market expectation of 0.1%. It was perhaps triggered by Q3 German GDP coming in at a strong 3.3%, higher than the market expectation of 2.4%. European Q3 GDP clocked 2.5% (y/y), compared to the last us gdp reading of 2.95%.
In the bigger picture, perhaps the fall from 1.2092 to 1.1555 in the Euro was only corrective and we now have to think of possibilities of sideways trade between 1.1850-1500 over the next few weeks.
Dollar-Yen (113.20) has also come down, hurt by the weakness in the Dollar Index. With this, the Resistance at 114.50 has proved to be insurmountable till now. If the expected Support at 113.00 fails to produce a bounce, we may have to consider chances of a fall to 112.00 as well.
Also contrary to expectation, the Euro-Yen (133.85) has risen sharply, pulled up by the rise in the Euro instead of the anticipated rise in Dollar-Yen. Need to see if the cited Resistance at 134 holds or not.
The Pound (1.3136) has moved up a little in line with the expectation of range trade between 1.30-32. The Aussie (0.7588) continues to remain above the Support at 0.7600 and as such the chances of a rise to 0.77 remain valid.
Dollar-Yuan (6.6331) is trading sideways as expected, hesitating to rise past 6.65. Dollar-Rupee (65.42) rose to 65.5350 yesterday, but did not see follow-through buying. Look for a range of 65.30-60 over the rest of the week.
INTEREST RATES
The German-US 10Yr Spread (-1.96%) has dipped from -1.97% as the German 10Yr (0.39%) has come off a bit from the Resistance near 0.42% mentioned yesterday. The German 30Yr (1.28%) has also come off a bit from the Resistance at 1.31%.
Contrary to expectation, the US yields have also dipped a bit. The 10Yr has dipped from 2.40% to 2.38% and the 30Yr has dipped from 2.87% to 2.83%, despite the more than expected rise in the US PPI. Perhaps yields have come down along with the expected dip in Brent (61.56).
With chances of some more downside to 60 on Brent in the near term, US yields could dip some more, but the US 10Yr (2.38%) may has Support in the 2.35-30% region now. Watch the US CPI data release. A number higher than 2.65% (y/y) could pull Yields back higher.
The 10Yr GOI (7.0502%) has continued to rise and may test 7.06-07% before a corrective dip to 7.00%.
EUR/USD Daily Outlook
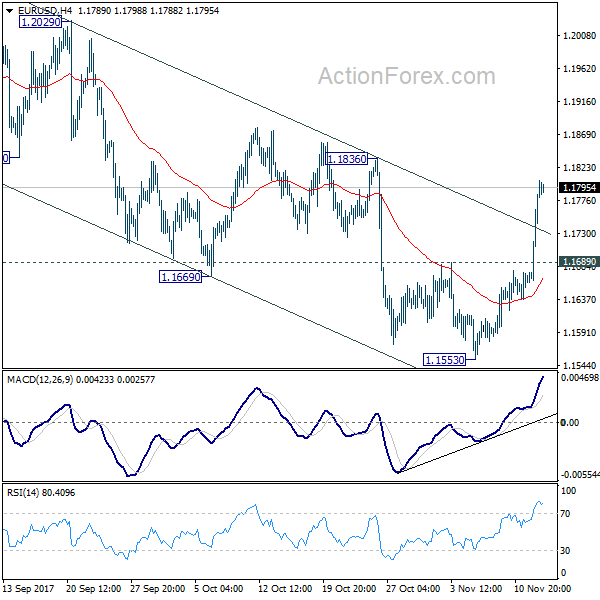
Daily Pivots: (S1) 1.1704; (P) 1.1754 (R1) 1.1848; More...
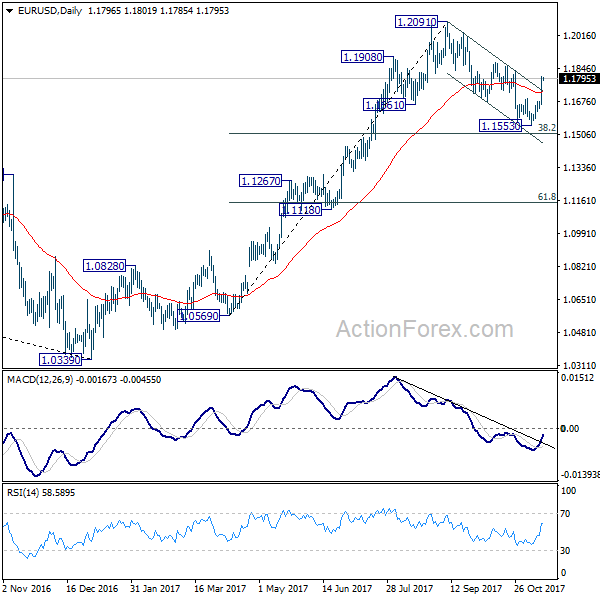
EUR/USD rises to as high as 1.1804 so far and intraday bias remains on the upside for 1.1836 resistance. Correction from 1.2091 has completed at 1.1553 already. Break of 1.1836 will pave the way to retest 1.2091 high. On the downside, below 1.1689 resistance turned support will turn bias back to the downside for 1.1553 low instead.
In the bigger picture, rise from 1.0339 medium term bottom is seen as a corrective move for the moment. Therefore, in case of another rally, we'd be cautious on 38.2% retracement of 1.6039 (2008 high) to 1.0339 (2017 low) at 1.2516 to limit upside and bring reversal. Meanwhile, sustained trading below 55 week EMA (now at 1.1346) will suggest that such medium term rebound is completed and could then bring retest of 1.0339 low.
USD/CHF Daily Outlook
Daily Pivots: (S1) 0.9860; (P) 0.9915; (R1) 0.9949; More....
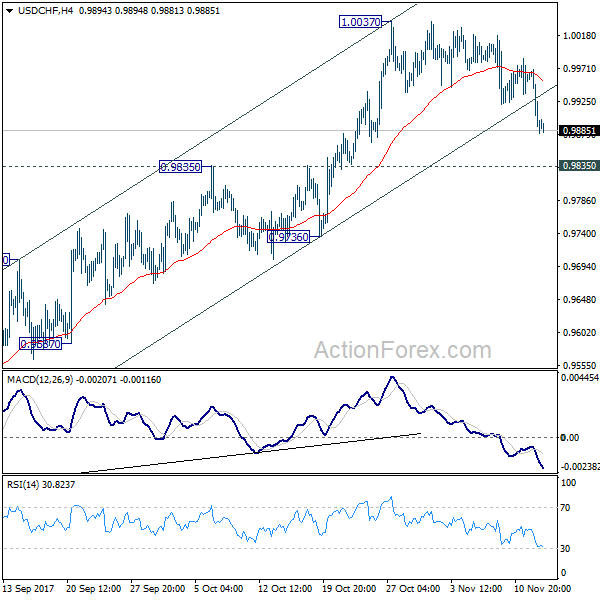
No change in USD/CHF's outlook. As long as 0.9835 resistance turned support holds, further rally is expected. Break of 1.0047 will extend the rise from 0.9420 and target 1.0342 high. However, sustained break of 0.9835 will argue that whole rebound form 0.9420 is completed and turn outlook bearish.
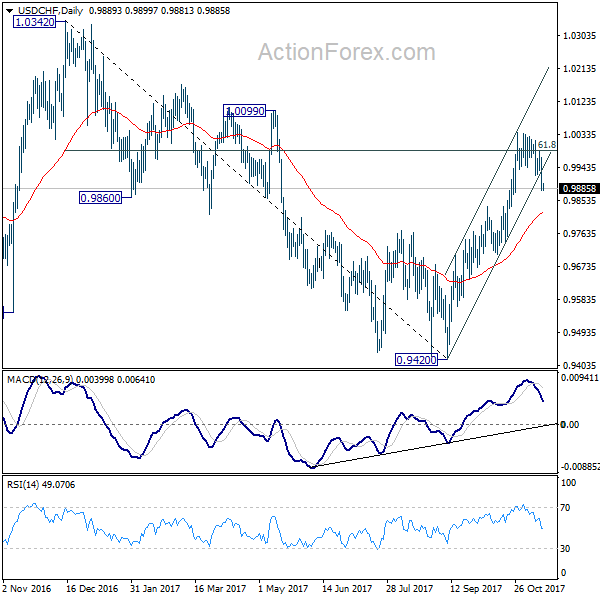
In the bigger picture, current development suggests that USD/CHF has defended 0.9443 (2016 low) key support level again. Rise from 0.9420 could is a medium term up move and should target a test on 1.0342 high. This represents the upper end of a long term range that started back in 2015. On the downside, break of 0.9736 support is now needed to indicate completion of the rise from 0.9420. Otherwise, further rally will remain in favor in medium term.
USD/JPY Daily Outlook
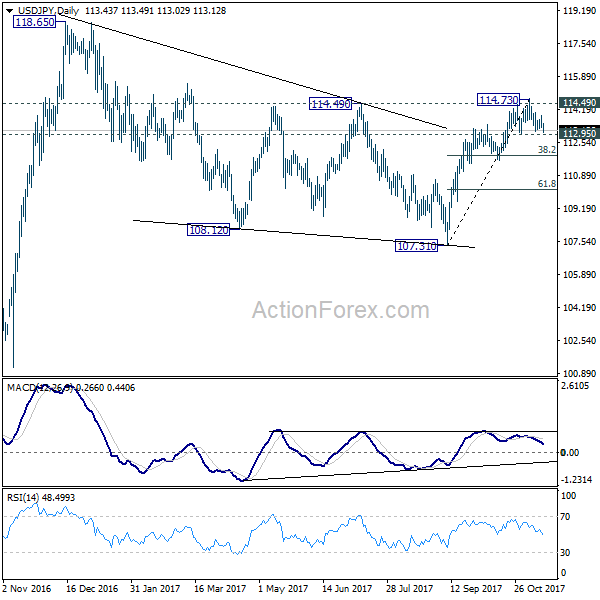
Daily Pivots: (S1) 113.19; (P) 113.55; (R1) 113.80; More...
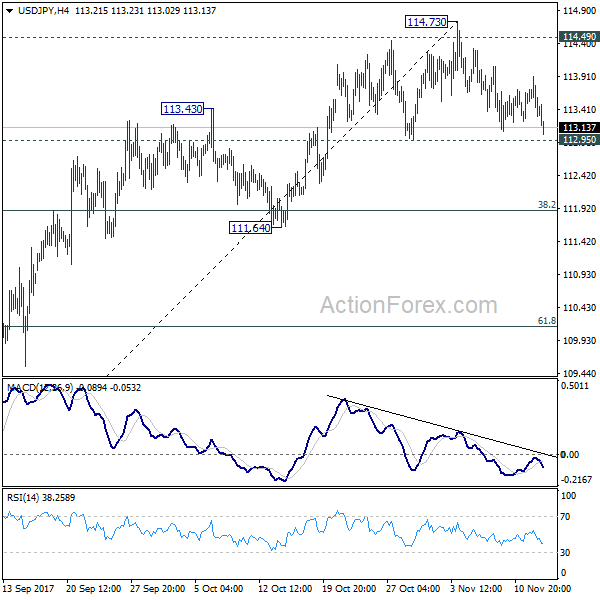
At this point, USD/JPY is still holding above 112.95 support and intraday bias remains neutral first. On the downside, decisive break of 112.95 will indicate rejection from 114.49 resistance. Intraday bias will be turned back to the downside for 38.2% retracement of 107.31 to 114.73 at 111.89 first. On the upside, sustained break of 114.49 key resistance will pave the way to retest 118.65 high.
In the bigger picture, medium term rise from 98.97 (2016 low) is not completed yet. It should resume after corrective fall from 118.65 completes. Break of 114.49 resistance will likely resume the rise to 61.8% projection of 98.97 to 118.65 from 107.31 at 119.47 first. Firm break there will pave the way to 100% projection at 126.99. This will be the key level to decide whether long term up trend is resuming. However, firm break of 111.64 support will dampen this view and turn focus back to 107.31 instead.
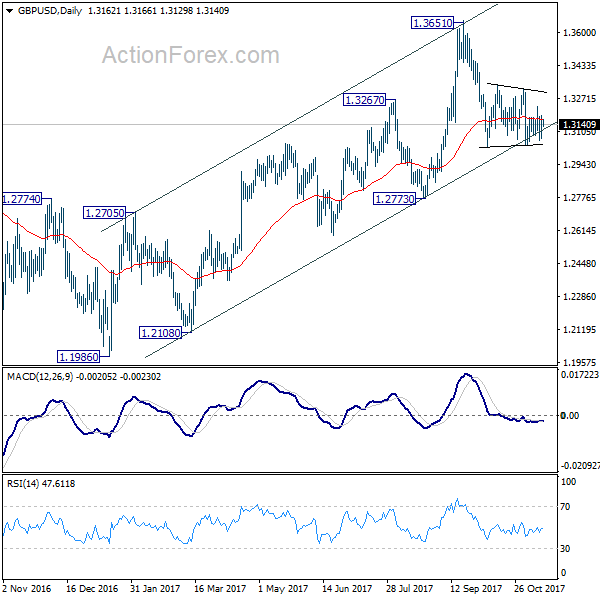
GBP/USD Daily Outlook
Daily Pivots: (S1) 1.3088; (P) 1.3159; (R1) 1.3259; More....
Intraday bias in GBP/USD remains neutral as it's still bounded in range of 1.3038/3337. In case of another recovery, upside should be limited below 1.3337 resistance to bring fall resumption. Break of 1.3038 will now resume decline from 1.3651 to 1.2773 key support level. However, decisive break of 1.3337 will indicate that pull back from 1.3651 is completed and medium term rise from 1.1946 is resuming.
In the bigger picture, as noted before, GBP/USD hit strong resistance from the long term falling trend line. Current development is starting to favor that corrective rebound from 1.1946 low has completed at 1.3651. Decisive break of 1.2773 will confirm this bearish case and target a test on 1.1946 low next, with prospect of resuming the low term down trend. Nonetheless, break of 1.3320 resistance will restore the rise from 1.1946 for 38.2% retracement of 2.1161 (2007 high) to 1.1946 (2016 low) at 1.5466.