
Sample Category Title
Market Morning Briefing: Dollar-Yen Was Unable To Rise Past 113.20
STOCKS
Dow (22641.67, +0.37%) has been moving up in the last few sessions brushing aside all political and economical factors. New highs this week could enable extension of the current rally towards 22750 or even higher towards 23000 in the near term. Bullishness for the coming sessions remains intact. Rejection from 22750 mentioned yesterday may be negated if the upward momentum remains strong.
Does weakness in Euro support Dax? Well that's how the current scenario is. The fall of euro from levels near 1.2090 and the rise in Dax from 11868 has been in tandem as negative correlation between the two seems to be in play. Dax (12902.65, +0.58%) is not far from the 13000 high seen in June’17 and if a rejection fails from 13000, we could possibly see fresh highs in the coming weeks. Near to medium term looks bullish in case 13000 fails to hold on the upside.
Shanghai (3348.94, +0.28%) has been stable for quite a few sessions now and is possibly in a sideways consolidation acting as a base building for a sharp upmove soon. While above 3330, Shanghai could be poised for a rise towards 3375-3400 in the medium term. Downside could be limited to 3325 for now.
Nikkei (20659.12, +0.22%) could test immediate resistance just above current levels and if that holds, we could see some correction from here; else a test of the major resistance near 21000 is on the cards in the coming sessions.
Nifty (9859.50, +0.72%) has some chances of testing 9900-9950 levels in the coming sessions before again coming off towards 9800 or lower in the medium term.
COMMODITIES
Gold (1275.43) has inched up slightly from levels near 1268. A sustained break above 1280 is necessary to take it back towards 1290 or even higher in the near term. Till then the fears of a fall below 1268 will remain on the cards. Note that 1265 is a decent support for the near term and is likely to hold.
Silver (16.73) could move up towards 17 while above 16.50.
Brent (55.63) is in a downtrend and could come off towards 55.00-54.80 in the coming sessions. Near term looks weak just now.
WTI (50.03) is also looking bearish just now and could come off towards 49.50-49.00 in the coming sessions.
Copper (2.9665) is stuck in the 2.90-3.00 region and is possibly towards the end of the sideways consolidation. We could see a rise past 3.00 in the near term. View remains bullish.
FOREX
A bit of slowdown in the Collar's upmove, with the Dollar Index (93.40) down a bit compared to 93.87 yesterday, and the Euro (1.1775) up from yesterday's 1.1707.
While some more Dollar strength is possible in the coming days, note Resistance at 94.50 (21-week MA) on the Dollar Index and Support at 1.16 (21-week MA) on the Euro, which are likely to hold.
Dollar-Yen (112.65) was unable to rise past 113.20 and thus stayed short of our target of 113.50-60. It has been finding sellers above 113.00 consistently over the last 4-5 days, so we need to watch now whether 113.50-60 will be tested at all or not. The chances of it (113.50-60) holding increase.
The Euro-Yen (132.59) looks bullish on the 3-Day Candles, with good trend Support at 132.00-131.50 now.
Relative weakness persists in the Pound (1.3265) while below 1.33-34. Medium-term target 1.30, with immediate Supports at 1.3200-3150.
Decent uptick in the Aussie (0.7860) suggesting that 0.7781, near the 21-week MA, could be providing a decent Support. A test of 0.79 is possible in the near term.
Dollar-Yuan (6.6532) is stable near yesterday's level, with chances of being ranged sideways between 6.62-70 for some days.
Perhaps the dip in the Dollar Index will help Dollar-Rupee to dip towards 65.40-35 today.
INTEREST RATES
The US yields have paused after the recent rise in the last couple of weeks. The yields may now see some sessions of weakness. The 10YR (2.33%) could come off towards 2.30% or a little lower in the near term while the 30YR (2.87%) may test 2.80% before again rising up sharply.
Sharp break above immediate resistances for the US-Japan 10Yr (2.27%). This could be indicative of a sharp upmove in the near term towards 2.35% or even higher. Note that while the differential surges higher, it could pull up both Dollar Yen and Nikkei to higher levels. Also to keep in mind the crucial resistance coming up near 21000 on Nikkei.
The German-US 10Yr (-1.87%) looks strongly bearish for the coming sessions and could be vulnerable to a fall towards -1.90% or lower in the near term. In that case, Euro could see some weakness going forward.
All Eyes On Trump’s Plans For New Fed Chair
Dollar Rally Fizzles as Market Speculates Over Trump's Fed Choice. The dollar stepped back from a 1 1/2-month high against a basket of currencies on Wednesday, as the rally triggered by strong U.S. data fizzled on speculation U.S. President Donald Trump's choice for the next Fed Chair may be a less hawkish candidate than previously thought. The dollar had rallied earlier this week on speculation Warsh may be the leading candidate to replace Yellen, but was capped after Politico reported that U.S. Treasury Secretary Steven Mnuchin favours Fed governor Jerome Powell. The dollar index stood at 93.57, off a 1 1/2-month high 93.92.
Sterling Dragged Further Down by FPC Minutes. Sterling carried on with its slide from the previous trading session, when it dropped to $1.3222, its lowest in almost three weeks after data showing a surprise contraction in the construction sector stoked worries about economic uncertainty surrounding Britain's exit from the European Union. Also adding to a sense of uncertainty, Brexit minister David Davis said on Tuesday that Britain is ready to walk away with no deal, and that officials were “contingency planning” to make sure all scenarios were covered. The currency stood at $1.3259, down 1.0 percent so far this week.
Aussie Rallied on Dollar Weakness. The Australian dollar bounced back a tad after hitting a three-month low on Tuesday after the central bank cautioned that a higher currency would drag on the economy and inflation. The Aussie fetched $0.7850, up 0.2 percent on the day and off Tuesday's low of $0.7785.
Gold Prices Recover from Seven Week Lows. Gold prices have risen above a seven-week low as the US dollar came off its highs. Bullion was pressured earlier by strong US economic data that reinforced expectations of another US interest rate hike this year and pushed the dollar and US bond yields higher.
Oil Prices Dip on Profit-Taking and U.S. Production Fears. Oil prices dipped on Tuesday as speculators took profits for a second day after big third-quarter gains and on concerns that higher prices might spur increased U.S. shale production. Brent crude futures closed down 0.2 percent to $56.00 a barrel, having lost almost 2.5 percent on Monday. U.S. crude fell 0.3 percent to $50.42.
Watch Out Today for:
07:00 am GMT: EUR Non-monetary policy's ECB meeting
17:15 pm GMT: EUR ECB President Draghi's Speech
19:15 pm GMT: USD Fed's Yellen Speech
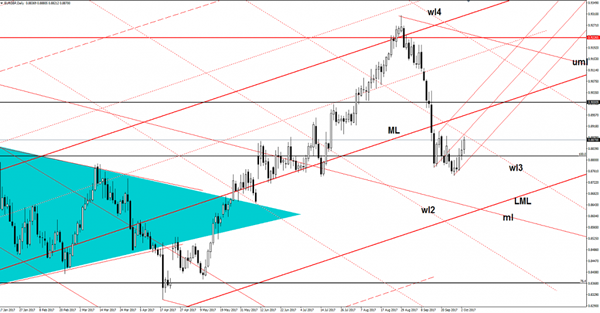
EUR/GBP Further Increase Possible
EUR/GBP increased further and is almost to hit the third warning line (wl3), where he could find resistance again. I’ve drawn a minor ascending pitchfork to catch a potential upside movement. You can see that was attracted by the confluence area formed between the wl3 with the median line of the minor ascending pitchfork. It could increase even if will stay below the median line of the minor pitchfork, but only if will take out the wl3 resistance.
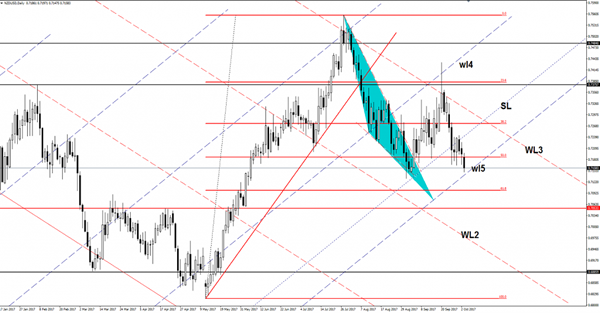
NZD/USD Break Or Bounce?
Price dropped further and is almost to hit the fifth warning line (wl5) of the ascending pitchfork. Technically, it should take out this dynamic support after the retest of the sliding line (SL), but only if the USDX will climb higher after the Tuesday’s indecision. A valid breakdown will signal a further drop towards the second warning line (WL2) of the descending pitchfork.
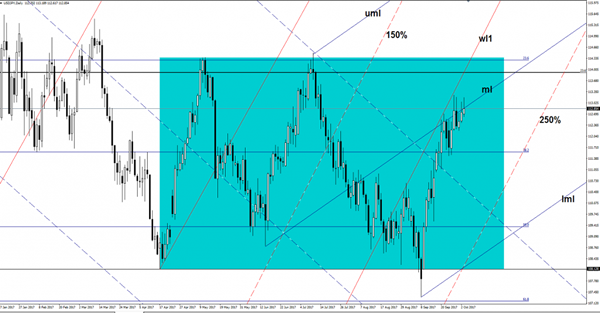
USD/JPY Struggling To Stay Higher
The USD/JPY increased on Tuesday, but failed to reach the 113.25 last week’s high. Continues to pressure the median line (ml) of the blue ascending pitchfork. Technically, has shown some exhaustion signs in the last days after the failure to take out a major dynamic resistance.
Price increased in the last three days as the Yen was punished by the Nikkei’s impressive rally, it should have climbed much higher today as the index has jumped above the 20498 previous high and reached the 20636 level. The USD/JPY upside momentum was paused by the USDX’s decrease, the index has found strong resistance right above the 93.81 horizontal resistance and now is trading much below this major upside obstacle. USDX maintains a bullish perspective on the short term, but only a valid breakout above the 93.81 will confirm a further increase in the upcoming weeks.
Price is pressuring the median line (ml) of the ascending pitchfork, another false breakout will send the price towards fresh new lows in the upcoming days. Only a valid breakout above this obstacle could confirm a further increase towards the 23.6% retracement level.
A USDX’s drop could signal a Nikkei’s minor decrease as well, we’ll see what will happen because tomorrow we have a crucial day for the USD. The US is to release high-impact data, while the FED Chair Yellen will deliver a speech at the Federal Reserve Bank of St. Louis.
Musical Chairs At The Fed Helm?
Musical Chairs as the Fed helm?
Currency markets have come to a byroad as debate rages on concerning the formation of the next FOMC board but more specifically who will be captaining the ship. Betting odds remain skewed for Kevin Warsh, but Fed Governor Jerome Powell is emerging as a potential dark horse and along with it a far more significant dovish inference. If one is wondering why the Dollar was playing a game of ” pass the orange” overnight the Fed Chair debate is what likely sent US bonds bid which basically quashed the markets dollar appetite. At the heart of the Fed Chair discussion, Kevin Warsh favours a more aggressive path on interest rate normalising whereas Governor Powell is more aligned with Janet Yellen’s preference for maintaining the Goldilocks policy of more gradual interest rate hikes. Expect the debate to crescendo as the Fed Chair appointment will be one of if not the primary driver in dollar sentiment as we near years end.
Q4 has gotten off to a whimper as currency markets have more or less turned into a crap shoot with EU political risk simmering, Brexit negotiations ongoing, and of course the markets remain on the “qui vive” for the Fed Chair line of succession. But with the Tump administration burdened by the Las Vegas tragedy and Fiscal reform while readying a request for 29 billion in hurricane disaster relief, the decision process will likely be delayed
With G -10 trade turning into a game a chance, balance of risks are not too favourable on any side of the dollar coin at this stage.Small fractures are developing on most traders’ crystal ball which explains why currency markets have turned timid to start the week.
Japanese Yen
USDJPY gave back yesterday’s LDP poll inspired gains as the Fed Chair Debate rages on. Markets remain confined to tight ranges with 112.50 support and 113.30 being the critical topside level in most traders near term master plan. But there remain sizable Japanese export offers in and around this level and we should expect 113.20-50 to be a formidable barrier until the next dollar catalyst.
Euro
When you can make good arguments to go both long and short near term, it’s likely best to head for the sidelines. With that said, overnight price action and volumes suggest speculators are doing just that as ranges remain tucked up.
Case in point, yesterday the market threw the kitchen sink at EURUSD 1.1700 when 500 mil selling appeared on the EBS net aggressor between 8:45 and 9 AM Singapore time, but with tepid follow through. Similarly, the test of overnight highs around 1.1750 came and went with little fanfare. Clearly, the ongoing political risks in Europe have taken the steam out of the Euro. Looking ahead this week, the single currency remains very susceptible to any pushback from the ECB
Australian Dollar
RBA is firmly on hold and guidance unchanged but revived concerns over housing saw the Aussie trade below .7800.And despite the chorus of acknowledgement that the RBA is lower for longer, shorts were quick to cover sensing this week’s primary AUD downside risk event is behind us.
The AUDUSD remains a USD story as the big picture US policy narrative continues to distract traders from selling the Aussie even with commodity prices weakening.
FX Asia
This picture is nowhere near as dangerous as some would have you believe. With global PMI’s in the green, US ISM surging to the highest level since May 2004, robust China data and Korean exports rising, whats not to like?
The Global growth narrative is alive and well and likely to better by the month which should play favourably into global risk appetite
Despite the likelihood of a Fed hike in December and the plentitude of uncertainties currently facing the G-10 landscape, the ASIA EM background portends favourably for local exporting countries.
The undeposited and undervalued Malaysian Riggit could find significant support in this scenario.
USD/CAD Canadian Dollar Higher Ahead Of US Oil Inventories
The Canadian dollar climbed against the US dollar on Tuesday. The hawkish words from Bank of Canada (BoC) Deputy Governor Sylvain Leduc. The BoC official said that while growth in Canada is expected to decline, it will still exceed the rate of potential output. While Leduc did not comment about monetary policy a higher output economy is likely to experience higher inflation that could in turn trigger higher rates.
The Canadian central bank was criticized for hiking rates in September with little warning for markets. This contrasted heavily against the comments in June that gave a heads up to investors about an upcoming rate hike. The two rate raises in 2017 could still be joined by another before the end of the year, but only if economic growth does not lose too much momentum. Leduc’s words seem to support that theory.
Oil declined on Tuesday as supply continues to be plentiful as Organization of the Petroleum Exporting Countries (OPEC) and the United States have increased production. The geopolitical situation in Northern Iraq is an ongoing concern but so far there hasn’t been any disruptions of crude output. The API oil inventories were released this afternoon and showed a drawdown of 4.1 million barrels and a large buildup of gasoline stocks.
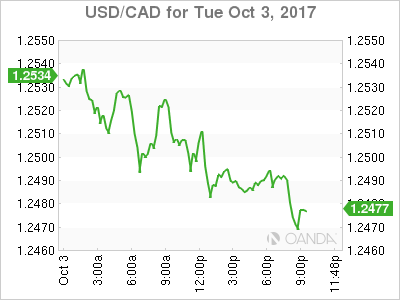
The USD/CAD lost 0.224 percent on Tuesday. The currency pair is trading at 1.2486 after words from Bank of Canada (BoC) Deputy Governor Leduc saw the lone advanced versus the greenback. The BoC quickly matched the two rate hikes from the U.S. Federal Reserve with a 25 basis points rate hike in July and another in September. The Canadian benchmark interest rate is now 1.00 percent compared to the 100–125 basis points range for Fed funds rate. While the Fed has continued to support a third rate hike, the economy has slowed down. The situation in Canada turned suddenly with bigger than expected growth in the second quarter that gave the central bank confidence to hike borrowing costs.
The final quarter of the year will be crucial for how both central banks decide regarding monetary policy. The Fed has made it clear it will not wait for inflationary pressures before it raises rates. The BoC might not have to make that choice as inflation continues to move higher.
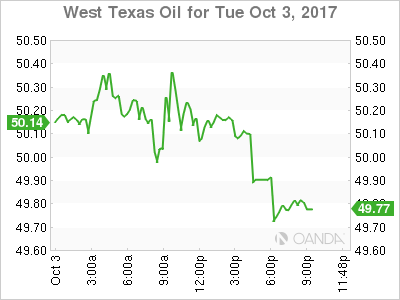
Energy prices lost 0.304 in the last 24 hours. The price of West Texas Intermediate is trading at 50.11 with crude in a tight trading range awaiting US economic indicators and crude inventories on Wednesday. The recovery of US refineries and drilling operations following the hurricanes in the US has ignited a sell off as investors foresee an increase in supply with no change to demand in the short term.
Comments form Organization of the Petroleum Exporting Countries (OPEC) Secretary General about compliance with output limits is high. Northern Iraqi supply continues pass through Turkey as the fate of independence is still uncertain. Traders will be monitoring the release of the US crude inventories by the Energy Information Administration (EIA) on Wednesday, October 4 at 10:30 am EDT. US stocks are expected to have dropped by 500,000 barrels last week.
Market events to watch this week:
Wednesday, October 4
4:30 am GBP Services PMI
8:15 am USD ADP Non-Farm Employment Change
10:00 am USD ISM Non-Manufacturing PMI
10:30 am USD Crude Oil Inventories
3:15pm USD Fed Chair Yellen Speaks
8:30 pm AUD Retail Sales m/m
8:30 pm AUD Trade Balance
Thursday, October 5
8:30 am CAD Trade Balance
8:30 am USD Unemployment Claims
Friday, October 6
8:30 am CAD Employment Change
8:30 am CAD Unemployment Rate
8:30 am USD Average Hourly Earnings m/m
8:30 am USD Non-Farm Employment Change
8:30 am USD Unemployment Rate
Dollar Mixed On Improving December Rate Hike Odds
Market prices in a 80% chance of a rate hike in December
The USD is mixed on against major pairs ahead of the first jobs report this week. The dollar has struggled to appreciate against geopolitical factors at home and abroad. Last week the U.S. Federal Reserve through member speeches is still committed to tightening monetary policy despite some dissent in their ranks. Fed Chair Janet Yellen is the biggest name pushing for more interest rate raises sooner rather than later. Economic data releases between now and the final Fed meeting of the year will be crucial.
Employment data has been a solid pillar of the US economic recovery, but given the lack of wage inflation the reports are more heavily scrutinized in search of more solid growth signals. This week’s data will be affected by the tropical storms earlier in the month. The ADP Non-Farm Employment Change will be published on Wednesday, October 4 at 8:15 am EDT. Private payrolls are expected to slow down and fall to below 200,000.
The ISM Non-Manufacturing PMI will be published at 10:00 am EDT. Manufacturing indicators on Monday beat expectations and touched a 13 year high. Non-manufacturing is expected to improve 55.5 and the market will be following to see a similar reactions from the Service industry after the impressive manufacturing rebound. Fed Chair Janet Yellen will give a speech in St. Louis at 3:15 pm EDT. Improving data, in particular leading indicators that signal higher inflation could ignite another dollar rally after the CME FedWatch tool is already showing a 81.7 percent chance of the Fed funds rate hitting 125–150 basis points in December.
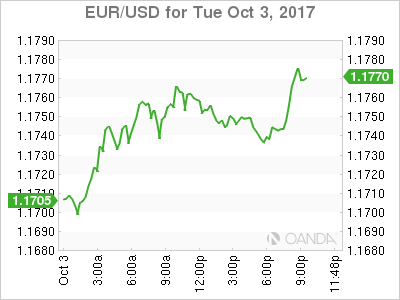
EUR/USD lost 0.039 in the last 24 hours. The single currency is trading at 1.1743 as the situation in Catalonia has stabilized but question marks remain about how united the Euro zone really is. Brexit anxiety has not helped the Euro as infighting within the Conservative party could steer the ship back to a hard breakup with Europe.
Central bank divergence between Europe and the United States continues. While the Fed is ready to hike at least once more in 2017 the European Central Bank (ECB) has been coy on how it will start tapering its QE program and/or move away from negative rates before the end of the year. Political turmoil in the US has kept the euro strength and even with a tax reform push from the Trump administration the greenback has failed to take full advantage of a supportive Fed.
Speeches from ECB head Mario Draghi and Fed Chair Janet Yellen on Wednesday could bring some clues into their thinking, but give that the context is not ideal there could be little in terms of actual information. Draghi will be inaugurating the ECB visitor center in Frankfurt, while Yellen will be at St. Louis delivering opening remarks for a community banking conference.
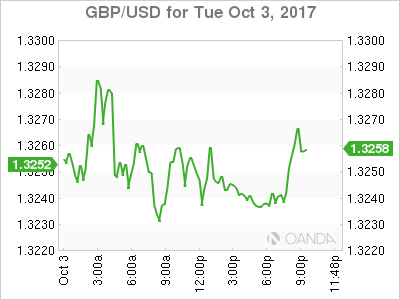
The GBP/USD lost 0.309 on Tuesday. Cable is trading at 1.3240 after Brexit terms within the Conservative party were at ends. The supporters of the Leave campaign had criticized openly the decision by British Prime Minister Theresa May to opt for a softer Brexit that would allow the UK to remain as part of the single market through an agreed payment. Boris Johnson was deeply set against this idea, but today he has backtracked and claims that the cabinet is united on May’s Brexit strategy.
Weak manufacturing data on Monday and a follow up by construction indicators on Tuesdays have hurt the pound. The currency has appreciated on the back of a potential rate hike by the Bank of England (BoE), but if the economy loses traction before the central bank pulls the trigger it could give Govenor Carney time to reconsider. Service PMI data will be released on Wednesday, October 4 at 4:30 am EDT. The reading is expected to be almost flat, but any risk to the downside will be quickly acted upon in the price of the GBP following the release.
Market events to watch this week:
Wednesday, October 4
4:30 am GBP Services PMI
8:15 am USD ADP Non-Farm Employment Change
10:00 am USD ISM Non-Manufacturing PMI
10:30 am USD Crude Oil Inventories
3:15pm USD Fed Chair Yellen Speaks
8:30 pm AUD Retail Sales m/m
8:30 pm AUD Trade Balance
Thursday, October 5
8:30 am CAD Trade Balance
8:30 am USD Unemployment Claims
Friday, October 6
8:30 am CAD Employment Change
8:30 am CAD Unemployment Rate
8:30 am USD Average Hourly Earnings m/m
8:30 am USD Non-Farm Employment Change
8:30 am USD Unemployment Rate
Is There an “Invisible Hand” Behind the 2 Percent Inflation Target Rate?
"It ain't what you don't know that gets you into trouble. It's what you know for sure that just ain't so." - Mark Twain
Executive Summary
The Federal Open Market Committee's (FOMC) 2 percent inflation goal is often targeted by adjusting the FOMC's monetary policy stance. The implicit assumption (or the invisible hand) behind the 2 percent inflation target is that the inflation rate is mean-reverting at the 2 percent rate. However, this assumption requires further inspection and raises questions regarding the possibility that the inflation rate would deviate from the target rate. Moreover, what is the behavior of above-/below-target inflation? Are these deviations temporary or permanent in nature?
An inflation target plays a critical role in the FOMC's monetary policy decision making process. Therefore, testing, instead of assuming, to determine if the PCE inflation rate is mean-reverting is crucial for decision-makers.
Our statistical analysis suggests that the PCE inflation rate may be mean-reverting, although the evidence is tenuous. So, can we assume inflation is mean-reverting, and what level of confidence do we have? A mean-reverting series, by definition, can fluctuate from its mean but eventually returns to some average value. The next challenge is to estimate the pace of adjustment. That is, how long does it take the inflation rate to return to the target rate after deviating from it? And does the PCE inflation series have a persistence/autocorrelation problem?
Why is persistence/autocorrelation of the inflation rate a concern for decision-makers? Inflation persistence has crucial policy implications as a consistently below-/above-target inflation rate would suggest an accommodative/restrictive monetary policy for an extended period of time, all else constant. Therefore, a very slow pace of monetary policy normalization would be a possible result if below-target inflation persists for an extended period of time.
To Anticipate the Results
Our analysis indicates that inflation has an autocorrelation problem. Put differently, when the inflation rate deviates from the target rate, inflation takes a long period to get back to the 2 percent target rate. One major reason is that the current inflation rates are highly correlated with the past values (coefficients are very high, close to one). Therefore, the inflation rate would take a longer time to get back to the target rate than if autocorrelation were not present. For example, during the period from November 2008 to August 2017, the inflation rate was below the 2 percent target for 86 out of 106 months.
Furthermore, persistently low inflation may not only affect interest rates but also other variables. One of them is the unemployment rate, as the Phillips curve suggests an inverse relationship between the unemployment rate and inflation. The recent debate about the Phillips curve status is reflective of the characteristic that the original Phillips curve does not allow for an autocorrelation problem. Persistently low inflation may also explain part of the slower wage growth in recent years. Low inflation rates may reduce business production and their ability to raise prices, and, thereby, may affect profit margins in a low-productivity economy. The wage-price spiral may have lost its speed as well.
The 2 Percent Inflation Target Rate: Is Inflation Mean-Reverting?
Statistically, if a series is mean-reverting then that series will move around its mean (the FOMC is assuming the 2 percent is the mean) and deviations from the mean (higher/lower inflation periods) are temporary in nature. As a policy model, the FOMC's 2 percent target assumes, implicitly, the inflation rate is mean reverting.
We live in a constantly changing world and need to test, instead of assume, that the PCE inflation rate is mean-reverting. We apply a unit root test (ADF test) to find out if the inflation rate is mean-reverting.1 The PCE deflator (year-over-year percent change) is the preferred inflation measure of the FOMC, and, thereby, we utilize that series in our analysis, Figure 1.
For the 1984-2017 period, we find the inflation rate is mean-reverting and the mean is 2.3 percent. In the next step, we apply the state space approach to test the possibility of a structural break in the inflation rate series. If we find a structural break in the inflation rate and the break coefficient is positive (negative), then that indicates the inflation rate has shifted upward (downward) since the break date. We found two breaks - one positive and the other negative. Both breaks represent the price swings during of the 2008-2009 financial crisis. Therefore, the inflation path temporarily shifted and then returned to the long run average - a typical behavior of a mean reverting series.
Autocorrelation: When Slow and Steady May Not Be Enough to Win the Race
If a series is mean-reverting, the fluctuations from the mean are temporary - but fluctuations still exist. Thus, while inflation rates may deviate from the mean, it is crucial to find out the pace of adjustment. How long does it take inflation to get back to the mean? PCE inflation persistently above or below the 2 percent target rate is not ideal for the FOMC. Both of these scenarios would ask for an extended period of a particular monetary policy stance. One way to test if the inflation rate series has a persistence problem is to test for an autocorrelation. The inflation data having an autocorrelation problem would indicate that the farther the inflation rate deviates from the target rate, the longer the inflation rate would take to return to the 2 percent target rate.
We estimate autocorrelation functions (ACFs), and the estimated correlation coefficients are nonzero, statistically, for first 12 lagging months, Figure 2. Furthermore, if the estimated coefficients are non-zero then that indicates the underlying series has the autocorrelation problem. We found that the PCE inflation series is autocorrelated, which indicates current inflation rates are highly correlated with its past values (coefficients are very high, close to one). Therefore, the inflation rate would take a longer time to get back to the target rate. During the period from November 2008 to August 2017, the inflation rate was below the 2 percent target for 86 out of 106 months. This gives reason for the market's expectation that the pace of monetary policy adjustment would be gradual as well.
Why is the persistence/autocorrelation of the inflation rate noteworthy for monetary policy decision-makers? Inflation persistently below the target would indicate an accommodative monetary policy for an extended period of time, all else constant. Therefore, a very slow pace of the monetary policy normalization is a possible result of persistently lower inflation.
Final Thoughts: The Invisible-hand may need a Boost
The mean-reverting along with lack of autocorrelation/persistence assumptions may be the 'invisible hand' behind the 2 percent target rate. However, our findings of autocorrelation suggest the invisible hand may need a boost. Moreover, the autocorrelation/persistence problem has broader implications for decision makers, as persistently lower inflation may not only affect interest rates but also other variables. One of them is the unemployment rate, as the original Phillips curve does not anticipate an autocorrelation problem, Figure 3. A persistently low inflation rate may also explain part of the slower wage growth in recent years. The persistently low inflation rate may reduce business production and their ability to raise prices and thereby may affect profit margins in a low-productivity era. The wage-price spiral may have lost its speed as well. Therefore, the invisible hand behind the inflation rate may need a boost.
Why the Party Congress is Key for China’s Road Ahead
- In this piece, we provide a Q&A answering five key questions about the 19th National Congress of the Communist Party that starts on 18 October.
- A key focus will be whether President Xi Jinping strengthens his power even more by putting mainly his 'own' people into the Standing Committee of the Politburo - the top leadership of China.
- Another key focus will be what happens on the other side of the Congress on economic reforms. Will implementation get a new push? Or will it continue to lag, with the risk of China running into severe problems down the road?
- We are cautiously optimistic that Xi Jinping will find a middle road and not strengthen his power so much that it creates a backlash at a later stage. We also see a good chance that reform implementation moves up the agenda next year following his first term in which Xi has focused on politics and his power base.
- Nevertheless, continued focus on deleveraging and the cooling of the housing market is set to lead to a slowdown in China over the next year. However, what happens after that depends a lot on how China moves on reform and financial risks.
What to watch for - and when?
- The Congress runs from 18 October for one week.
- On the first day, the President will present the Work Report. It will take stock of China's achievements and outline policy for the coming years.
- On the day after the Congress ends (typically after a week), the Central Committee will have its 1st Plenum. The Standing Committee of the Politburo will be presented afterwards.
A few facts on Chinese politics
- Since 1992, the Chinese leader has been in office for two terms, each of five years.
- The leader is appointed at the Party Congress and typically has more leading positions. Xi Jinping is both General Secretary of the Party, President and Chairman of the Central Military Commission (CMC).
- Xi Jinping was appointed president in 2012 following the two five-year terms of Hu Jintao in the period 2002-2012. Before that Jiang Zemin was President from 1992- 2002. He took over from Deng Xiaoping who was China's leader (although not President) 1979-1992. Deng Xiaoping launched the reform and opening up policy that paved the way for China's rise.
- It is the norm that the next president is designated at the Party Congress five years in advance.
- Since 2002 the Party has had an informal rule that a person cannot continue in the Standing Committee of the Politburo if the person has turned 68.
- Since Mao, it has been the norm that leadership is 'collective' representing different factions rather than decided by one faction - or person - only. This was a counter-reaction to Mao's dominance in power.
#1: The 19th Congress - what is it?
Since 1982 The National Congress of the Communist Party has taken place every five years. The year of the Congress is the 'election year' in China as the top leadership of China - the Standing Committee of the Politburo - is appointed at the end of the Congress. The Standing Committee typically consists of 5-9 members and currently has seven members including the President Xi Jinping and the Premier Li Kegiang.
The Politburo consisting of 25 members (including the Standing Committee members) is a part of the Central Committee that currently consists of around 375 full and alternating members. The total number of delegates at the Congress is roughly 2,200.
While the Standing Committee is officially appointed at the Congress, the decision is in reality taken in advance by the top leadership - and sometimes previous leaders.
#2: Why is it important?
1. Reform implementation or not? One reason the Congress is important is that the people appointed for the Standing Committee will say a lot about where the political and economic winds are blowing in China. Will the leadership include liberals and reformers? Or is it less reform-friendly people. At the Third Plenum of the Central Committee in 2013 that followed the 18th Congress in 2012, Xi Jinping put reforms very high on the agenda. However, implementation has lagged a lot since then. One of the key questions after the 19th Congress will be whether reform implementation gets a new push because Xi Jinping feels more secure after setting his 'own team' to work over the next five years. Whether we see such a push could prove crucial for China's future path as supply side reforms are increasingly important as part of dealing with misallocation of credit and avoiding the so-called 'middle income trap' in which many countries have experienced stagnation after a rapid period of growth to middle income levels.
2. More power to Xi? The Congress is also important because it will say a lot about whether Xi Jinping will strengthen his political power even further. Since he became president five years ago Xi has spent much focus on reviving a party that he saw as threatened from the inside by widespread corruption and eroding discipline. He launched a corruption and frugality campaign that has been much fiercer than any previous campaign, with removal of people at all levels. Most noteworthy was the life sentence to Politburo member Bo Xilai in 2012 for corruption. But as late as July this year the Party Secretary of Chongqing and Politburo member Sun Zhengcai was removed on allegations of corruption and last week he was expelled from the party. He was a candidate even mentioned for the top two leadership when Xi's term ends in 2022.
Xi has also centralised decisions to a great extent and put himself at the head of the table in a long list of Leading Small Groups in the Party that are removing power from the Government (State Council) to the Party. In addition, he focused on reforming the military and state security during his term. And he has tightened control with media and strengthened the role of the Party in the corporate sector. Last year Xi was named 'core leader' of the Party in a further strengthening of his power leading up to this year's Party Congress. Xi is widely believed to be the most powerful leader since Deng Xiaopeng who was China's leader from 1979-1992.
#3: What are the key things to watch?
In order to evaluate the above points several key things will be watched at the Congress:
What number of people in the Standing Committee?
At the moment the Standing Committee has seven members, but before that during the last term of Hu Jintao it had nine members. If the size of the Standing Committee is shrunk even further, it will be seen as a sign of Xi taking more power. If smaller, it would most likely consist of mainly his own supporters. A bigger Committee will give more room for including people belonging to other factions of the party.
Who is appointed?
If Xi mainly puts his 'own' people in the Standing Committee, it's clearly another tightening of his grip on power - and a further move away from the tradition of 'collective leadership'. Whether he chooses reformers could be a sign of how high economic reforms will be prioritised next year. Another uncertainty has related to whether Xi Jinping will replace Li Keqiang as Premier, as he has been seen as a 'weak' Premier and might be blamed for the economic problems. But the most recent expectation among China watchers is that Xi will keep him on so as not to stir things too much.
Will the '7 up, 8 down' rule be respected?
Another issue is whether Xi will respect the informal rule '7 up, 8 down'. This rule has been in place at the past three National Party Congresses (since 2002), but was not used prior to that. If Xi respects the informal rule then all five members apart from Xi himself and the premier Li Kegiang will be replaced. However, last year a senior party official Deng Maosheng cast doubt over this when he referred to it as 'folklore' and added that the 'party makes adjustments according to the circumstances'. Since then a lot of speculation has taken place whether Xi Jinping would keep Wang Qishan who heads the Central Commission for Discipline Inspection and is leading the fight on corruption. Wang Qishan is widely seen as China's de facto number two leader and acting as Xi's right hand. But aged 69 he is supposed to step down if the informal rules are followed. Lately the winds among commentators have blown in the direction that Wang Qishan will not stay on and he also said recently it was soon time for him to step down. We will know by end-October.
Will Xi Jinping designate a successor?
It is also a norm that a successor for the current President is designated at the Congress after the sitting President's first term. Both Hu Jintao and Xi Jinping were elevated to the Standing Committee as vice-presidents in the term ahead of their presidencies and it was clear they would take over after that term. If this is repeated then we should look for this to happen again. It will have to be a person aged 57 or younger in order to serve five years in the Standing Committee before serving two five-year terms as President.
However, it has been speculated that Xi may not designate a successor now. Either he may wait to have more to time to find his successor. Or he may try to go for a third term. This would require a change of the State Constitution, though. Another scenario mentioned has been what's called a 'Putin-Medvedev' model in which Xi steps down as President after 2022 but stays in the Standing Committee while choosing a President that will follow his orders.
What will Xi put into the Constitution?
It is normal for Presidents to add 'thoughts' and 'theories' to the Constitution in connection with the Party Congress. On 18 September Chinese news agency Xinhua reported that amendments to the Constitution would include 'the key theories and strategic thoughts' so as to 'fully represent the latest sinicization of Marxism'. A key question is whether Xi's name will be included in the amendments. Only Mao and Deng Xiapeng have been attached to the political philosophy so far. Neither Jiang Zemin or Hu Jintao added their names. Clearly if Xi's name is added it will be another demonstration of power. The most recent rumours suggest that this will be the case. If so, it would put him next to leaders like Mao Zedong and Deng Xiapoing, while neither Jiang Zemin or Hu Jintao has their name in the Constitution. A further strengthening would be if Xi reintroduces the word 'Chairman' of the Communist party to replace the title 'General Secretary'. The term 'Chairman' was removed in 1982 at the first Party Congress after Deng Xiaopeng came to power and was replaced by the term 'General Secretary' to signal a removal of the absolute power that Chairman Mao had taken.
What will the Work Report say?
At the first session the President will hold a speech and present the Work Report outlining what has been achieved and guidelines of future policy. Since Xi Jinping has already been in power for five years it will likely not be big changes compared to current policy. How much reforms are stressed compared to previous occasions may give a signal of where policy is going. However, the problem with reforms has not been that the policy is not there but more that it has not been followed up by implementation.
#4: Will it lead to any changes in economic policy?
The focus of the Congress is mainly politics. But we may get some clues on whether we see any adjustments on economic policy possibly stressing financial risks and need for reform. In reality, though, we will not really find out until next year to see if reform implementation is getting a higher priority.
Overall, we should expect continuity when it comes to economic policy. However, we are cautiously optimistic that Xi after having secured a stronger power base will have more energy to put more weight behind the reform agenda. Much of his first term has focused on 'cleaning up' the party from corruption, securing control over the army and to some extent also taking a lead role in China going global and adopting a stronger position in global governance. Xi Jinping is by a long way the Chinese leader who has visited the most countries. But his legacy will be much determined by whether he succeeds in implementing the reform agenda he laid out at the 3rd Plenum of the Central Committee in 2013, which caused a lot of optimism - an optimism that has later faded significantly as reforms have been missing and the state has taken stronger control in many areas.
Should Xi fail to carry through the reform agenda his goal of making China a moderately prosperous society by 2020 will be difficult. A lack of supply side reforms will continue the misallocation of credit and most likely lead to significant debt losses and crisis at some point down the road.
#5: Will it matter for financial markets?
The Congress as such is not likely to have a big impact on markets. If anything, it could be positive for risk sentiment if at the Congress we get a clearer signal on the need for reforms. But the markets may be sceptical after the disappointment following the 3rd Plenum, which was strong on words but lacked implementation.
Regardless of the Congress, we do expect the Chinese economy to slow down. Cooling the housing market and dealing with financial risks have moved to the core of economic policy. We look for a continuation of these policies to increasingly weigh on Chinese activity over the next year. Hence, over the next year we expect China to be a moderate drag on global growth, be a disinflationary force and give less support to commodity markets.
In the long term, though, the Congress will be more important for financial markets, as whether China over the next five years is able to deal with financial challenges and carry through supply side reform will be crucial, not just for China but for the global economy.